Influence of Immigration Policies on Supply of Ethnic Business Entrepreneurs in Canada - Ryerson University
←
→
Page content transcription
If your browser does not render page correctly, please read the page content below

Influence of Immigration Policies on Supply of
Ethnic Business Entrepreneurs in Canada
Shuguang Wang & Rebecca Hii
RCIS Working Paper No. 2019/1
March 2019

                                SERIES EDITOR
                                Usha George

                                Ryerson Centre for Immigration & Settlement
                                Ryerson University
                                Jorgenson Hall, 627
                                350 Victoria Street, Toronto, ON M5B2K3
                                http://www.ryerson.ca/rcis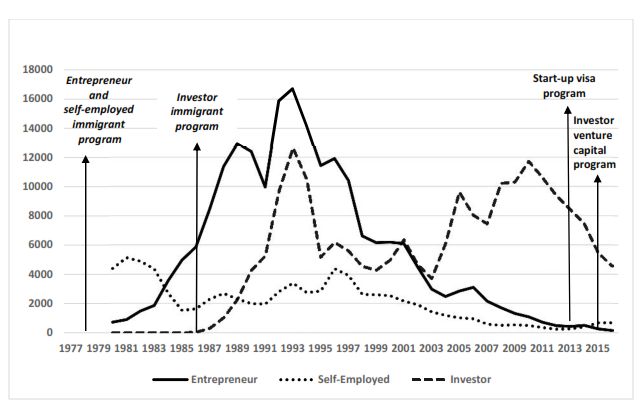
RCIS Working Paper
                                       No. 2019/1

        Influence of immigration Policies on Supply of Ethnic
                 Business Entrepreneurs in Canada

                         Shuguang Wang
Department of Geography and Environmental Studies, Ryerson University

                               Rebecca Hii
            Ph.D. Program in Policy Studies, Ryerson University

                               Series Editor: Usha George

 RCIS Working Papers present scholarly research of all disciplines on issues related to
 immigration and settlement. The purpose is to stimulate discussion and collect feedback.
 The views expressed by the author(s) do not necessarily reflect those of RCIS. For a
 complete list of RCIS publications, visit www.ryerson.ca/rcis

 ISSN: 1929-9915

               Creative Commons Attribution-Noncommercial-No Derivative Works 2.5
               Canada License
S. Wang & R. Hii
Abstract
Traditional theories deal with ethnic business mainly from the perspectives of structural
opportunities and ethnic group characteristics. While they explain very well why some
ethnic groups have higher rates of business formation and ownership than others, much
less attention has been paid to the role of government policies in regulating the inflow of
business immigrants and channelling ethnic entrepreneurs and related resources into
different business sectors. Using Canada as a case study, this paper examines how
changes in immigration policies have influenced business immigrant flows and ethnic
business development (since most ethnic businesses are initiated and run by immigrants).
This study found that the recent changes in Canada’s immigration programs have resulted
in substantial decrease in the inflow of business immigrants, and may turn many
resourceful business immigrants to the competing countries of the U.S., Australia and the
UK, which all have more affordable and less restrictive investment requirements. The
paper suggests that future studies of ethnic business should be expanded to include
immigration policies as an explicit facilitating or restricting factor.
Keywords: immigration policy; business immigrants; ethnic business; Canadian
immigration
iRCIS Working Paper No. 2019/1
Table of Contents
Abstract................................................................................................................................. i
Table of Contents ................................................................................................................. ii
Introduction ......................................................................................................................... 1
A Synopsis of Immigration Policy Theories .......................................................................... 2
The Evolution of Canadian Business Immigration Programs since 1978 ............................ 4
The 1978 Entrepreneur and Self-Employed Immigrant Programs, and the 1986 Investor
Immigrant Program.................................................................................................................4
Provincial Business Immigrant Programs and Streams ..........................................................6
Start-Up Visa Program and Investor Venture Capital Program ..............................................8
Policy Outcomes .................................................................................................................. 9
Implications for Future Development of Ethnic Business in Canada ................................ 15
Conclusions ........................................................................................................................ 17
References ......................................................................................................................... 20
iiS. Wang & R. Hii
Introduction
Ethnic business refers to commercial enterprises that are owned and operated by
members of an ethnic group, and that offer culturally specific and suitable goods to serve
the co-ethics of the business owners. The history of ethnic business is almost as long as
the history of immigration of minorities in the immigrant-receiving countries. In recent
decades, ethnic businesses have both proliferated and diversified. Accordingly,
progressive theorization has been made by more than one generation of scholars to
advance our understanding of the meanings of ethnic economy and entrepreneurship.
However, most existing theories (such as Blocked Mobility, Cultural Resources, Enclave
Economy, and Interactive Model of Entrepreneurship) deal with ethnic business from the
perspectives of labour market discrimination, opportunity structure, and ethnic group
characteristics. These theories assume (implicitly) that the ethnic entrepreneurs are
already in the “country of immigration”, and aim to explain why some ethnic groups have
higher rates of business formation and ownership than others, thus leading to the
development of ethnic economies with high levels of institutional completeness. Yet, they
are inadequate to explain where the entrepreneurs and their business capital come from,
and much less attention has been paid to the role of government policies in recruiting and
channelling immigrant entrepreneurs and related resources into ethnic businesses.
The more recent theory of Mixed Embeddedness advances the study of ethnic
entrepreneurship one step further by linking opportunity structure – the pivotal concept in
the Interactive Model of Entrepreneurship – with the supply side of the entrepreneurial
market (Kloosterman, van der Leun and Rath, 1999; Kloosterman, 2006). Adopting a
political economy perspective, the Mixed Embeddedness thesis unpacks the notion of
opportunity structure by looking at the way different opportunity structures are
institutionally embedded, and argues that immigration policy influences (or interferes)
opportunity structure (Kloosterman, 2006). For example, in addition to the existence of a
sufficient demand for a certain bundle of ethnic products, the (contemporary) aspiring
entrepreneurs must have the right kind of resources, including financial, human and social
capitals. Invariably, business immigrant policies aim to select business immigrants who
possess the required level of financial and human capital to start a particular business, but
exclude those who do not. Business immigration policy adjustments in response to
changes in the nation’s economic conditions often also influence opportunity structures.
Conceptually, the mixed embeddedness framework explicitly links the micro-level
economic actors (the immigrant entrepreneurs) with the meso-level economic
environment (the opportunity structure), and links the meso-level economic environment
with the macro-level institutional ecosystem (consisting of institutional forces, regulations,
and immigration policies), pointing to the importance of including immigration policies in
the study of ethnic entrepreneurship.
In Canada, as in many other immigrant-receiving countries, development of ethnic
businesses is closely related to immigration, and most ethnic businesses are initiated and
run by immigrants. In the past, most immigrants came to Canada as labourers. Some
became toiling shopkeepers and restaurateurs due to their inability to find paid
employment in the host society (as explained by the Blocked Mobility thesis). In the recent
decades, many immigrants moved to Canada with the intention and a well-conceived plan
to run a business in their chosen destination. As the Canadian economy shifts deeper into
the post-industrial expansive phase, Canada needs more immigrant entrepreneurs who
can participate and contribute to businesses of highly capital-intensive, mass production,
as reflected in its recent business immigration policies. Therefore, the post-industrial
employment trajectories influence immigration policies, and immigration policy changes
affect both the number of immigrant entrepreneurs and the composition of the immigrant
entrepreneur population (Kloosterman, 2006).
1RCIS Working Paper No. 2019/1
This paper examines how changes in immigration policies over the last four
decades in Canada have influenced the supply of ethnic entrepreneurs and business
capital. The main body of this paper consists of four parts. The first part is a synopsis of
immigration policy theories, from which a theoretical framework is highlighted to inform the
current study. In the second part, major policy initiatives and changes, along with the
associated controversies and criticism, are reviewed. In the third part, we examine the
impacts of the program changes (or policy outcomes) on business immigrant flows. The
fourth part discusses the implications for future development of ethnic businesses in
Canada. The paper concludes that explanation for ethnic business development needs to
go beyond the existing theories and be expanded to include immigration policy as an
important facilitating (or intervening) factor for opportunity structures.
A Synopsis of Immigration Policy Theories
Immigration studies fall into two broad areas of research: (1) immigration policies
and politics, and (2) immigration policy outcomes and impacts. Immigration policies are
designed to control, as well as facilitate, population movement across national borders. In
general, immigration policies are concerned with three main matters: the number, type,
and country of origin. The formulation of immigration policies, which take the form of laws
and ministerial regulations, is guided by various policy theories, either consciously or
unconsciously. Theoretical approaches dealing with immigration policies attempt to
explain what shape a country’s immigration policies.
Immigration policy is multidimensional. For example, in its official statement,
Canada’s immigration programs have four objectives (Seward, 1987): demographic,
economic, social, and humanitarian, though in practice, economic consequences have
always been the driving force of debate on Canadian immigration policies (Wang and Lo,
2000). This means that immigration policies are differentiated not only by the type of
immigrants to be admitted but also by the types of instrument, or different types of visa
and program (Milner and Tingley, 2011). Accordingly, there is a wide range of theoretical
approaches that can be used to examine immigration policies (Zogata-Kusz, 2012).
At a high level, Milner and Tingley (2011) distinguish two sets of theories: economic
models, which are based on both labour market theories and fiscal theories, and ideology,
which explains non-economic sources of political support for, or opposition to, immigration.
Labour market theories explain immigration policies from the viewpoint of need to increase
labour who contribute to the national and local economy; whereas fiscal theories explain
the aspects of immigration policies for need to minimize redistribution of tax and welfare
allocated to subsidize new immigrants. An extensive literature has examined the effect of
immigration policies on economic outcomes. As for the influence of ideologies, Milner and
Tingley (2011) distinguish between conservative ideology and liberal ideology. Existing
evidence suggests that conservatives are less likely to support immigration than the
liberals, as they are concerned with the high (perceived or real) cost of settling newcomers.
In contrast, liberals may favor less restrictive immigration policies, such as higher
immigration quota and less border control, and are more in favor of making employers
bear the burden of immigration control. Relating to ideology, the conservatives often take
a utilitarian approach in immigration policy making, with a focus on economic
consequences, while the liberals tend to take a “cosmopolitan calculus” approach,
weighing the welfare of each individual – both citizen and prospective immigrant – equally
(Macklin, 2010).
Alternatively, Zogata-Kusz (2012) generalizes seven theoretical perspectives (i.e.,
2S. Wang & R. Hii
considerations or influences) in immigration policy making.1 In a simplistic division, the
author separates them into two broad approaches: actor-based approach and factor-
based approach.
Actor-based approach focuses on immigration policy making and explains
immigration politics with the activities of state institutions and bureaucracy, domestic
politics (involving various interest groups including ethnic groups, NGOs, labor unions,
and employers), theories of globalization, and international institutions (such as the Office
of the UN High Commissioner for Refugees). As for the importance of domestic politics,
Freeman (1995) argued that immigration policy-making in democracies follows the pattern
of ‘client politics’, because the costs of immigration are diffused among the entire
electorate, while benefits are concentrated within a small pool of employers. Furthermore,
the classical political economy approach, one of the actor-based approaches, analyzes
different actors’ interests (cost and benefit) to determine which problems are set on the
agenda with priority and how compromises are made and decisions taken (Natter, 2018).
Factor-based approach concentrates on such factors as economic interest,
national identity, national security, globalization, foreign policy reflections, and human
rights. In the 21st century, the consideration of national identity has become much less
important than before in immigration policy making, but the influence of globalization and
foreign policy reflections have become more prominent. Nowadays, the shaping of
immigration policies depends much less on cultural and linguistic similarities between the
sending and receiving countries. Instead, the need to attract global talents and capital,
and obligations to resettle refugees, have had more influence on immigration policy
making. The theorists of globalization also claim that the power of states to create
immigration policy autonomously is now limited by the pressure of international
organizations and institutions (Zogata-Kusz, 2012).
In yet another classification, Natter (2018) distinguishes between “issues-specific”
theories and “regime-specific” theories. The former capture immigration policy processes
regardless of the political system in which policy makers (i.e., actors) function, while the
latter are tied to the characteristics of the political system where decisions are made. This
distinction is particularly useful for the study of immigration legislation and programs in two
ways: (1) for comparisons between democratic states and authoritarian regimes; and (2)
for contrasting between conservative and liberal ideologies, often held by different
governing parties in the same country.
In sum, immigration policies are multifaceted, and immigration policy making is
shaped by interactions of multiple actors and in consideration of many factors. As most
theorists agree, none of the theories reviewed in this synopsis can provide a freestanding
account of immigration policy, and most studies combine different theoretical aspects to
explain observed policy formulation and changes. The current study presented in this
paper is informed by both economic theories and ideology of the governing party.
1
These seven perspectives are: (1) state institutions and bureaucracy; (2) domestic politics; (3)
theories of globalization and international institution; (4) economic interests and the state of the
economy; (5) national identity; (6) human rights; (5) foreign policy reflections.
3RCIS Working Paper No. 2019/1
The Evolution of Canadian Business Immigration Programs since 1978
The contemporary business immigrant programs in Canada began in 1978. Since
then, a series of program expansion and revisions have been introduced and implemented
to address the problems of the programs, and in response to the changing economic
conditions of the country. These include the Entrepreneur and Self-Employed Immigrant
Programs (1978), the Investor Immigrant Program (1986), the Provincial Nominee
Program (1998), the Start-Up Entrepreneurs Program (2013), and the Immigration
Investor Venture Capital Pilot Program (2015).
The 1978 Entrepreneur and Self-Employed Immigrant Programs, and the 1986
Investor Immigrant Program
In 1978, the federal government, for the first time, introduced two new immigration
categories under the Independent Immigrant class: entrepreneur, and self-employed,
immigrants (CIC, 2014a; Knowles, 2016; Li, 2003).
The objective of the Entrepreneur program was to select immigrants with business
experiences who would own a business and manage it in Canada, and create jobs for
other Canadians (CIC, 2014a; CIC, 2014c). Entrepreneur immigrants were expected to
meet certain terms and conditions within three years of landing to satisfy their permanent
residency status. First, they had to control at least one-third of a business in Canada and
assume an active management role in the business. Second, they needed to create a
minimum of one full-time job for Canadian residents (CIC, 2015). The objective of the Self
Employed Immigrant program was to select immigrants who would create their own
employment either in farm management or in a field that would enable them to contribute
to the cultural or athletic life in Canada (CIC, 2014d; IRCC, 2017b).
Initially, the entrepreneur and self-employed classes of immigrants were not
accorded high priority in application processing due to the economic recession in the late
1970s and the early 1980s. The federal government instead focused on processing
applications in the Family and Refugee classes and the independent immigrants with pre-
arranged employment (Green and Green 2004; Wong, 1993). It was not until 1984, after
the decade-long recession, when business class applicants were given higher processing
priority ahead of family and refugee classes (Knowles, 2016).
In 1986, the federal government created another new category of business
immigrants, known as the Investor Immigrant class. The creation of the investor category
was to attract financial capital to stimulate job creation and economic growth in Canada
(Wong, 1993). Investor immigrants were expected to possess high personal net worth
and business experience and provide a minimum five-year, interest-free investment to the
federal government, which would distribute the funds to economic development projects
across the country (CIC, 2014a; CIC, 2014e).
Initially, the Investor class immigrants were required to possess a net worth of
$500,000 and invest a minimum of $250,000 in Canada (DeRosa, 1995). Over time, the
threshold was raised twice. From 1999 to 2010, investor immigrants were required to
possess a net worth of $800,000 and make a minimum investment of $400,000. Between
2010 and 2014, the threshold was doubled with applicants being required to possess a
net worth of $1.6 million and deliver a minimum investment of $800,000 (CIC, 2010; GOC,
2014). Until 2014, the investment was basically a loan to the Canadian government for
five years; after that, the principal was returned to the investor without interest.
The Investor Immigrant program became the fastest-growing business category in
Canada, ahead of the entrepreneur and self-employed categories (Knowles, 2016). Its
focus on international investors appeared to attract wealthy immigrants as a ready source
4S. Wang & R. Hii
of capital and potential trade links to world markets (Green and Green, 2004; Li, 2003).
Both the Entrepreneur and Investor programs were particularly popular among immigrants
from Hong Kong. Some commentators suggested that the introduction of the Investor
immigrant program was a purposeful move by the federal government to respond to the
exodus of investors and entrepreneurs from Hong Kong at that time, who were concerned
about the uncertainties surrounding the handover of Hong Kong to China in 1997 and were
considering Canada as a safe haven for capital investment (Li, 1993 and 2005; Wang,
1999)
The business immigrations programs have been surrounded with controversies.
Charles Campbell, former vice-chairman of the Immigration Appeal Board, noted in his
book, Betrayal and Deceit, that major failures of the Entrepreneur Program began to occur
in the early years of its introduction (Murray, 2005). When entrepreneurs were not able to
employ five people, the requirement lowered to two jobs; and when that didn't work, the
requirement was reduced to one job. In the new millennium, the Entrepreneur Immigrant
Program was considered inadequate in meeting the needs of Canada’s post-industrial
economic growth, as it was no longer bringing in the “in-demand” entrepreneurs. The
entrepreneurs, brought in under the existing program, did not create many jobs, and most
jobs created by them were low skilled and low paid. In other words, they did not contribute
to Canada’s innovation and competitiveness in the global economy (Reitz, 2004). The
current economic conditions in Canada require a new generation of entrepreneurs who
are familiar with the growing foreign markets and the associated regulations and customs.
It is no longer sufficient for an entrepreneur immigrant to be only able to open a shop or
restaurant.
Despite the popularity of the Investor Immigrant category, the program was riddled
with controversy almost from its beginning. Instances of fund mismanagement, insufficient
program monitoring by the federal and provincial governments, and misrepresentation of
program marketing were reported in Alberta and Manitoba in the early 1990s. These
practices ultimately resulted in cases of investors losing their investments, embezzlement
by fund managers, and economic benefits not going to the intended province. A temporary
program moratorium was put into place in 1994 and revisions were made shortly after, to
prevent further program abuse. These revisions included restricting passive investments
in real estate and stricter monetary fines for unscrupulous fund managers (DeRosa, 1995:
386).
Controversies surrounding both the Investor and Entrepreneur programs were not
limited to instances of mismanagement. While business class immigrants were assessed
using the same Points System as were other economic class immigrants, they were
subjected to substantially lower point thresholds, with selection focusing primarily on their
personal net worth and business experience. As a result, it was possible for Investor and
Entrepreneur immigrants to be selected for entry to Canada with lower official language
fluency or education qualifications than other economic class immigrants (Harrison, 1996;
Ley, 2003). It was for this reason that critics panned the program for essentially enabling
the wealthy to fast-track their way into Canada, making them a privileged class of
immigrants over the other applicants.
Questions also circulated regarding the actual benefits of the Entrepreneur and
Investor Immigrant programs for the Canadian economy – the policy outcomes.
Evaluations of the federal Entrepreneur and Investor programs by Citizenship and
Immigration Canada (CIC) found that while these business immigrants were relatively low
users of social assistance and employment insurance (EI) benefit, they paid substantially
less personal income tax than other economic immigrants (particularly skilled workers).
Investor and Entrepreneur immigrants were also more likely to settle in the popular
destination provinces of Ontario and British Columbia; other provinces were not benefiting
from the business activities of these newcomers in their fair share (CIC, 2014a). The CIC
5RCIS Working Paper No. 2019/1
evaluations also discovered insufficient monitoring of the Entrepreneur program to ensure
that the entrepreneur immigrants were indeed meeting the terms and conditions of the
program. In the 2014 Economic Action Plan and the 2014 CIC Annual Report, the Investor
Immigrant program was even described as undervaluing Canadian permanent residence,
and having the propensity to attract “astronauts”, who would move their families to Canada
but continue to conduct their business abroad, eluding Canadian tax authorities (GOC,
2014; CIC, 2014b; 2014c; Carmen and O’Neil, 2014). More importantly, it was found that
the Investor and Entrepreneur programs were not aligned to the federal government’s new
priorities to promote greater innovation in the Canadian economy, because most of the
immigrant businesses concentrate in small-scale and low-tech commercial activities
(IRCC, 2016). The federal government, led by the Progressive Conservative Party (PCP),
first suspended the Investor program in 2012, and subsequently, with the passing of Bill
C-31, terminated both of the Investor and Entrepreneur Immigrant programs in 2014.
Provincial Business Immigrant Programs and Streams
In Canada, immigration is largely the responsibility of the federal government.
However, certain powers of immigration have been decentralized to provincial
governments. The Province of Quebec, with a high level of autonomy as prescribed in the
Canadian Constitution, has been managing its own immigration affairs for a long time.
Specifically, Quebec has been running its own parallel investor program since 1986. Under
the Quebec model, investments are secured by the provincial government and managed
by Investissement Quebec, a Quebec government agency. Only after a government-
approved third-party financial institution has vetted all documentations for program
compliance, does the agency then allocate the applicant’s investment to qualified Quebec
businesses. The Quebec program, which was not affected by the cancellation of the
federal programs, is said to be fraud free. However, the two former immigration ministers,
Chris Alexander and Jason Kenney, both complained that a majority of the Quebec
applicants who paid their fees and invested their money in Quebec ended up living in
Ontario and British Columbia, and using the social services funded by taxpayers of these
two provinces (Carmen and O’Neil, 2014).
In 1998, the Provincial Nominee Programs (PNPs) were established to allow other
provinces and territories to select certain immigrants according to their local labor market
needs. As part of the PNPs, most provinces and Territories included categories of
business immigrants (see Table 1). However, unlike Quebec, the other provinces and
Territories can only nominate applicants, but the power of approval remains in the hands
of the federal government. This is a major difference between the Quebec program and
the PNPs. The provincial programs have not been fraud free either. Various problem s
were reported for the provinces of Manitoba, Nova Scotia, P.E.I. (Pagtakhan, 2012) and
Yukon (Immigration.ca, 2017). Three Atlantic provinces had to close their business
immigration programs at various points in time (Pagtakhan, 2012). In 2018, P.E.I. closed
permanently both the 100% Ownership and Partial Ownership business immigration
stream of its Provincial Nominee Program (Yarr, 2018).
6S. Wang & R. Hii
Table 1 Provincial Business Immigration Programs/Streams in Canada
Program
Quebec Immigrant Investor Program - Individuals who can demonstrate
an advanced intermediate level of French are exempt from the quota.
Quebec Quebec Entrepreneur - Capped out (individuals who can demonstrate
an advanced intermediate level of French may continue to apply)
Quebec Self-Employed Worker Program - Capped out
Alberta Alberta Self-Employed Farmer Stream
British Columbia Provincial Nominee Program (BC PNP) - Entrepreneur
B.C.
Stream
Manitoba Manitoba Provincial Nominee Program for Business (MPNP-B)
New Brunswick Provincial Nominee Program (NBPNP) - Business
New Brunswick
Applicants (suspended)
Nova Scotia Nominee Program (NSNP) - Entrepreneur Stream
Nova Scotia
Nova Scotia Nominee Program (NSNP) - International Graduate
Entrepreneur Stream
Northwest Territories Nominee Program (NTNP) - Entrepreneur
Northwest Territory
Business
Ontario Immigrant Nominee Program (OINP) - Corporate Stream
Ontario
Ontario Immigrant Nominee Program (OINP) - Entrepreneur Stream
Prince Edward Island Provincial Nominee Program (PEI-PNP) - 100%
Ownership (cancelled in 2018)
PEI
Prince Edward Island Provincial Nominee Program (PEI-PNP) - Partial
Ownership (cancelled in 2018)
Saskatchewan Immigrant Nominee Program (SINP) - Entrepreneur
Category
Saskatchewan
Saskatchewan Immigrant Nominee Program (SINP) - Farm
Owner/Operator Category
Yukon Yukon Business Nominee Program (YBNP)
Source: CanadaVisa http://www.canadavisa.com/canadian-business-immigration-table.html; Yarr, 2018
7RCIS Working Paper No. 2019/1
Start-Up Visa Program and Investor Venture Capital Program
Under the PCP government, amendments were made to the Immigration and
Refugee Protection Act (IRPA) in 2008 that bestowed the Minister of Citizenship and
Immigration the authority to issue special Ministerial Instructions relating to a variety of
economic immigration issues (CIC, 2011; IRCC, 2017a). In relation to the business class
programs, Ministerial Instructions were issued consecutively in 2010, 2011 and 2012, first
to temporarily pause accepting new Investor Immigrant applications, and then place a
moratorium on the acceptance of Entrepreneur class applications.
The Ministerial Instructions played an important role in the changes in immigration
policy post-2008. Section 14.1 of IRPA allows the Minister to issue special instructions to
create temporary (less than five years duration) economic immigration programs (IRCC,
2017a), effectively resulting in the creation of the Immigrant Start-Up Visa and Immigrant
Investor Venture Capital Class programs.
The Immigrant Start-Up Visa program was introduced in April 2013 in response to
one of the Government of Canada’s priorities to actively boost the Canadian economy
through greater innovation. It is designed to attract a new type of foreign entrepreneurs
from around the world, who can contribute innovative ideas and actively pursue innovative
business ventures that are productive, create better jobs, and can compete globally (CIC,
2014c). Three business organizations are invited for partnership: (1) Venture Capital and
Private Equity Association; (2) National Angel Capital Organization; and (3) Canadian
Association of Business Incubators. Start-Up Visa applicants first must seek a designated
Canadian venture capital fund or angel investor group, as well as a business incubator,
who will review and vest their business plans, and agree to provide mentorship for their
business plan execution. Second, each applicant must also secure a minimum investment
of $200,000 if sponsored by a venture capital or private equity fund, or $75,000 if
sponsored by an angel capital fund.
Unlike the previous federal Entrepreneur program, the Start-Up Visa program
requires that applicants possess a higher level of Canadian language proficiency (i.e.,
Canadian Benchmark Level 5) and must prove that they have sufficient funds to live
independently in Canada. The program initially also included a minimum educational
requirement with at least one year of the equivalent of Canadian post-secondary
education, but that requirement was later removed through another Ministerial Instruction
(CIC, 2014a), so that the next Bill Gates or Steve Jobs, who were both university dropouts,
would not be left out.
Following the discontinuation of the Immigrant Investor program, the same PCP
federal government introduced the Immigrant Investor Venture Capital (IIVC) program in
January 2015. This was a one-year pilot program, aiming to select up to 60 immigrant
investors who had a personal net worth of $10 million and were prepared to invest a
minimum of $2 million (up from $800,000) into the Immigrant Investor Venture Capital
fund, managed by BDC Capital (the investment arm of the Federal Business Development
Bank of Canada) and intended to assist in financing promising Canadian entrepreneurs
and start-ups (including immigrant start-ups). In essence, the foreign capital brought in by
the immigrant investors will be used to nurture innovation-based Canadian companies
(headquartered outside the Province of Quebec) to create high-quality jobs and compete
in the world economy, while reducing risks and liabilities for the Canadian tax payers.
Whereas the previous Investor Immigrant program required the participating immigrants
to maintain their investments for a period of 5 years, the Venture Capital immigrants must
keep their investments in the IIVC fund for 15 years (CIC, 2015; IRCC, 2016; IRCC,
2017b). Also, there is no guarantee for the principal, meaning that the investment will be
fully at-risk. Proceeds from the IIVC fund, including interest and capital gains, if any, may
be distributed to the immigrant investors periodically, depending on the performance of
8S. Wang & R. Hii
the fund. Any remaining fund assets could also be distributed among immigrant investors
at the end of the investment term.
Furthermore, the net worth of $10 million must have been acquired through lawful
profit-making businesses or investment activities. Personal net worth acquired through
inheritance or in the value of primary residence does not count, as these are not
considered “business or investment activities” for the purpose of this program. Applicants
of the IIVC program must also meet minimum official language requirements (Canadian
Benchmark Level 5) as well as minimum educational qualifications equivalent to one year
of Canadian post-secondary education. Those who do not meet the educational
requirements must possess an even higher net worth of $50 million. The purpose of
including official language and educational requirements is to select immigrants who can
more easily adapt and integrate into the Canadian economy and society (CIC, 2015; IRCC,
2017b), because as passive investors, these immigrants are not likely to be working in the
business of their own investment.
Clearly, both the Immigrant Start-Up Visa and Immigrant Investor Venture Capital
programs aim to attract business immigrants who can better fulfil Canada’s current
economic needs and priorities, with a particular focus on innovation. They also aim to
attract business immigrants with higher levels of human capital, in particular those with
higher English or French language proficiency and those with higher educational
attainment. The Start-Up Visa program also requires the active involvement of
entrepreneurs, and the support of a designated business entity (a venture capital fund or
an angel capital organization, as well as a business incubator) to potentially ensure
success of the business venture.
The two new business programs have resulted in changes in human capital
characteristics of the business immigrants. According to a recent federal evaluation, it was
found that the Start-Up Visa immigrants, when compared to federal Entrepreneur
immigrants, have higher rates of post-secondary education completion, greater knowledge
of English or French, and higher proportions who are willing to settle in the Atlantic
provinces, which have historically faced challenges in attracting new immigrants (IRCC,
2016).
The two new programs have not escaped criticism, however. One of the critiques
of the Start-Up Visa program is the relatively low volume of immigrants that applied and
were accepted to the program when compared to the former federal Entrepreneur
Program (IRCC, 2016). Furthermore, as of 2016, one year after the launch of the Investor
Venture Capital program, only 7 applications were received and no permanent resident
visas were issued (Mas, 2016), meaning that the pilot program did not achieved its
prescribed goal.
Policy Outcomes
Business immigrants account for a small proportion of all immigrants to Canada:
only 6.2 percent of the total in the last 36 years (1980-2016). However, they are accepted,
and even recruited proactively, for different purposes, as described in the preceding
section.
According to the Canadian immigration landing data, Canada admitted close to
half a million business immigrants (484,440) in the 36 years 1980-2016 (see Table 2). Of
these business immigrants, 42 percent were entrepreneurs, 16 percent were self-
employed, and 42 percent were investors. If they had all fulfilled their immigration
requirements as prescribed in the business immigrant programs, they would have
established 280,000 (small) businesses and created at least the same number of jobs (by
the entrepreneurs and the self-employed), and brought in 93 billion dollars of investment
9RCIS Working Paper No. 2019/1
(by the investors) to Canada. 2
Table 2 Summary of Business Immigrants* to Canada by Period of Time
Period Entrepreneur Self-employed Investor Total business
immigrants
1980-1999 167,725 61,124 71,655 300,504
(55.8%) (20.3%) (23.8%) (100%)
2000-2016 37,221 16,096 130,619 183,936
(20.2%) (8.8%) (71.0%) (100%)
1980-2016 204,946 77,220 202,274 484,440
(42.3%) (15.9%) (41.8%) (100%)
Source: Immigration, Refugee and Citizenship Canada (IRCC), 2014 and 2017c
*Principal applicants only
Business immigrant flows and composition exhibit notable temporal patterns,
coinciding with the major program changes. In the early years of the business immigration
programs (before 1984), Canada admitted more self-employed immigrants than
entrepreneurs (see Figure 1). After 1984, the number of self-employed immigrants
declined, and the number of entrepreneurs increased significantly and peaked in 1992,
with 16,000 accepted in that year. After the peak year, however, the number of
entrepreneurs declined precipitously – to merely 150 in 2016. In accordance with the
introduction of the Investor Immigrant program, investors began to arrive in Canada in
1986, and their number increased continuously for six years, and also peaked in 1992.
After a 10-year period of decline, the investor immigrant category resumed to increase
from 2003 to 2010, but declined again when the effectiveness of the Investor Immigrant
Program was called into serious question by the PCP federal government. Nonetheless,
the investor immigrants remained to be the largest class of business immigrants,
exceeding both entrepreneurs and self-employed, with those who landed in Canada after
2014 all having applied before the program was terminated. The changes in the
composition of the business immigrants are more clearly summarized in Table 2. Between
1980 and 1999, 56 percent of all the business immigrants were entrepreneurs; only 24
percent were investors. In the new millennium (2000-2016), the proportion of
entrepreneurs went down to 20 percent; while the proportion of investors jumped to 71
percent.
2
The estimation is made assuming that each investor who landed between 1980 and 1998 brought
in $250,000; those landed between 1999 and 2009 each brought in $400,000; and those landed
between 2010 and 2016 each brought $800,000.
10S. Wang & R. Hii
Figure 1 Inflow of Business Immigrants to Canada, 1980-2016 (with year of business immigrant
program introduction)
Source: Immigration, Refugee and Citizenship Canada (IRCC), 2014 and 2017c
Table 3 lists the top 20 countries/regions of origin (by place of birth) for the 20 year
period 1980-1999, from which as high as 85 percent of Canada’s business immigrants
originated. Seven of them were in East/Southeast/South Asia; another seven (including
Egypt) in the Middle East; and five in Europe. The largest was the tiny territory of Hong
Kong, sending 76,000 business immigrants to Canada, accounting for one quarter of all
the business immigrants to Canada in that period. This was the result of the large exodus
of investors and entrepreneurs from Hong Kong amid concerns about the uncertainty
surrounding the handover of Hong Kong to China in 1997 (as mentioned on page 5). The
other places of origin that sent more than 10,000 were Taiwan, mainland China, and
Korea. Coincidently, that was also a time period when small-scale ethnic businesses
mushroomed in the major Canadian cities. For example, most Chinese shopping centers
in metropolitan Toronto and Vancouver were built in the mid and late 1990s, and the retail
units were quickly filled with retail shops and restaurants, as many immigrants purchased
a store unit and created a job for themselves to meet the immigration criteria either as an
entrepreneur or a self-employed individual (Wang, 1999). That was also the start of the
suburbanization of ethnic businesses in the major Canadian cities.
In the following 17 years (2000-2016), the top 20 places of origin are similar (with
only four of them being different), still accounting for 88 percent of Canada’s business
immigrants; but their ranking has been altered significantly (Table 4). Mainland China
replaced Hong Kong to become the largest source country, which alone sent 80,000,
accounting for 43 percent of Canada’s total business immigrants in the new millennium.
Ninety-one percent of the business immigrants from China were investors, as the higher
investment threshold implemented in the 2010-2014 period highly favoured the Chinese
parvenus, but filtered out many applicants from
11RCIS Working Paper No. 2019/1
Table 3 Top 20 Places of Birth for Business Immigrants, 1980-1999
% of all business
Total business
Rank Places of birth World region Entrepreneur Self-Employed Investor immigrants to
immigrants
Canada
Hong Kong Asia 47,595 6,330 22,066 25.3
1 75,991
Taiwan Asia 16,576 3,994 24,191 14.9
2 44,761
China Asia 16,416 2,873 10,948 10.1
3 30,237
Korea Asia 18,603 1,396 3,491 7.8
4 23,490
Germany Europe 4,030 4,691 480 3.1
5 9,201
Iran Asia 5,252 1,988 748 2.7
6 7,988
Lebanon Asia 4,603 1,817 177 2.2
7 6,597
U.S.A. North America 2,161 3,372 478 2.0
8 6,011
India Asia 4,265 1,165 487 2.0
9 5,917
England Europe 2,197 3,508 193 2.0
10 5,898
Netherlands Europe 640 5,004 23 1.9
11 5,667
Pakistan Asia 3,938 573 456 1.7
12 4,967
Philippines Asia 2,336 786 1,442 1.5
13 4,564
Kuwait Asia 3,719 439 327 1.5
14 4,485
Switzerland Europe 863 3,544 68 1.5
15 4,475
Syria Asia 2,733 1,075 273 1.4
16 4,081
Egypt Africa 2,576 822 336 1.2
17 3,734
France Europe 1,383 1,804 40 1.1
18 3,227
Israel Asia 1,672 903 139 0.9
19 2,714
Saudi Arabia Asia 1,810 289 405 0.8
20 2,504
Total from all countries 167,734 61,200 71,655 300,589
Source: Immigration, Refugee and Citizenship Canada (IRCC), 2014 and 2017c
12S. Wang & R. Hii
Table 4 Top 20 Places of Birth for Business Immigrants, 2000-2016
% of all business
Self- Total business
Rank Place of birth World region Entrepreneur Investor Start-up immigrants to
employed immigrants
Canada
1 China Asia 5,230 1,432 72,946 36 79,644 43.3
2 Korea Asia 6,519 891 9,546 0 16,956 9.2
3 Iran Asia 4,444 875 9,097 14 14,430 7.8
4 Taiwan Asia 1,678 1,123 9,136 0 11,937 6.5
5 Pakistan Asia 2,825 294 3,316 0 6,435 3.5
6 India Asia 2,751 798 2,066 51 5,666 3.1
7 England Europe 802 1,107 738 16 2,663 1.4
8 Egypt Africa 606 141 1,897 8 2,652 1.4
9 U.S.A. North America 659 964 1,018 5 2,646 1.4
10 Netherlands Europe 250 1,878 174 0 2,302 1.3
11 Bangladesh Asia 479 52 1,582 0 2,113 1.1
12 Turkey Asia 134 105 1,774 3 2,016 1.1
13 UAE Asia 620 56 1,216 4 1,896 1.0
14 Lebanon Asia 675 327 846 0 1,848 1.0
15 HK Asia 408 66 1,238 3 1,715 0.9
16 Saudi Arabia Asia 348 23 1,327 0 1,698 0.9
17 France Europe 558 880 215 0 1,653 0.9
18 German Europe 527 672 261 0 1,460 0.8
19 Syria Asia 472 160 668 0 1,300 0.7
20 Iraq Asia 283 41 916 0 1,240 0.7
Total from all countries 37,012 16,096 130,617 209 183,934
Source: Immigration, Refugee and Citizenship Canada (IRCC), 2014 and 2017c
13RCIS Working Paper No. 2019/1
other countries. The other places that sent more than 10,000 business immigrants to
Canada were Korea, Iran and Taiwan, but their numbers were much smaller than in the
previous two decades. Hong Kong descended to the 15 th place, sending only 1,700
(compared with 76,000 in the previous two decades).
Since the introduction of the Start-Up Visa program in 2014, only 209 immigrants
of this category successfully passed screening and were issued a visa. Of these, 51 were
from India, 36 from China, 16 from the UK, and 14 from Iran. Due to its recency, the
effectiveness of this new program remains to be seen, but a precipitous drop has already
been noted. The landing records also show that by the end of 2016, no investors were
issued a landing paper through the Venture Capital Program (with only two visas issued
in the first half of 2017).
The business immigrants did seem to possess less human capital than the skilled
workers – the largest category of economic immigrants. As Table 5 shows, only 12 percent
of the business immigrants, admitted to Canada between 1980 and 1999 under the former
programs, had a university degree or a post graduate degree; and only 44 percent were
able to demonstrate official language ability at the time of immigration. These were much
lower than the skilled workers (at 31.2% and 76.5%, respectively).
Table 5 Business immigrants by education and Canadian official language ability, 1980-1999 (in
percentage)
All business Skilled
Entrepreneur Self-employed Investor
immigrants worker
Education qualification % % % % %
Less than university degree 88.5 88.4 88.8 88.5 68.8
University degree or higher 11.6 11.6 11.3 11.5 31.2
Bachelor 10.1 9.2 9.8 9.9 21.8
Master 1.2 1.8 1.2 1.3 7
Doctorate 0.3 0.6 0.3 0.3 2.4
Total 100.0 100.0 100.0 100.0 100.0
Official language ability
English 38.3 48.2 28.9 38.1 62.2
French 2.3 7.2 0.5 2.9 6.8
Bilingual 3.2 5.6 0.7 3.1 7.5
None 56.2 39.1 69.9 56.0 23.4
Total 100.0 100.0 100.0 100.0 100.0
Source: Immigration, Refugee and Citizenship Canada (IRCC), 2014 and 2017c
Those who were admitted between 2000 and 2016, on average, have higher levels
of education (19.4%) and official language ability (40.3%), as shown in Table 6; but these
are still significantly lower than the skilled workers (48.5% and 62.7% respectively). These
data indeed provided grounds for the federal government to introduce drastic changes to
the former business immigrant programs. Admitted under the new programs, the small
number of Start-Up Visa immigrants show a much higher level of human capital: 52
percent have a university degree or post graduate degree, and 90 percent meet the official
language requirement: both are higher than the skilled workers (48.5% and 82%). 3
3
It should be pointed out that the business immigrants admitted through the Quebec program are
not included in the IRCC maintained landing records, and those admitted through the PNPs are
aggregated into one large category of “provincial nominees”, making it impossible to count how
many of them were business immigrants.
14S. Wang & R. Hii
Table 6 Business immigrants by education and Canadian official language ability, 2000-2016 (in
percentage)
Self- All business Skilled
Entrepreneur employed Investor Start-ups immigrants worker
Education qualification
Less than university degree 82.0 78.6 80.4 47.9 80.5 48.2
University degree or higher 18.1 21.3 19.5 52.1 19.4 48.5
Bachelor 14.9 15.1 14.7 30.1 14.8 28.0
Master 2.7 5.1 4.0 19.1 3.8 17.6
Doctorate 0.5 1.1 0.8 2.9 0.8 2.9
Missing 0.0 0.2 0.1 0.0 0.1 3.2
Total 100.0 100.0 100.0 100.0 100.0 100.0
Official language ability
English 39.7 47.7 32.5 90.9 35.3 53.8
French 2.9 6.4 1.1 0.5 1.9 8.9
Bilingual 3.4 8.1 2.4 2.4 3.1 19.0
None 54.0 37.7 64.0 6.2 59.6 18.3
Total 100.0 100.0 100.0 100.0 100.0 100.0
Source: Immigration, Refugee and Citizenship Canada (IRCC), 2014 and 2017c
Immigration policy adjustments are not only prompted by the changes in the
receiving country’s economic conditions, but also influenced by the political ideology of
the federal governing party. In Canada, drastic changes were made when the PCP was in
power (2006-2015). In immigration policy making, the PCP seemed to have taken a
utilitarian approach, believing in immediate contributions to be made by immigrants shortly
after arrival. For the same reason, the PCP expanded the admission of skilled workers by
introducing the Express Entry class of immigrants, and tightened the admission of family
members (particularly parents). At the same time, it introduced the Super Visa – a 10-
year, multi-entry visa designed mainly for family reunification without immigration.
Implications for Future Development of Ethnic Business in Canada
Periodic policy adjustments are necessary, but eliminating the entrepreneur and
investor programs entirely may be too drastic. With a slow recovery from the 2008
recession among the Western economies, competition for business talent and global
capital has intensified. The much raised entry bar in the Start-Up Visa and the Venture
Capital programs may deter many potential business immigrants from applying to Canada,
and turn them to competing countries, such as the U.S., Australia and UK.
In the U.S., its EB-5 Visa Program, created in 1990, provides an avenue for eligible
immigrant investors to become permanent residents by investing US$1 million to finance
a business that will employ at least 10 American workers (U.S. Citizenship and
Immigration Services, 2007). If an immigrant investor commits to investing in a rural area
or in an area with high unemployment, the investment threshold is lowered to $500,000,
with no minimum net worth requirement. The investment will be returned in full within 4 to
6 years. This program has proven to be very popular, and it is much more “affordable”
15RCIS Working Paper No. 2019/1
than Canada’s new Venture Capital program. Most investors attracted by the EB-5 Visa
Program — about 80 percent — were from five places of origin: China, South Korea,
Taiwan, UK, and Hong Kong – all also the major origins of Canada’s business immigrants.
After Canada cancelled its investor program, the U.S. became the default leader in this
investment market (Dyck, 2015).
Australia accepts business immigrants in three streams: Business Innovation,
Business Investor, and Business Talent (Migration Expert Australia, 2017). The Business
Innovation Stream visa is designed for successful business owners who are required to
demonstrate a successful business career with significant turnover and a commitment to
owning a business in Australia. The Business Investor Stream visa allows successful
business people to invest in a new or existing business in Australia. Applicants are
required to demonstrate a successful record of investment or business activity in a
qualifying business or investment. In addition to demonstrating that they have sufficient
assets to settle in Australia, they must make a significant designated investment in
Australia prior to the visa being granted, which will be held for four years. This is similar to
the abandoned Canadian Investor Immigrant Program. Unlike the Canadian programs,
both the Business Innovation visa and the Business Investor visa issued by the Australian
government are provisional: they are issued initially for four years, and can be extended
or turned to permanent thereafter, based on whether the terms and conditions of
immigration are met. The Business Talent visa is a permanent visa granted to the highest
calibre of business people, who are able to demonstrate that they have a successful
business career and that their main business generated a minimum turnover of AUD$3
million for at least two of the preceding four years.
Similar to Australia, UK also accepts business immigrants in three streams:
entrepreneur, investor, and innovator (UK Immigration, 2017). Successful entrepreneur
immigrants are required to invest £200,000 in a new UK business, create full time
employment for at least 2 EEA nationals (who live and work in the UK), work solely in the
business they invested, and have sufficient funds to accommodate themselves until the
business becomes profitable. To qualify for an investor immigrant, one must have at least
£1 million to invest in the UK, of which at least £750,000 must be invested in unit trusts
(the UK term for mutual funds) or private companies; the remaining £250,000 may be
invested in other industry/business sectors, all for five years with interest paid to the
investors (Dyck, 2015). These immigrants must be “active investors” (as opposed to being
“passive investors” in the U.S. and Canada), meaning that they may not take employment
beyond managing their own invested business, and they must make the UK their main
home and spend at least 50 percent of their time in the UK (as opposed to being
“astronaut” immigrants). The business innovators, also known as “exceptional talent”, are
equivalent to Australia’s Business Talent and Canada’s Start-Up categories. This category
is reserved for those applicants who have an excellent business idea that will bring very
considerable economic benefits to the UK, and is tailored to those in the new industries of
information technology and telecommunication sectors. The successful innovators are
also expected to raise the needed capital by themselves without financial support from the
UK government.
There are three major differences between the existing business programs of the
U.S., Australia and UK and Canada’s new and abolished business immigrant programs.
First, the threshold requirements for investors by the three competing countries are all
lower than Canada’s Venture Capital Program; they are therefore more “affordable”.
Second, the investment terms in these three countries are shorter than that of Canada’s
Venture Capital Program. Third, the U.S., Australia, and UK all issue provisional visas
initially, and extend the visas only if the terms of immigration are fulfilled within the
specified time period, whereas Canada grants permanent residence status at the time of
approving the application.
By eliminating the decades-long entrepreneur and investor programs and
16S. Wang & R. Hii
replacing them with the new Start-Up Visa and Venture Capital programs, Canada is
poised to lose many resourceful business immigrants to the competing countries, thus
affecting the future growth of ethnic businesses. If the two pilot programs are to continue
and expand without restoring the previous entrepreneur and investor programs, they
would lead to significant changes to the number and structure of ethnic businesses in
Canada. The number of business immigrants to Canada will be reduced substantially, as
the landing data have shown (see Figure 1 and Table 2). Even if the two pilot programs
are to attract a good number of talented and ultra-wealthy immigrants, the new types of
businesses run and financed by these immigrants will not be limited to creating jobs for
immigrants and to serving co-ethnic consumers only. Instead, they will likely create high-
quality and high-paid jobs in high-tech and manufacturing industries. Ethnic retail and
commercial activities will still exist, but growth will stagnate. These commercial activities
will also be less facilitated by formal immigration programs, as was the case in the 1980s
and the 1990s. This has already been happening in Metropolitan Toronto, where only a
very small number of new Chinese shopping malls were developed and marketed after
2010. Some of them have never been filled up, with many vacancies; others have either
not been completed yet or been on hold indefinitely. For example, Splendid China Tower,
which was opened for business in 2007, still has a vacancy rate of 22 percent (as reported
in Zhuang and Chen, 2017); King Square Shopping Center, which took 8 years to be built,
has yet to open for business (as of February 2019).
The PCP government was replaced by the Liberals during the 2015 federal
election. The Liberal Party, which quickly renamed the ministry of Citizenship and
Immigration Canada (CIC) to Immigration, Refugees and Citizenship Canada (IRCC) to
signal program reform, is long known for taking a more humanitarian than utilitarian
approach in immigration policy making. When asked if the Liberal government would
reverse the pilot business immigrant programs, the (then) new immigration minister, John
McCullum, cautiously said that “We are reviewing options to determine the next steps, but
no decisions have been made. … We want to ensure our immigration system grows the
economy and also focuses on family unifications” (Mas, 2016). It is a long-held belief of
the Liberals that Canada should focus on growing immigrant families, because in a long
run, immigrant children growing up in Canada will be much better integrated in the
Canadian society in general than the adult immigrants, and therefore be more able to
contribute to Canada both economically and culturally.
Conclusions
Immigration policy, especially business immigration policy, is an important
influencing and facilitating factor for contemporary ethnic businesses development, but
has received inadequate attention in the existing literature. In importance, business
immigration policies not only regulate the inflows of international entrepreneurs and
investors (by quota), but also channel the associated resources and capital into different
economic sectors (by issuing different types of business immigrant visa). If not exec uted
properly, such policies may incur inadvertent economic consequences.
While most immigrant-receiving countries reply on immigrants to sustain
population growth and economic expansion, these countries also face the challenge of
creating enough jobs to utilize their talents and potential. For this reason, including a
healthy number of business immigrants in the total immigrant intake is a partial solution,
because most (if not all) of the business immigrants would create a job for themselves or
for other immigrants either directly (by establishing a business) or indirectly (with the
capital they bring with them).
17You can also read