Inogen, Inc. Overview - August 2021 - cloudfront.net

Page created by Glen Griffin
 
CONTINUE READING
Inogen, Inc. Overview - August 2021 - cloudfront.net
Inogen, Inc. Overview

August 2021
Inogen, Inc. Overview - August 2021 - cloudfront.net
Notice Regarding Forward-Looking Statements
These slides and the accompanying oral presentation (the “Presentation”) include forward-looking statements within the meaning of the Private Securities
Litigation Reform Act of 1995, which are based on current expectations, estimates and projections based on information currently available to management.
These forward-looking statements include, among others, statements relating to our business strategy; our expectations regarding changing reimbursement
rates on both our rental revenue and the oxygen therapy market generally; the size and estimates of growth in the oxygen therapy market; our estimates
concerning market penetration; our expectation regarding market headwinds and the impact on HME providers; our expectations regarding the impact of
the COVID-19 pandemic on our business and demand for our products; expectations with respect to the Company’s supply chain, including the availability of
semiconductor chips used in its batteries and POCs; our hiring expectations; product development; expectations related to the Company’s rental strategy
and growth prospects; and our expectations related to our acquisition of New Aera and the Tidal Assist® Ventilator technology. All statements other than
statements of historical facts contained in this Presentation, including statements regarding our future results of operations and financial position, business
strategy, prospective products, plans and objectives of management for future operations, and future results of current and anticipated products are
forward-looking statements. Forward-looking statements are typically identified by words like “believe,” “anticipate,” “could,” “should,” “estimate,” “expect,”
“intend,” “plan,” “project,” “will,” “forecast,” “budget,” “pro forma,” and similar terms. Forward-looking statements are subject to numerous risks and
uncertainties that could cause actual results to differ materially from currently anticipated results, including but not limited to, risks arising from the
possibility that we will not realize anticipated revenue; the impact of reduced reimbursement rates; the possible loss of key employees, customers, or
suppliers; and intellectual property risks if we are unable to secure and maintain patent or other intellectual property protection for the intellectual property
used in our products. In addition, our business is subject to numerous additional risks and uncertainties, including, among others, risks relating to market
acceptance of our products; our ability to successfully launch new products and applications; competition; our sales, marketing and distribution capabilities;
our planned sales, marketing, and research and development activities; interruptions or delays in the supply of components or materials for, or
manufacturing of, our products; seasonal variations; unanticipated increases in costs or expenses; and risks associated with international operations. The
known risks and uncertainties are described in detail under the caption “Risk Factors” and elsewhere in our Annual Report on Form 10-K for the year ended
December 31, 2020. Additional information will also be set forth in our Quarterly Report on Form 10-Q for the period ended June 30, 2021 and our
subsequent reports filed with the Securities and Exchange Commission, or SEC. Accordingly, our actual results may materially differ from our current
expectations, estimates and projections. Unless otherwise specified herein, forward-looking statements represent our management’s beliefs and
assumptions only as of our August 4, 2021 earnings release, and we undertake no obligation to update any forward-looking statements, whether as a result
of new information, future events or otherwise, except as required by applicable law. For more complete information about Inogen, Inc., please read our
Annual Report on Form 10-K, Quarterly Reports on Form 10-Q, and other documents that we have filed and may file from time to time with the SEC. These
documents can be obtained by visiting EDGAR on the SEC Web site at www.sec.gov.
                                                                                                                                                                    1
Inogen, Inc. Overview - August 2021 - cloudfront.net
Traditional O2 Therapy Challenged by Market Dynamics
     Standard US Model for Ambulatory Oxygen Patients                                  Inogen Strategy

                                                         Continue to focus R&D efforts for portable oxygen concentrators (POCs) on
                                                          patient preferred features: size, weight, noise, battery life, and connectivity
                 Low patient preference
                                                         Drive adherence through product ease of use
                                                         Greater consumer involvement in healthcare decisions

       High infrastructure and variable costs with       Vertically integrated manufacturer and HME service provider
                reimbursement rate cuts                  National coverage for scale and efficiency
                                                         Low infrastructure model with minimal deliveries required

                                                         Conduct clinical studies to drive physician advocacy for POCs for long-term
       Low clinical and economic evidence and low
                                                          oxygen therapy patients
            oxygen treatment differentiation
                                                         Evaluate new patient population opportunities for acute needs

                  Stationary Oxygen                                                               Inogen® offers a single solution
                     Concentrator                                          POC
                                                                                                       to meet most ambulatory
                          +                                                                        oxygen therapy patient needs
                   Regular Oxygen
                    Tank Delivery
                                                                                                                                            2
Inogen, Inc. Overview - August 2021 - cloudfront.net
Product Performance Drives Leadership Position

                                                                         Inogen One G5®              Inogen One G4®
                                      Launch Date                               April 2019                  May 2016

                      Effectiveness
                                      Minimum Advertised Retail Price            $2,495                       $2,295

                                      O2 Capacity                             1,260 ml/min                 630 ml/min

                                      Overnight                                                                

                                      Single Solution                                                          

                     Design
                                      Use Replaceable Batteries                                                

                                      Sieve Life Extending Technology                                          

                                      Weight (lbs.)                        4.7 (single battery)        2.8 (single battery)
                     Convenience

                                                                           5.7 (double battery)        3.3 (double battery)
                                      Battery Duration                  Up to 13 hours on a double   Up to 5 hours on a double
                                                                                  battery                     battery
                                      Sound Level (on flow setting 2)            38 dBA                       40 dBA

                                                                                                                                 3
Inogen, Inc. Overview - August 2021 - cloudfront.net
Innovation at Forefront of Customer Preference
   Technology leadership delivering patient preferred features with focus on product reliability
      •     Optimized for the oxygen therapy user requirements and preferences
      •     Superior oxygen production per pound, sound suppression and run-time
      •     Durability, reliability and functionality to deliver a single solution POC for oxygen at home, away, and travel

   Rapid innovation cycles to remain a technology leader and best meet a wide range of patient needs

Inogen One G1                   Inogen One G2                        Inogen One G3                      Inogen At Home   Inogen One G4     Inogen One G5     Inogen TAV
Launch 2004                     Launch 2010                          Launch 2012                        Launch 2014      Launch 2016       Launch 2019       Launch 2019

〉 9.8 pounds                    〉 7.1 pounds*                        〉 4.8 pounds*                      〉 18 pounds      〉 2.8 pounds*     〉 4.7 pounds*     〉 Discreet interface
                                                                                                                                                               design
〉 750 mL/min                    〉 1,260 mL/min**                     〉 1,050 mL/min**                   〉 5,000 mL/min   〉 630 mL / min    〉 1,260 mL/min
                                                                                                                                                             〉 Works with certain
                                                                                                                         〉 Bluetooth/App   〉 Bluetooth/App     stationary
                                                                                                                                                               concentrators & tanks

  *Weight quoted for single battery system configuration
  ** Oxygen production quoted at current system capacity for Inogen One G3 and last system capacity for Inogen One G2.                                                              4
Inogen, Inc. Overview - August 2021 - cloudfront.net
Building the Inogen Brand
                Targeted Advertising                   Consumer Preference

      Domestic Direct-to-Consumer Sales ($M)   Domestic Business-to-Business Sales ($M)

                                 $121.6
                                                                              $96.4
                      +22.7%
                      5-year                                     +22.9%
                      CAGR                                       5-year
       $43.8                                         $34.4       CAGR

         2015                     2020                2015                     2020

                                                                     Founded in patient preference

                                                                                              5
Inogen, Inc. Overview - August 2021 - cloudfront.net
U.S. Market Dynamics Favor POC Adoption by HME Providers
                             Estimated Penetration of POCs1                                                                      Average Gross Monthly Medicare Reimbursement Rates in Former CBAs
                                                                                                                  $250
          100%                                                                                                               $233
                                                                                                                  $200
                                                                                                                                    $158
           90%                                       22%                     22%                                                              $136        $134
                                                                                                                  $150                                               $115        $114        $113                                          $121
                             33%                                                                                                                                                                          $109       $110       $110
           80%
                                                                                                                  $100
                                                                              8%
           70%                                                                                                     $50

           60%                                                                                                       $0
                                                                                                                          2012      Round 1   Round 2     R1 re-     R2 re-      R1 re-    2018 DME      2019 DME   2020 DME   2021 DME   April '21
           50%                                       60%
                                                                                                                                                         compete    compete     compete       Adj.          Adj.       Adj.       Adj.    DME Adj.
                                                                                                                                                           2014       2016        2017

           40%
                             63%                                             70%                                                                                     Market Dynamics
           30%
                                                                                                              POCs favored by patients, and have a premium reimbursement rate to tanks
           20%                          CAGR:
                                         ~22%                                                                 HME restructuring challenges, capital constraints, and limited cash flow are expected to lead to
           10%                                       18%                                                       “lumpy” order activity
                              5%                                                                              Low clinical involvement in selection of oxygen modality at the prescriber level due to low
             0%
                                                            1                                                  differentiation of technologies
                             2012                   2019              Estimated Full
                                                                       Penetration 2                          Oxygen therapy was removed from competitive bidding round 2021, and the removal of Medicare
                                                                                                               budget neutrality requirements increased rates in former competitive bidding areas by ~10% and
                     POCs          Ambulatory Non-POCs                 Stationary                              all other Medicare areas by ~5% effective 4/1/2021
                                                                                                              CMS proposed changes to Home Use of Oxygen national coverage determination in July 2021 to
                                                                                                               expand coverage and patient access and reduce provider burden.

Note 1: Based on 2019 U.S. Medicare claims data and our estimates of the ratio of the Medicare market to the total market. Value excludes Medicare Advantage, Medicaid, cash pay and private insurance.

Note 2: Based on 2019 U.S. Medicare claims data, ambulatory patients account for 77.8% of total patients. Inogen estimates a full POC penetration rate of up to 90% of the existing ambulatory patient                                                6
population based on Inogen’s analysis of the patients who have contacted the Company and their clinical needs
Inogen, Inc. Overview - August 2021 - cloudfront.net
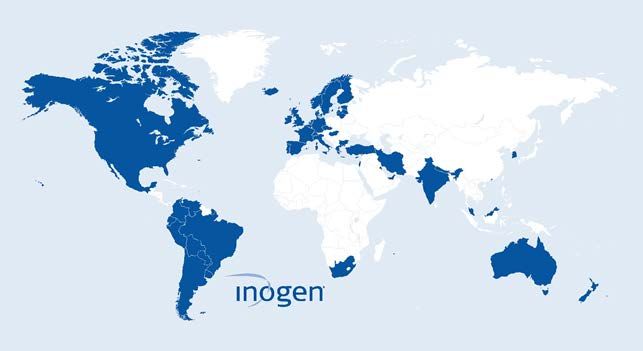
Rental Focus to Drive Improved Results
               Strategic Focus: Grow revenue with increased predictability and an attractive margin profile
  Increases patient access to Inogen POC technology
  Plan to increase direct-to-consumer lead utilization for rental opportunities. 300 inside sales
   representatives as of December 31, 2020.
  Plan to grow referral at the onset-of care through building a national physician facing sales force
   and expanding insurance contract coverage over next 3 to 5 years. 24 physician sales
   representatives as of December 31, 2020.
  Invest in infrastructure to support physician sales force, expand clinical evidence, and offer
   physicians solutions to best serve their patients

                      Rental Revenue ($M)                                                                Rental Patients on Service
                                            $28.3
                   $21.4                                                                                 25,300               32,200
                                +32.3%                                                                              +27.3%
                                Growth                                                                              Growth

                   2019                      2020                                                        2019                  2020
                   We believe expanding rentals will increase patient access and improve margins over time
                                                                                                                                       7
Inogen, Inc. Overview - August 2021 - cloudfront.net
Inogen Revenue Breakdown
            Sales in 59 Countries                                             Worldwide Revenue

                                                                                                   6 Months Ended June 30, 2021
                                                         2020 Revenue Breakdown                        Revenue Breakdown
                                                                       DTC rentals                                  DTC rentals
                                                                         9.2%                                         11.2%

                                                    Domestic B2B
                                                       31.3%                                     Domestic B2B
                                                                                                    30.9%

                                                                                     DTC sales
                                                                                      39.4%                                       DTC sales
                                                                                                                                   38.0%
                                                           Int’l B2B                                    Int’l B2B
                                                            20.1%                                        19.9%

2020 Revenue:                        $308.5M

Q1-Q2 2021 Revenue:                  $188.5M

    We believe there are significant opportunities to increase oxygen therapy treatment OUS with our products

                                                                                                                                              8
Inogen, Inc. Overview - August 2021 - cloudfront.net
Historical Revenue & Strong Balance Sheet
 Revenue ($M)

 400
                                                                                                                  $358.1    $361.9
 350                                                                                                                                        1
                                           11 Year CAGR of 42.2%                                                                     $308.5
 300
                                                                                                         $249.4
 250
                                                                                           $202.8
 200                                                                                                                                            $188.5
                                                                           $159.0
 150
                                                            $112.5
 100                                         $75.4
                                  $48.6
 50             $23.6   $30.6
       $10.7
  0
       2009     2010    2011      2012      2013            2014           2015            2016          2017     2018      2019     2020       Q1-Q2
                                                                                                                                            1

                                                                                                                                                2021
                           As of June 30, 2021
                           Cash, cash equivalents and marketable securities                                       $250.0M
                           Debt                                                                                   $0.0M
                                                                                                                                                         9
                                           1 2020 was significantly impacted by the COVID-19 pandemic.
Future Revenue Growth Opportunities
Improving lives through respiratory health
 1                             2                           3   Develop Clinical &
                                    Direct-to-Consumer          Economic Evidence
      Rental Expansion
                                        Optimization              to Drive Clinical
                                                                     Advocacy

                                5                          6
  4                                                                 Pursue
      International Market           Expand Product              Complementary
           Development                   Pipeline                     M&A
                                                                  Opportunities

      We plan to continue to strengthen & build preference & advocacy for Inogen’s
         respiratory therapies and brand across patients, prescribers, & payors

                                                                 *As of December 31, 2020   10
Company Highlights

   1                                                             2
          Market leader in large, global,                            DTC model enables direct customer
            underpenetrated market                                       access and brand preference

   3                                                             4
       Differentiated product portfolio with                          Experienced management team
              continued commitment to                                    recognized as leaders in the
                     innovation                                         respiratory homecare market

                                  5

                                            Attractive financial profile

                                                                                                         11
Supplemental Information
Estimated U.S. Medicare Penetration of POCs
We believe POCs remain under penetrated                                                                                                                            Estimated Full POC Penetration Rate¹

 Based on 2019 U.S. Medicare claims data,
      ambulatory patients account for 77.8% of total LTOT
      patients.                                                                                                                                                                                                                  POC Appropriate
                                                                                                                                                                                       Ambulatory
                                                                                                                                                 Stationary                                                                           90%
                                                                                                                                                                                         77.8%
                                                                                                                                                   22.2%                                                     Ambulatory
 Inogen estimates a full POC penetration rate to be
                                                                                                                                                                                                              non-POC
      90% of the existing ambulatory patient population
                                                                                                                                                                                                                10%
      or ~70% of the total¹

 Based on 2019 U.S. Medicare claims data, we                                                                                                                                 Estimated Penetration of POCs¹
      estimate the penetration rate for POCs was ~18%²                                                                                                                                                                                             70%
                                                                                                                                                                                                    (based on Medicare)
                                                                                                                                                      0.6
 Inogen estimates the U.S. oxygen therapy market
      to reach full POC penetration in 5+ years                                                                                                       0.4

                                                                                                                                                                                                                          14%         18%
                                                                                                                                                      0.2                                 9%                 11%
 Inogen’s POC expected useful life is 5 years                                                                                                                        8%
                                                                                                                                                         0
                                                                                                                                                                     2015                2016               2017          2018        2019      Est. Full
                                                                                                                                                                                                                                              Penetration

Note 1: Based on 2019 U.S. Medicare claims data, ambulatory patients account for 77.8% of total patients. Inogen estimates a full POC penetration rate of up to 90% of the existing ambulatory patient population based
on Inogen’s analysis of the patients who have contacted the Company and their clinical needs. Data on file.

                                                                                                                                                                                                                                                            13
Note 2: 2019 U.S. Medicare claims data does not include Medicaid, cash sales, private insurance, government or Medicare Advantage patients
Design Expertise & Intellectual Property

         Trade secrets & know-how
                                                                                     Increase functionality
             Automation
             Connectivity                                                           Improve design
             Compressor design & air separation                                     Ease-of-use
             Encoded software                                                       Reduce production costs
             Ventilation & air entrainment

          59 patents issued*
             System design and assembly                                          Product differentiation
             Control systems for oxygen concentrators                            Long-term protection of
                 and ventilators
                                                                                      existing portfolio
                Nasal interface designs
                Sieve bed designs and life prediction                            Design features for patient
                                                                                      preference
          28 pending patent applications*
             POC design improvements                                             Reduced service costs
             Ventilation interface design                                        Reduced part count and
             Design features for improved manufacturing                              ease of assembly

                                                           * Patents and pending patents as of June 30, 2021     14
Average Gross Non-Delivery Ambulatory Monthly Rates
    300
                                                                                                                    POC Ambulatory Oxygen in Former CBAs
    250         233
                                                                                                                    Stationary/Nocturnal Oxygen in Former CBAs

    200         52
                              158
    150                                   136            134
                               42                                          115              114             113                                                            121
                                                                                                                            109           110            110
                                          43             38
    100                                                                    38                36              36                                                             40
                181                                                                                                         36             36             36

     50                       116
                                          93             96                                                                                                                 81
                                                                           77                78              77             73             74             74

      0
          Medicare STD 2012   Round      Round          Round 1     Round 2 re-compete     Round 1       2018 DME Fee   2019 DME Fee   2020 DME Fee   2021 DME Fee   April '21 DME Fee
                              1 2011   2 Mid-2013   re-compete 2014     Mid-2016       re-compete 2017    Adjustment     Adjustment     Adjustment     Adjustment      Adjustment

   We believe lower reimbursement rates will drive conversion to non-delivery solutions, although there are challenges to HME provider adoption

   POC reimbursement rates are at a premium compared to stationary + tanks in 36-mo rental period

   Oxygen was removed from competitive bidding round 2021, and the removal of Medicare budget neutrality requirements increased rates in former
    competitive bidding areas by ~10% and all other Medicare areas by ~5% effective 4/1/2021

   CMS has published multiple proposed rules to establish reimbursement rates going forward and changes to the national coverage determination. It is
    unclear if there will be a future round of competitive bidding

                                                                                                                                                                                         15
COVID-19 Policy Changes
The CARES Act extended the 50/50 blended rate for HME
providers in rural and non-contiguous, non-competitive
bid areas & established a new 75/25 blended rate for all
other non-competitive bid areas through duration of
COVID-19 public health emergency

Interim final rule published on Federal Register on 4/6/20
    •   Allows clinicians additional flexibility in determining Medicare
        patient needs for respiratory devices to allow patients to
        manage their treatments at home, including oxygen
        concentrators and other respiratory products
    •   Allows waivers for signature and proof of delivery requirements
        and accreditation and appeal extensions during the public
        health emergency

                                                                           16
A Proven Team Built for Success
                                                      30+ years of leadership with Becton Dickinson, SC Johnson / Diversey, and in various pharmaceutical and consumer goods
              Nabil Shabshab                           companies. Extensive experience in running global businesses, accelerating growth through portfolio innovation, solution and
 President, Chief Executive Officer, BOD Member        market development, commercial strategies and execution, and organizational transformation

                Ali Bauerlein                         Co-founder of Inogen with 20+ years experience in treasury, finance, accounting, risk management, investor relations and billing
    CFO, Executive Vice President, Finance &           revenue management, as well as strategic and tactical cost analysis and forecasting
             Corporate Treasurer

                                                      29+ years of experience leading commercial organizations, driving innovation, managing strategic accounts, building strong
                George Parr                            product portfolios and brands, and delivering exceptional customer experience globally in healthcare, consumer and industrial
Executive Vice President, Chief Commercial Officer     industries with Becton Dickinson, SC Johnson / Diversey and private equity portfolio companies.

           Dr. Stanislav Glezer                       25+ years of medical affairs experience with Becton Dickinson, Adocia S.A., Novo Nordisk, Inc., and Sanofi S.A.
 Executive Vice President, Chief Medical Officer      Doctor of medicine from Moscow State University of Medicine and Dentistry and an MBA from California Coast University.

              Brenton Taylor                          Co-founder of Inogen with 20+ years of experience in medical device product development and manufacturing
      Executive Vice President, Engineering           Successfully obtained 26 issued U.S. patents for POC development

                Bart Sanford                          30+ years of manufacturing and operations leadership experience, with 18 years in Danaher Corporation (Cepheid, Molecular
      Executive Vice President, Operations             Devices, Fluke Corporation)

                Jim Runchey                           30+ years of corporate leadership experience with Zeiss, Invitrogen / Life Technologies, and Alaris Medical Systems in Human
   Executive Vice President, Human Resources           Resources and Commercial Operations

               Jason Somer                            Experienced General Counsel with 20 years’ experience working with public and private companies in securities, M&A,
  Executive Vice President, General Counsel &          corporate governance, compliance, commercial contracting, IP management and litigation management.
                                                      Managed legal departments in Canada, Europe and China.
              Corporate Secretary
                                                                                                                                                                                          17
18

Thank you
You can also read