Insights into local government: 2020 - Office of the Auditor-General NZ
←
→
Page content transcription
If your browser does not render page correctly, please read the page content below
B.29[21f]

Insights into local
government:
2020
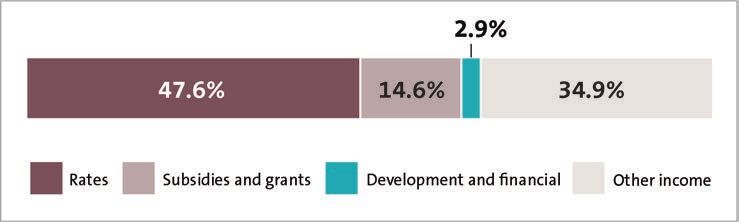
Photo acknowledgement:
mychillybin © Rebekah Emerson
B.29[21f]

Insights into local
government: 2020

Presented to the House of
Representatives under section 20 of
the Public Audit Act 2001.

June 2021
Contents

    Auditor-General’s overview                                                                                   3
    Part 1 – Councils’ performance in 2019/20                                                                    6
     Revenue recorded by councils                                                                                6
     Operating expenditure of councils                                                                           8
     Building consents                                                                                           9
     Levels of service were not significantly affected in 2019/20 as a result of Covid-19                       12

    Part 2 – Councils’ investment in infrastructure                                                             13
     Reinvestment in councils’ assets during 2019/20                                                            13
     Three waters performance measures and trends                                                               18
     Delivery of capital expenditure budgets                                                                    19
     Building assets needed for growth                                                                          20
     Council debt trends                                                                                        21

    Part 3 – The audit reports we issued                                                                        22
     When the audit reports were issued                                                                         22
     The types of audit report we issued                                                                        23
     The effect of Covid-19 on our audits                                                                       27

    Part 4 – Our work to support good governance and accountability in councils                                 28
     Sharing insights about what “good” looks like                                                              28
     Understanding how councils manage risk                                                                     30
     Supporting councils’ long-term plans for 2021-31                                                           30
     Local government procurement                                                                               31
     Local Authorities (Members’ Interests) Act 1968                                                            31

    Part 5 – Managing conflicts of interest in regional councils                                                33
     Conflict of interest rules that apply to regional councils                                                 33
     Application by Otago Regional Council for exemptions and declarations                                      36
     Request for guidance on managing a conflict of roles                                                       38
     General comments on the legislation governing conflicts of interest in local government                    42

    Appendices
     1 – Sub-sectors and the high-growth councils                                                               44
     2 – When councils adopted their annual reports and released their annual reports and
         summary annual reports                                                                                 46

    Figures
      1 – 2019/20 actual revenue, by sub-category                                                                7
      2 – 2019/20 budget and actual operating expenditure, by sub-category                                       8
      3 – Councils’ processing of building consent applications within 20 working days in 2019/20               10
      4 – Percentage of all building consent performance measures achieved and the total number of
          building consents issued for new dwellings, 2015/16 to 2019/20                                        11
      5 – Renewal capital expenditure compared with depreciation for all councils, 2012/13 to 2019/20           14
      6 – Renewal capital expenditure compared with depreciation for all council sub-sectors (excluding
          Christchurch City Council), 2012/13 to 2019/20                                                        15
      7 – Renewal capital expenditure compared with depreciation for all councils combined (excluding
          Christchurch City Council) by infrastructure asset category, 2015/16 to 2019/20                       16
      8 – 2019/20 spending on three waters assets as a proportion of spending on total infrastructure assets,
          by capital expenditure type                                                                           17
      9 – Percentage of water supply, wastewater, and stormwater performance measures achieved,
          2015/16 to 2019/20                                                                                    18
     10 – Number of councils spending either less than 80%, between 80% and 100%, or over 100% of
          their budgeted capital expenditure, 2012/13 to 2019/20                                                19
2
Auditor-General’s overview
E ngā mana, e ngā reo, e ngā karangarangatanga maha o te motu, tēnā koutou.
Last year was extraordinary. Covid-19 caused significant disruption for most public
organisations, including councils and the organisations they own. Despite this,
councils continued to deliver essential services to their communities, as well as
leading the local response when a state of national emergency was declared due
to Covid-19.
It can be easy to overlook the wide range of services councils provide to their
communities. However, there are many proposed changes on the horizon to the
traditional roles and functions of local government. New regulatory requirements
are being put in place or proposed (for example, new and updated national
policy statements). Other areas for change are also being proposed, including
the three waters and resource management reforms. The reform processes, and
the information and engagement requirements these involve, have added to the
stresses already evident in local government.
The proposed reforms have the potential to reshape New Zealand’s system of local
government. This has led to the recent announcement of a review into the future
for local government. It is a difficult time for the local government sector, which
needs to continue to deliver and develop core services at the same time as its
future role is considered.
Providing affordable and sustainable services to communities has always been a
challenge for councils, but it is becoming even harder. Previous Auditors-General
and I have noted concerns that councils have not been adequately reinvesting
in their assets. This trend continued in 2019/20. However, many councils have
identified this matter in their 2021-31 long-term plan consultation documents.
Within these documents, we saw some councils confront the infrastructure issues
they are facing and propose to raise rates to provide sustainable services over the
long term. My view is that well-planned, funded, and well-managed asset renewal
programmes are critical to sustainable service delivery. Without this, communities
can end up paying more for asset renewals and suffering unexpected disruptions
to services because of asset failure.
Councils also need skilled staff. I acknowledge the difficulty many councils
have in attracting and retaining qualified staff. The proposed changes for
local government are likely exacerbating this. In the current environment,
procurement strategies that acknowledge the tight contractor and consulting
market are also critical.
3Auditor-General’s overview
Effective governance of councils is important. I am pleased to see that there
has been a concerted effort across the sector to enhance the performance and
function of audit and risk committees, including:
• establishing a committee when there was not one in place already;
• appointing one or more independent members with the required skills to
consider and advise on risks, to support the council; and
• reviewing the committee’s terms of reference to ensure that they are fit for
purpose.
My Office will continue to support audit and risk committees by regularly sharing
our insights and observations and updating our good practice guidance.
Governing bodies also have a role in assessing the design and effectiveness of
councils’ internal systems and controls. We recently released our revised good
practice guides on conflicts of interest and sensitive expenditure. In a rapidly
changing environment, it is important that councils’ policies are reviewed
regularly to ensure that they remain appropriate and that they continue to be
followed. Effective governance also extends to oversight of organisations that
councils have ownership interests in. The review of Auckland Council’s
council-controlled organisations by an independent panel includes information
that should be useful for the wider sector.
This report explores in some detail the challenges faced by regional councils
in managing conflicts of interest. This includes discussions about some of the
conflict of interest issues and challenges we considered during the year, along
with two examples from regional councils that we have considered previously to
illustrate the points we discuss. Many regional councils have elected members
from agricultural backgrounds, and the management of conflicting interests can
be complicated as councils seek to make regulatory and planning decisions. This is
further complicated by the fact that the Local Authorities (Members’ Interests) Act
1968 is dated and is out of step with the approach other sectors take to managing
conflicts of interest – it is timely for this legislation to be reviewed.
The preparation of councils’ 2019/20 annual reports and our audits were severely
disrupted by Covid-19. Our auditors needed considerably more time to complete
the audits of the 2019/20 annual reports compared with a normal year. This has
resulted in auditors seeking to recover additional audit fees from councils at a
level that is unusual.
4Auditor-General’s overview
In response to Covid-19, Parliament extended the statutory reporting time frames
for councils (among other public entities) by two months. This was an important
step to ensure that the quality of reporting was not compromised at a time when
robust financial and performance reporting was even more critical than usual.
Having said this, my auditors issued more qualified audit opinions on councils’
annual reports than they have previously. Most qualifications were because
the auditor was not able to obtain sufficient evidence to support non-financial
performance reported by councils. The performance that a council reports should
tell a story about the services it delivers, why it delivers them, and what difference
it intends to make to its community. Councils need robust systems to collect and
report performance, not only for their financial performance but for their
non-financial performance as well. Ratepayers should know the levels of service
they are receiving for the rates and charges they pay.
The delay in preparing councils’ 2019/20 annual reports and the uncertainty and
complexity caused by Covid-19 have proved challenging for both council staff and
my auditors, especially as they moved immediately into the preparation and audit
of 2021-31 long-term plans and the associated consultation documents.
I expect that the 2020/21 financial year-end will also be a challenge as the
impact of Covid-19, together with challenges of resourcing, affect both councils
and my auditors.
Councils provide services that are important to all New Zealanders. In a
challenging environment, council staff have continued to work tirelessly for the
benefit of their communities.
Nāku noa, nā,
John Ryan
Controller and Auditor-General
22 June 2021
51 Councils’ performance in 2019/20
1.1 In this Part, we consider the main financial performance trends of councils for
2019/20.1 We comment on the revenue recorded by councils, the operating
expenditure incurred by councils, whether councils are processing building
consent applications within the statutory time frames, and whether aspects of
councils’ non-financial performance for 2019/20 were affected by Covid-19.
1.2 To carry out our analysis, we compared 2019/20 actual reported figures with what
councils planned and included in their budgets.2
1.3 Overall, the revenue received by councils in 2019/20 from core revenue sources
(such as rates, subsidies, and grants) was as expected and in line with what had
been budgeted for.
1.4 Councils did incur higher than forecast operating expenditure. From our analysis,
there were no consistent reasons for this. However, we have noted that liabilities
from leaky home claims is a long-standing issue that continues to have significant
expenditure implications for at least two councils.
1.5 Covid-19 directly affected council services that were required to close during Alert
Levels 3 and 4. However, based on the information included in councils’ annual
reports, other council operations were not as affected by Covid-19.
Revenue recorded by councils
1.6 Councils recorded total revenue of $13.9 billion for the 2019/20 year (2.8% higher
than the $13.6 billion budgeted). Excluding Auckland Council, councils recorded
total revenue of $8.8 billion, which was 4% higher than councils had forecast
($8.4 billion).
1.7 Figure 1 shows the categories of revenue for councils for the 2019/20 year.
1 For 2019/20, draft financial information for five local authorities was included in our analysis because the
audited financial information was not available at the time we undertook our analysis. Five councils missed the
revised deadline to complete and adopt their audited annual report by 31 December 2020. Paragraphs 3.4-3.9 of
this report provide more information.
2 We looked at individual council figures, except for Auckland Council where group level figures were used, because
the council-controlled organisations of Auckland Council provide core services such as public transport, roading,
6 and water services. Budget information is as reported in councils’ 2019/20 annual reports.Part 1
Councils’ performance in 2019/20
Figure 1
2019/20 actual revenue, by sub-category
Source: Analysed from information collected from councils’ annual reports.
1.8 The proportion of revenue recognised by councils was similar to the previous
financial year.
1.9 Of the total revenue in 2019/20, $6.6 billion was from rates. This was largely
consistent with the amount councils planned to collect and equates to 47.6% of the
councils’ total revenue. In 2018/19, rates were 46.7% of the councils’ total revenue.
1.10 The revenue received by councils was not significantly affected by the nationwide
lockdown in response to Covid-19, although we note that individual councils
would have been affected in different ways. For example, Hurunui District Council
had a decrease in revenue because the Hanmer Springs Thermal Pools and Spa
could not operate during Alert Levels 3 and 4.
1.11 We note that councils faced public pressure to keep rates increases down in the
2020/21 financial year to assist ratepayers facing financial hardship because of
the disruptions of Covid-19.3 As a result, many councils reconsidered planned
rates rises and consulted with their communities on options to keep rates
down. Councils also considered other options to provide targeted assistance
to ratepayers that needed it, including revised rates remission, postponement
policies, and lower rate penalties.
1.12 We found that revenue other than rates was largely as planned. Subsidies and
grants received by councils was $75 million (3.8%) higher than budgeted.
1.13 In previous years, most subsidy income has been received from Waka Kotahi New
Zealand Transport Agency. More recently, councils have had access to other grants,
such as the Provincial Growth Fund, some tourism funds, and the Government’s
“shovel-ready” funding.
3 Local Government Covid-19 Response Unit (August 2020), Local government sector COVID-19 financial
implications, Report 3 – Comparison of 2020 annual plan budgets against long-term plans, page 10. 7Part 1
Councils’ performance in 2019/20
1.14 Christchurch City Council had a significant increase (85%) compared with budget
in subsidies and grants, largely because it received $81 million of grants from the
Crown’s Christchurch Regeneration Accelerator Fund to accelerate Canterbury’s
earthquake recovery. This was not budgeted for.
Operating expenditure of councils
1.15 Councils incurred higher than forecast operating expenditure. The total operating
expenditure for all councils was $12.5 billion, which was a $626 million (5.3%)
increase compared with planned expenditure of $11.9 billion. When Auckland
Council is excluded from these results, councils incurred total operating
expenditure of $8.1 billion compared with a budget of $7.6 billion.
1.16 Figure 2 shows the main categories of councils’ operating expenditure.
Figure 2
2019/20 budget and actual operating expenditure, by sub-category
2019/20 2019/20 Expense as a proportion
Operating expenditure Actual Budget of total actual operating
$million $million expenditure (%)
Depreciation and amortisation 2,661.9 2,638.4 21.3
Employee costs 2,765.9 2,679.0 22.2
Finance costs 806.7 867.6 6.5
Other operating expenditure 6,247.2 5,670.4 50.0
Total 12,481.7 11,855.4 100.0
Source: Analysed from information collected from councils’ annual reports.
1.17 Employee costs for all councils increased by 3.2% to $2.8 billion compared
with a budget of $2.7 billion. In our work, we often hear about the challenges
councils face in recruiting and retaining skilled staff, particularly regulatory and
engineering staff. We will continue to monitor and report on this.
1.18 Other operating expenditure was 10% higher than budgeted. From our analysis,
there were no consistent reasons for this.
1.19 Two councils, Auckland Council and Tauranga City Council, had higher operating
expenditure compared to budget due to increased operating expenses for the
remediation of weathertightness and associated building defects.
1.20 Liabilities from leaky home claims is a long-standing issue that continues to have
significant implications for Auckland Council in particular. This issue is complex
due to uncertainty and the various stages of legal proceedings. As a result, it
8Part 1
Councils’ performance in 2019/20
is difficult for councils to budget for. We first reported on council’s exposure to
liabilities from leaky home claims in our report Local government: Results of the
2006/07 audits.4
1.21 Tauranga City Council reported $30.6 million in weathertightness settlements
in 2019/20. This was a significant increase for the Council as no settlement had
occurred in the previous year. Because of the complexity of the settlements, these
have a high degree of uncertainty when setting the budget. Tauranga City Council
also reported other losses of $35.7 million. This included asset impairments for the
Harington Street carpark building, which did not meet the required standard of
seismic resistance ($19.8 million), and the Bella Vista site remediation ($9 million).
1.22 Auckland Council notes in its annual report that the costs of weathertightness
settlements are not budgeted for because of the uncertainty of a provision for
the remediation of weathertightness and associated building defect claims (as
well as the remediation for the management of contaminated land and closed
landfills). Auckland Council’s provision for remediation of weathertightness claims
increased by $86 million as a result of the high costs associated with multi-unit
claims. The contaminated land and closed landfills provision mainly increased
by $17 million due to an increase in climate change coastal adaptation costs
associated with closed landfills.5
1.23 Another reason for Auckland Council’s increased operating expenditure was an
unbudgeted $10 million that the Auckland Emergency Management Team spent
on Covid-19 relief, including the delivery of food parcels and household goods
during the nationwide lockdown period.6 Additional expenditure for Covid-19
relief might also have been incurred by other councils, but this level of detail was
not in their annual reports.
Building consents
1.24 Councils have a statutory requirement to process most building consent
applications within 20 working days (this applies to 67 out of the 78 councils as
the 11 regional councils do not process building consents). As part of the audit of
councils’ non-financial performance, our auditors often look at how councils meet
this requirement. This timeliness requirement can also be used as an indicator of
councils’ effectiveness in responding to growth.
1.25 In 2018/19, we reported that most councils did not meet the statutory time
frames for processing building consent applications.7
4 Office of the Auditor-General (2008), Local government: Results of the 2006/07 audits, Part 10, page 69.
5 Auckland Council (2020), Auckland Council Annual Report 2019/20, Volume 3, page 31.
6 Auckland Council (2020), Auckland Council Annual Report 2019/20, Volume 3, page 31.
7 Office of the Auditor-General (2020), Insights into local government: 2019, Part 3. 9Part 1
Councils’ performance in 2019/20
1.26 In 2019/20, building consent performance data was available for 60 councils
(2018/19: 60). Of the 60 councils, five reported that they had processed 100%
of building consent applications within 20 working days (Figure 3),8 which is
the statutory requirement (in 2018/19, eight councils reported that they had
processed 100% of building consent applications in that time frame). Thirty-three
councils reported they had processed between 95% and 100% of building consent
applications within the time frame (2018/19: 34), and 22 councils reported that
they processed fewer than 95% (2018/19: 18). We did not find usable information
about building consent timeliness in seven councils’ annual reports.
Figure 3
Councils’ processing of building consent applications within 20 working days
in 2019/20
Source: Collated from 60 councils’ annual reports.
1.27 This indicates a decline in performance in 2019/20 compared with 2018/19, with
fewer councils processing all building consent applications within 20 working
days and more councils processing fewer than 95% of these applications within
the statutory time frame.
1.28 We could reasonably expect fewer building consent applications to have
been processed during the latter half of the 2019/20 financial year as a
result of Covid-19 and the economic slowdown. This might have presented
an opportunity for those fewer applications to have been processed more
quickly. However, this does not take account of the nature or complexity of the
applications, or whether councils’ other activities took priority over building
consent processing post-lockdown.
8 These councils were Horowhenua District Council, Ruapehu District Council, Stratford District Council,
10 Waimakariri District Council, and Waitomo District Council.Part 1
Councils’ performance in 2019/20
1.29 Of the five councils that processed 100% of building consent applications within
the statutory time frame, only one (Waimakariri District Council) is classified as a
high-growth council under the National Policy Statement on Urban Development
Capacity 2016 (see Appendix 1).9 This means that most high-growth councils are
not meeting the statutory time frame for processing building consent applications.
1.30 Timeliness is one of the measures used to assess councils’ performance in relation
to building consents. These measures are generally shown as either “achieved” or
“not achieved” in councils’ annual reports. Trend analysis of councils’ performance
across all building consent measures shows a steady decline from 61.9% achieved
in 2015/16 to 47.3% achieved in 2019/20 (Figure 4). The decrease of 4.3% from
2018/19 to 2019/20 is larger than the 3.4% average decrease per year from
2015/16 through to 2018/19. Given that performance has been declining since
2015/16, Covid-19 cannot be the principal reason for this, in the years up to and
including 2018/19.
Figure 4
Percentage of all building consent performance measures achieved and the total
number of building consents issued for new dwellings, 2015/16 to 2019/20
Source: From information collected from councils’ annual reports and Statistics New Zealand.
1.31 Figure 4 shows that the total number of building consents issued has increased
steadily from 29,097 in 2015/16 to 37,614 in 2019/20. Overall, the percentage of
performance measures achieved has decreased over the same period. However,
this might not represent a direct causal relationship and there could be other
factors contributing to fewer building consent performance measures being
achieved over time.
9 Two provincial and three rural councils met the statutory time frame. 11Part 1
Councils’ performance in 2019/20
1.32 We encourage all councils to investigate their performance. In our view,
high-growth councils in particular need to consider what effect this could have
on their ability to support growth in their communities.
Levels of service were not significantly affected in 2019/20
as a result of Covid-19
1.33 Because of the disruption caused by Covid-19, we looked at whether the
performance information reported indicated a decline in the levels of service
provided by councils in 2019/20.
1.34 Our analysis did not indicate any consistent decline in the levels of service
provided by councils. This was because many of the services provided by councils
are essential services that continued despite New Zealand moving into a
nationwide lockdown during the financial year.
1.35 However, some services were affected. For example, there was a drop in the
percentage of performance measures achieved in respect of libraries in 2019/20.
Between 2015/16 and 2018/19, the percentage of performance measures
achieved in respect of libraries were relatively stable, dropping from 74.6% in
2015/16 to 70.2% in 2018/19. In 2019/20, this dropped to 54.0%. This is not
unexpected, given that libraries were closed for part of the 2019/20 financial year
during Alert Levels 3 and 4.
12Councils’ investment in
infrastructure 2
2.1 In this Part, we consider how well councils reinvested in their assets, reported
on their three waters assets performance measures, delivered on their 2019/20
capital expenditure budgets, and built assets needed for growth.10 Because
councils generally use debt to fund capital expenditure, we have also considered
the debt owed by the sector as at 30 June 2020.
2.2 In our analysis, we considered the local government sector as a whole and, in
some cases, as five sub-sectors. The sub-sectors were:
• metropolitan councils;
• Auckland Council (considered separately from other metropolitan councils
because of its size);
• provincial councils;
• regional councils; and
• rural councils.
2.3 The most significant result continues to be the level of asset reinvestment.
Councils’ renewal capital expenditure in 2019/20 was 74% of depreciation for the
year. This continues a trend that we have been reporting since 2012/13, which
indicates that councils are not adequately reinvesting in their assets. Further,
councils spent $1.38 billion (21%) less than they planned to on their assets.
2.4 An increasing number of councils have acknowledged in their 2021-31 long-term
plan (LTP) consultation documents that they have been underinvesting in their assets.
Reinvestment in councils’ assets during 2019/20
2.5 To consider how well councils are reinvesting in their assets, we compared capital
expenditure on renewals with the annual depreciation charge. We consider
depreciation to be the best estimate of the portion of the asset that was “used up”
during the financial year. Assets have long life-cycles, so this is only one indicator
of whether councils are adequately reinvesting in their assets.
2.6 Overall, based on our analysis, we remain concerned that councils might not be
adequately reinvesting in critical assets. If councils continue to underinvest in
their assets, there is a heightened risk of asset failure and resultant reduction in
service levels, which will negatively affect community well-being.
2.7 In 2019/20, all councils’ renewal capital expenditure was 74% of depreciation (this
was 79% in 2018/19). This means that, for every $1 of assets used up, councils
were reinvesting 74 cents. For 22 councils, renewal capital expenditure was more
10 For 2019/20, draft financial information for five local authorities was included in our analysis because the
audited financial information was not adopted at the time we carried out our analysis. Five councils missed the
revised deadline to complete and adopt their audited annual report by 31 December 2020. Paragraphs 3.4-3.9 of
this report provide more information. 13Part 2
Councils’ investment in infrastructure
than 100% of depreciation. This is slightly fewer than the 29 councils for which
this was the case in 2018/19.
2.8 Figure 5 compares renewal capital expenditure with depreciation for all councils,
from 2012/13 to 2019/20. There are two lines on the graph. One line includes all
councils, and the other excludes Christchurch City Council.
2.9 Christchurch City Council’s renewal capital expenditure is proportionately higher
than other councils because of the rebuilding work it has done since the 2011
Canterbury earthquakes.
Figure 5
Renewal capital expenditure compared with depreciation for all councils,
2012/13 to 2019/20
Source: Analysed from information collected from councils’ annual reports.
2.10 During the past eight years, renewals ranged between 74% and 89% of
depreciation for all councils. However, the effect of Christchurch City Council’s
rebuild after the Canterbury earthquakes did not give an accurate picture of how
much all councils were investing in renewals, mainly from 2012/13 to 2016/17.
Overall, there was a change between 2016/17 and 2017/18 where councils’
renewal investment significantly increased, but this has declined since 2017/18.
2.11 In 2019, we reported that councils were forecasting, in their 2018-28 LTPs, an
increase in what they were proposing to spend to renew their assets.11 All councils,
14 11 For example, Office of the Auditor-General (2019), Our 2018 work on local government, Figure 2.Part 2
Councils’ investment in infrastructure
excluding Christchurch City Council, had planned renewing assets at over 80% of
the depreciation expense for the 2018/19 and 2019/20 financial years. Figure 5
shows that this has not occurred.
2.12 Councils are currently preparing their 2021-31 LTPs. We intend to analyse
these plans to see how councils are planning to catch up on any previous
underinvestment in their assets and will report on our analysis.
2.13 When considering council sub-sectors (see Figure 6), and excluding Christchurch
City Council, two sub-sectors have a different trend to that shown for all councils.
Figure 6
Renewal capital expenditure compared with depreciation for all council
sub-sectors (excluding Christchurch City Council), 2012/13 to 2019/20
Source: Analysed from information collected from councils’ annual reports.
2.14 Regional councils’ renewals as a percentage of depreciation ranged from
74% (in 2012/13) to 170% (in 2018/19), then dropped to 103% in 2019/20.
Greater Wellington Regional Council replacing a significant number of public
passenger vehicles during 2018/19 affected that year’s figure. Environment
Canterbury’s replacement of its head office building was the main factor for the
peak in 2015/16.
15Part 2
Councils’ investment in infrastructure
2.15 Rural councils’ renewals as a percentage of depreciation ranged from 75% (in
2016/17) to 98% (in 2018/19), with a small drop to 95% in 2019/20. Roading
assets are rural councils’ largest asset category. As noted in paragraph 1.13,
councils receive a subsidy from Waka Kotahi New Zealand Transport Agency,
which is an incentive to replace their roading assets. This funding relationship,
along with rural councils’ asset mix, might explain why they have a different trend
to other council sub-sectors.
2.16 We have also considered 2019/20 renewals expenditure (excluding Christchurch
City Council) by infrastructure asset category. Other infrastructure asset classes
have the following percentages of renewals spend as a proportion of depreciation
in 2019/20 (see Figure 7):
• Roading and Footpaths – renewals spending was 80% of depreciation.
• Water supply – renewals spending was 74% of depreciation.
• Wastewater – renewals spending was 64% of depreciation.
• Stormwater – renewals spending was 39% of depreciation.
Figure 7
Renewal capital expenditure compared with depreciation for all councils
combined (excluding Christchurch City Council) by infrastructure asset category,
2015/16 to 2019/20
Source: Analysed from information collected from councils’ annual reports.
16Part 2
Councils’ investment in infrastructure
2.17 It is evident that the level of reinvestment is lower for all three waters assets
(drinking water supply, wastewater, and stormwater), compared to roading and
footpaths. Over the last two years, the amount reinvested into the three waters
assets has also been significantly less than what councils budgeted for in their
2018-28 LTPs. Given the age of some of these networks, we are concerned that
councils are more likely to defer reinvestment in their three waters assets than in
roading and footpaths. We will continue to look into this as we review councils’
2021-31 LTPs.
2.18 The data also demonstrates that the level of reinvestment is significantly lower
for stormwater than for other water assets. This is consistent with the findings
of our December 2018 report Managing stormwater systems to reduce the risk of
flooding, where we reported that councils were spending less than depreciation
on renewing stormwater assets, which might indicate underinvestment. These
lower levels of investment could be because there is a tendency for councils to
prioritise water supply and wastewater over stormwater, particularly as there are
other options to manage stormwater depending on local geography (for example,
through discharge to land).
2.19 Although spending on renewals is less than the annual depreciation charge,
overall councils have increased capital expenditure on their three waters assets.
2.20 In 2019/20, councils spent $1.7 billion on three waters assets (see Figure 8), which
represents 54% of total council spending on infrastructure assets for the year.
This is an increase of $385.6 million (29%) from 2018/19. We expect this level of
spending to increase in the coming years.
Figure 8
2019/20 spending on three waters assets as a proportion of spending on total
infrastructure assets, by capital expenditure type
Total Percentage of total
Three waters
infrastructure infrastructure
Capital expenditure assets
assets spending on three
$million
$million waters assets
Meet additional demand 614.0 838.7 73.2
Improve the level of service 500.5 1,045.4 47.9
Renew existing assets 591.7 1,270.1 46.6
Total 1,706.2 3,154.2 54.1
Source: Analysed from information collected from councils’ annual reports.
17Part 2
Councils’ investment in infrastructure
Three waters performance measures and trends
2.21 Under the Non-Financial Performance Measures Rules 2013 made by the Secretary
for Local Government, councils are required to report their performance against
specific performance measures for the three waters (drinking water supply,
wastewater, and stormwater). These measures are shown as either “achieved” or
“not achieved” in councils’ annual reports.
2.22 Figure 9 shows that performance for all three waters measures was relatively
consistent between 2015/16 and 2018/19. Water supply performance remained
consistent into 2019/20. However, the percentage of wastewater measures that
were achieved declined from 83.3% in 2018/19 to 76.6% in 2019/20, and the
percentage of stormwater measures that were achieved increased from 77.3% in
2018/19 to 83.6% in 2019/20.
Figure 9
Percentage of water supply, wastewater, and stormwater performance measures
achieved, 2015/16 to 2019/20
Source: Analysed from information collected from councils’ annual reports.
2.23 The consistent performance against the three waters performance measures
show that, at this point, the underinvestment in assets is not significantly
affecting the levels of service being provided to communities for the sector
as a whole. However, these results will be different for individual councils.
18Part 2
Councils’ investment in infrastructure
We also note that assets have long lives and can often sustain a period of
underinvestment before levels of service start to decline.
Delivery of capital expenditure budgets
2.24 Most councils did not deliver on their total capital expenditure budgets in
2019/20. This means that some capital projects are either delayed or not being
delivered at all, which could affect the levels of service received by communities.
2.25 Councils’ total capital expenditure in 2019/20 was $5.14 billion, which was the
highest amount councils spent on their assets in the last eight years. However,
the amount spent was only about 79% of the $6.52 billion budgeted.12 This is a
smaller percentage than in 2018/19, when councils spent 82% of their capital
expenditure budgets. The lockdowns in response to Covid-19 are likely to have
affected the delivery of some projects.
2.26 On average, all council sub-sectors spent less than 100% of their capital
expenditure budgets. The regional council sub-sector was the lowest, spending
$142 million or, on average, 56% of their budget. By comparison, Auckland Council
spent $2.30 billion or 93% of its budget.
2.27 Looking at individual councils, 52 councils spent less than 80% of their capital
expenditure budgets. This continues a pattern we have observed over time (see
Figure 10). There were 12 more councils spending less than 80% of budget than
in 2018/19. This is the highest number in the last eight years. Covid-19 would
have affected the delivery of some projects, but there are also constraints in the
availability of contractors, specialists, and associated resources in New Zealand.
Figure 10
Number of councils spending either less than 80%, between 80% and 100%, or
over 100% of their budgeted capital expenditure, 2012/13 to 2019/20
Spent less than 80% of Spent 80% to 100% of Spent over 100% of
budget budget budget
2012/13 46 22 10
2013/14 44 21 13
2014/15 46 21 11
2015/16 45 20 13
2016/17 47 19 12
2017/18 35 23 20
2018/19 40 20 18
2019/20 52 13 13
Source: Analysed from information collected from councils’ annual reports.
12 This information is from the statements of cash flows of councils. It includes only the cash that councils spent on
purchasing property, plant, and equipment and intangible assets. 19Part 2
Councils’ investment in infrastructure
2.28 Councils are currently preparing their 2021-31 LTPs. From our review of the LTP
consultation documents, we observed that most councils are aware of delivery
issues and have put plans in place to support the timing of their investments.
However, there are risks that councils will not be able to deliver on their capital
expenditure budgets because they will not be able to secure the necessary
contractors, specialists, and associated resources.
2.29 This situation is likely compounded by border closures, which restricts the entry of
people into New Zealand, and an increase in proposed capital projects, meaning
that councils are competing with other entities (and each other) to secure limited
resources. We intend to comment further on this issue when we report on the
2021-31 LTPs.
Building assets needed for growth
2.30 Some councils are experiencing significant population growth. For the purposes of
our analysis, we have considered “high-growth councils” to be those categorised
as such in the National Policy Statement on Urban Development Capacity 2016
(see Appendix 1).13
2.31 In their 2018-28 LTPs, high-growth councils forecast making significant
investments to meet the additional demands on their infrastructure.
2.32 This is the second year we have examined how well high-growth councils have
achieved their growth-related capital budgets. In 2019/20, we found that most
of these councils did not build all the assets they had budgeted for. This was also
the case in 2018/19. We encourage these councils to reassess their future planned
budgets to accommodate what has not been achieved to date.
2.33 In 2019/20, high-growth councils spent approximately $1.04 billion (2018/19:
$0.93 billion) on capital expenditure intended to meet additional demand. This
was nearly 70% of the $1.49 billion budgeted in 2019/20 for this purpose. Three
councils spent more than their growth-related capital expenditure budgets. In
contrast, four councils spent less than 45% of their budgets.
2.34 High-growth councils received capital subsidies or grant revenue of $1.15 billion –
6.4% more than the $1.08 billion budgeted for the year. It is therefore unlikely that
funding is the primary reason for the delay in capital expenditure. High-growth
councils might not have been able to complete their capital programmes for the
same reasons as other councils (see paragraphs 2.28-2.29).
13 The National Policy Statement on Urban Development 2020 came into effect on 20 August 2020. It replaced the
National Policy Statement on Urban Development Capacity 2016. The new policy statement might mean that
different councils are defined as high growth from 2020/21 onwards. However, the old policy statement still
20 applied for the 2019/20 year we are looking at in this report.Part 2
Councils’ investment in infrastructure
2.35 As noted in paragraph 2.30, we have considered high-growth councils to be those
categorised as such in the National Policy Statement on Urban Development
Capacity 2016. However, from our review of the 2021-31 LTP consultation
documents, we note that many councils that previously indicated they had
negative or static growth are now having to deal with growth and the associated
provision of infrastructure. Therefore, the definition and impacts of “high-growth”
could apply to more councils in the future.
Council debt trends
2.36 The total amount of budgeted debt for all councils for the year ended 30 June 2020
was $19.52 billion. The actual total debt was $19.65 billion. This was $136 million,
or 1%, more than budget. Councils generally use debt to fund capital expenditure.
2.37 We considered Auckland Council’s debt separately from other councils because
of its size. Auckland Council had borrowing of $10.2 billion as at 30 June 2020,
which was $494 million more than they anticipated borrowing. Auckland Council
reported in its annual report that the increase in borrowings was higher than
budget due to the reduced revenues and pressures on working capital arising
from Covid-19.14
2.38 The total amount of debt as at 30 June 2020 for all other councils was
$9.44 billion, compared with a budget of $9.80 billion.
2.39 From our review of the 2021-31 LTP consultation documents, we are aware that
several councils are planning to borrow to fund increased capital expenditure. In
some cases, councils are planning to borrow to help fund operating costs in the
short term, particularly where they have been affected by lower than anticipated
revenue streams.
2.40 As a general principle, debt should not be used to fund operations. It has been
described as “borrowing to pay for the groceries”. Any councils borrowing to fund
operating expenditure should consider their rationale for using this approach.
14 Auckland Council (2020), Auckland Council Annual Report 2019/20, Volume 3, page 65. 213 The audit reports we issued
3.1 Each year, auditors give an independent report on each council’s financial
statements and performance information (statements of service performance).
This information is an important part of the council’s annual report and its
accountability to its community.
3.2 The auditor’s report lets a reader know whether they can rely on the audited
information in the council’s annual report.
3.3 In this Part, we discuss when councils adopted their 30 June 2020 annual reports
and whether they met the deadline for doing so, the types of audit reports we
issued, and the effect of Covid-19 on our audits.
When the audit reports were issued
3.4 The Local Government Act 2002 requires councils to:
• complete and adopt an annual report that contains audited financial
statements and service performance information within four months after the
end of the financial year;
• make the audited annual report publicly available within one month of
adopting it; and
• make an audited summary of the annual report publicly available within one
month of adopting the annual report.
3.5 In response to Covid-19, Parliament passed legislation on 5 August 2020 to extend
the statutory reporting time frames for councils (amongst other public entities) by
two months. For councils, this moved the statutory deadline from 31 October to
31 December 2020. The statutory time frames were extended so that council staff
and auditors could ensure that there was no reduction in the quality of financial
and performance reporting because of the impact of Covid-19.
3.6 Five councils missed the revised deadline to complete and adopt their audited
annual report.
3.7 There has been a 10% decline to 86% in the number of councils making their
annual report publicly available within a month of adoption and a 10% decline to
82% in the number of councils releasing their summary annual reports within a
month of adopting their annual report.
3.8 We consider that this is likely because the statutory deadline was extended until
the end of December 2020. This meant that the deadlines for making the summary
and the annual reports available often occurred during the holiday period.
3.9 Appendix 2 provides more detail on when councils adopted and publicly released
their annual reports and summary annual reports.
22Part 3
The audit reports we issued
The types of audit report we issued
3.10 At the end of December 2020 (the revised statutory deadline), audit reports had
been issued on 73 councils’ financial statements and performance information
for the financial year ended 30 June 2020. All of the council audit reports issued
included an emphasis of matter paragraph. We explain this in more detail in
paragraph 3.14.
3.11 If a material aspect of a council’s financial statements or performance
information does not comply with accounting standards or the organisation
cannot provide us with the evidence needed to support that information, we
issue a “qualified audit opinion”.15
3.12 We issued 21 qualified audit opinions on councils’ financial statements and
performance information. Many of the qualified audit opinions related to issues
arising in the performance information reported by councils. We explain this in
more detail in paragraphs 3.15-3.27.
Emphasis of matter paragraphs – impact of Covid-19
3.13 The World Health Organisation declared Covid-19 a pandemic on 11 March 2020.
In response, we considered what effects the pandemic, including the potential
economic impact and possible effects of the nationwide lockdown,16 would have
on public entities and their accountability documents. We determined that it
would be prudent to refer to this in the audit reports that we issued for all public
entities for the year ended 30 June 2020.
3.14 As a result, we included emphasis of matter paragraphs in all council audit reports17
to draw attention to the relevant disclosures about the impact of Covid-19 that
each entity made in its financial statements and performance information.
Qualified opinions – statement of service performance information
3.15 The statement of service performance contains important information about
what a council achieved during the year. The performance that a council reports
should tell a story about the services it delivers, why it delivers them, what
standards it is looking to meet in delivering those services, and what difference it
intends to make for the community it delivers services to.
15 For definitions of audit reports, see Office of the Auditor-General (2014), The Kiwi guide to audit reports.
16 On 21 March 2020, the New Zealand Government introduced a four-tiered alert-level system in response
to Covid-19. On the 25 March, New Zealand moved into Alert Level 4 and a nationwide lockdown. A state of
emergency was declared. More information on this timeline is available at www.covid19.govt.nz.
17 The Auckland Council audit report did not include an emphasis of matter paragraph in their audit report, as they
are issued with a key audit matters opinion. However, the Auckland Council audit report still refers to the effects
of Covid-19 and makes reference to the relevant disclosures where they are relevant to our key audit matters. 23Part 3
The audit reports we issued
3.16 Good quality reporting, of both non-financial and financial information, allows
informed consideration by readers – particularly those from the communities
affected – about what is happening and what could be done better. Of the
audit opinions we issued for the year ended 30 June 2020, 20 (27%) included
qualifications on the council’s non-financial information. For the 30 June 2019
financial year, we issued seven qualified opinions on non-financial information
repeated in the statement of service performance.
3.17 Ten of the performance information qualifications were related to the measures
that councils are required to report as set out in the Non-Financial Performance
Measure Rules 2013 (the Rules) made by the Secretary for Local Government. This
included measures that include the number of complaints (per 1,000 properties
connected) received about:
• drinking water clarity, taste, odour, pressure or flow, continuity of supply, and
the council’s response to any of these issues;
• sewage odour, sewerage system faults and blockages, and the council’s
response to issues with the sewerage system; and
• the performance of the stormwater system.
3.18 The Department of Internal Affairs has issued guidance to help councils apply the
Rules. This includes guidance on how to count complaints.
3.19 Our audits found that the 10 councils had not counted complaints in keeping with
the Department of Internal Affairs’ guidance. We also found that the method of
counting these councils used was likely to have understated the actual number of
complaints received in the current year and in comparative years.
3.20 In some cases, complete records were not available and auditors were unable to
determine whether the councils’ reported results for these performance measures
were materially correct.
3.21 These measures are important because the number of complaints are indicative
of the quality of services received by ratepayers as well as the scale of the issues
that are the subject of the complaints.
3.22 Further, we also identified that four of those councils had deficient systems for
classifying complaints against each of the three measures of water performance
listed in paragraph 3.17.
24Part 3
The audit reports we issued
3.23 Four of the qualifications on performance information related to councils who
used information provided by Wellington Water Limited.18 Auditors identified
issues with the following performance measures:
• fault response times for water supply, wastewater, and stormwater; 19
• number of dry weather sewerage overflows;20
• maintenance of the reticulation network – water supply;21 and
• total number of complaints received.22
3.24 Wellington Water Limited was unable to provide reliable information for these
performance measures for the following reasons:
• inaccurate inputs – for example, attendance and resolution times for fault service
requests were not always recorded at the point in time that they occurred;
• system faults – for example, the system used to record dry weather sewerage
overflows incorrectly included other events; and
• limited input information – for example, there were a limited number of
water meters across the reticulation network to reliably report the water loss
percentage for each shareholding council and the information was reported at
a regional level.
3.25 For four statement of service performance qualifications, auditors found that the
supporting evidence for the performance measures being reported was unreliable.
The reasons for this varied, for example:
• For one council, the performance measures for its water supply and
wastewater services were considered unreliable as a result of implementing
a new customer service request system. The system was successfully
implemented but this was six months after it was introduced, so the council
was unable to provide accurate supporting evidence for the first six months of
the financial year.
• One council received a qualification on its performance information for fault
resolution times for water-related call outs. The data used to generate the
results contained several irregularities, such as negative response and resolution
times, and requests dated before the current year. The way the data was
recorded meant that there was not sufficient evidence to support the measures.
18 Wellington Water Limited manages the water assets and services of six councils and provides performance
information in respect of those services to all six councils, which are then required to report that information
in their respective statements of service. The limitations in scope affecting the four council’s that received
qualifications were not considered significant in the other two council’s because they did not report the same
performance information because of how they deliver water services.
19 All four councils that received a qualification had an issue with this measure.
20 All four councils that received a qualification had an issue with this measure.
21 Three of the councils that received a qualification had an issue with this measure.
22 Three of the councils that received a qualification had an issue with this measure. 25Part 3
The audit reports we issued
• One council received a qualification on its performance information for resource
consent processing times in 2018/19. In this case, it was because auditors were
unable to determine whether the council’s comparative year information was
materially correct for this performance measure. The council had resolved the
issues with recorded consent processing times for the 2019/20 audit, but the
limitation for comparative year data could not be resolved.
• One qualification on performance information was directly related to Covid-19.
The measure was of customer satisfaction for public transport services. This
is an important aspect of transport and urban development performance
because it indicates the quality of the service provided. In this instance, a
customer survey to determine passenger satisfaction levels could not be
completed because of the nationwide lockdown. As a result, the council could
not report on customer satisfaction.
3.26 The increase in the number of qualifications on council’s non-financial
information indicates that, increasingly, councils’ performance systems are
not robust or, in some cases, not fit for purpose, resulting in poor performance
reporting. Communities want to know that the levels of service they are receiving
for the rates they pay. This is a critical part of ensuring that the community can
have trust and confidence in their council.
3.27 To produce reliable data, councils need robust performance management systems.
Otherwise, it is difficult for a council to clearly understand its performance and
where it needs to focus its finite resources to maintain the appropriate levels of
service for its communities.
Other qualified opinions
Kaikōura District Council
3.28 Kaikōura District Council received a qualified opinion on both its financial and
performance information.
3.29 Complexities created by the earthquake in November 2016 mean that Kaikōura
District Council has continued to receive qualified audit opinions because of
limitations and uncertainties supporting the value of certain assets reported in its
financial statements.
3.30 In 2019, Kaikōura District Council was able to revalue its infrastructure assets
and buildings. We were satisfied that the revalued carrying amount was fairly
reflected at 30 June 2019 in the financial statements. However, we still issued a
qualification on the financial information because there was a limitation relating
to impairment and revaluation movements in the figures for the previous year. We
were satisfied that property, plant, and equipment was appropriately accounted
for in the year ended 30 June 2020.
26Part 3
The audit reports we issued
3.31 We also issued a qualification on Kaikōura District Council’s performance
information because the Council does not have sufficiently reliable systems and
processes to accurately report a number of performance measures. For just under
half of the performance measures, the Council either was not able to report on
any performance for the year or had reported performance as incomplete.
Taranaki Regional Council
3.32 We issued a qualification on Taranaki Regional Council’s financial information
because there were limited audit procedures that our auditor could adopt to
independently confirm the reasonableness of the carrying value of
earthquake-prone stands at Yarrow Stadium.
The effect of Covid-19 on our audits
3.33 Covid-19 significantly affected the way auditors completed their 2019/20 audits.
There were also additional uncertainties and complexities that auditors needed
to consider in carrying out their audit work. In many cases, this resulted in extra
audit work and additional audit fees.
3.34 Our priority was to maintain the health and well-being of our staff while
responding to Covid-19 and during the lockdowns in Alert Levels 3 and 4.
3.35 There were logistical impacts. For example, audit teams were required to work
remotely in many cases and often at late notice, particularly as parts of the
country moved in and out of alert levels. At times, this meant the audit work was
not carried out as efficiently as it could have been and took longer to complete
than would normally be the case.
3.36 Covid-19 also added uncertainty and complexity to our audit work, which
increased the risk of material misstatement in financial statements. For example,
the assumptions used in asset valuations, including investment properties, were
more uncertain with a wider range of possible outcomes than in previous years.
3.37 Councils with investments in airports and other council-controlled organisations
significantly affected by the disruption created by Covid-19 required additional
audit work to gain assurance that the value of the investment was accounted for
correctly and councils were making the appropriate level of disclosures in their
annual reports.
27You can also read