Interim Results for the six months ending 31 December 2019 - Presentation and global webcast, 4 March 2020 Manuel Llobet, Chief Executive Officer ...
←
→
Page content transcription
If your browser does not render page correctly, please read the page content below

Interim Results for the six
months ending 31
December 2019
Presentation and global webcast, 4 March 2020

Manuel Llobet, Chief Executive Officer
Nick Wykeman, Chief Financial Officer
Alan Bullimore, Head of Communications & Market Development
Disclaimer

The information contained in this presentation (“Presentation”) is being               This Presentation includes “forward-looking statements” which include
supplied to you solely for your information and may not be copied, reproduced          all statements other than statements of historical facts, including, without
or further distributed to any person or published, in whole                            limitation, those regarding the Company’s financial position, business strategy,
or in part, for any purpose.                                                           plans and objectives of management for future operations (including
                                                                                       development plans and objectives relating to the products and services of
No reliance may be placed for any purpose whatsoever on the information
                                                                                       the Company and its subsidiaries (the “Group”)), and any statements preceded
contained in this Presentation or on its completeness. No representation or
                                                                                       by, followed by or that include forward-looking terminology such as the words
warranty, express or implied, is given as to the accuracy of the information or
                                                                                       “targets”, “believes”, “estimates”, “expects”, “aims”, “intends”, “will”, “can”,
opinions contained in the Presentation and no liability is accepted for any such
                                                                                       “may”, “anticipates”, “would”, ”should”, “could” or similar expressions or the
information or opinions by Allergy Therapeutics plc (the “Company”) or any of
                                                                                       negative thereof.
its directors, members, officers, employees, agents or advisers or any other
person. Notwithstanding this, nothing in this paragraph shall exclude liability for    Such forward-looking statements involve known and unknown risks,
any representation or warranty made fraudulently. The Presentation speaks as           uncertainties and other important factors beyond the Group’s control that
of the date shown on the front cover. The Company assumes no obligation to             could cause the actual results, performance or achievements of the Group
notify or inform the recipient of any developments or changes occurring after          to be materially different from future results, performance or achievements
the date of this Presentation that might render the contents of the Presentation       expressed or implied by such forward-looking statements. Such forward-
untrue or inaccurate in whole or in part.                                              looking statements are based on numerous assumptions regarding the Group’s
This Presentation does not constitute or form part of any offer of or invitation       present and future business strategies and the environment in which the Group
to sell or issue, or any solicitation of any offer to purchase or subscribe for        will operate in the future. These forward-looking statements speak only as at
any securities for sale in any jurisdiction, nor shall it, or any part of it, or the   the date of this Presentation. The Group expressly disclaims any obligation or
fact of its distribution form the basis of, be relied upon in connection with, or      undertaking to disseminate any updates or revisions to any forward-looking
act as an inducement to enter into, any contract or commitment to do so.               statements contained in the Presentation to reflect any change in the Group’s
The Company’s securities have not been and will not be registered under                expectations with regard thereto or any change in events, conditions or
the U.S. Securities Act of 1933 (the “Securities Act”), and may not be offered         circumstances on which any such statements are based.
or sold in the United States absent registration under the Securities Act or an
available exemption from, or transaction not subject to, the registration
requirements of the Securities Act.

                                                                                                                                                                     2
Agenda

• Financial and operational highlights

• Commercial overview

• Pipeline progress – Polyvac peanut and
  Grass MATA MPL

• Financial results

• Summary and outlook

                                           3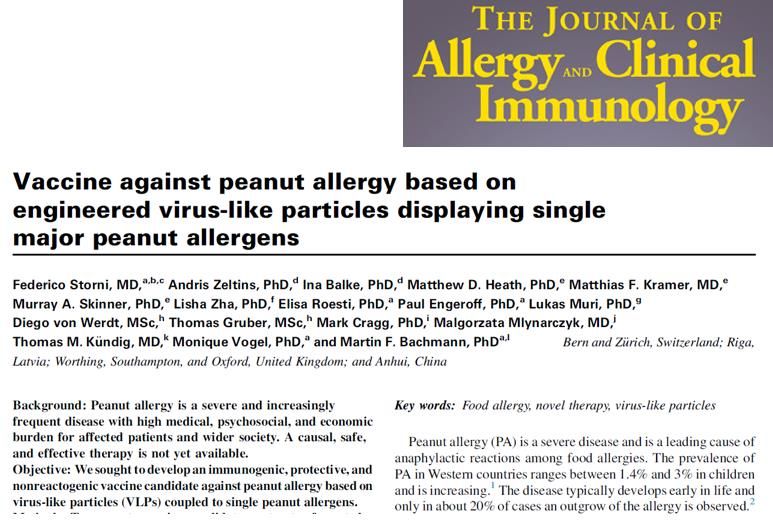
Financial and operational highlights

  9% increase in constant* revenue to £50.5m (H1 2019 £46.7m)

  10% increase in operating profit pre R&D**
   Strong cash balance of                                £39.7m (30 June 2019 £27.4m)

   Clinical progress of key assets

        Polyvac Peanut                                                                                         Grass MATA MPL
        Key preclinical data                                                                                   First stage of PhIII trial to
        published in JACI                                                                                      start in H2 2020

 *Constant currency uses prior year weighted average exchange rates to translate current year foreign currency denominated revenue to give a year on year comparison excluding the effects
 of foreign exchange movements.
**Operating Profit (pre R&D) is calculated by adding back R&D expenditure for the year to the operating profit of the year to arrive at operating profit (pre R&D) of £17.3m (H1 2019: £15.7m)   4
N.B. All financial dates refer to the financial year. All clinical dates refer to the calendar year.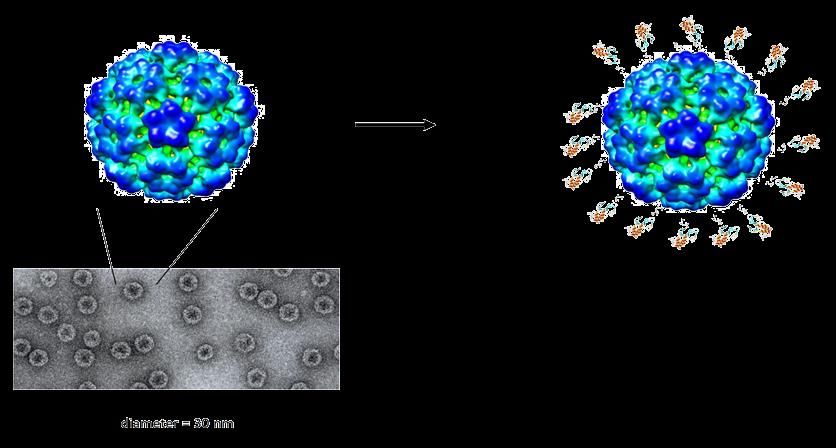
European business shows robust revenue stream

Good sales growth of 8%
                                                                                                                                          3%      4% Netherlands
                                                                                                                                          UK

                                                                                                                                                            61%        1% Czech republic
Strong performances from Germany,
                                                                                                                                                           Germany
                                                                                                                                                                              1% Slovakia
                                                                                                                                                                       7%
                                                                                                                       3%                            3%               Austria
                                                                                                                                                  Switzerland

Spain, Netherlands and
                                                                                                                       other

                                                                                                                                                                     7% Italy
Switzerland                                                                                                                      10%
                                                                                                                                  Spain

          9% CAGR growth                                                                                     FY 19 Sales of £73.7m by product*
          over last 20 years
                                                                                                                                                                                Diagnostics 1%
                                                                                                              Third Party Products 6%
                                                                                                              Acarovac Plus 3%                                                     Pollinex
                                                                                                                                                                                   19%
                                                                                                              TyroMILBE 6%
                                                                                                                                                                                   Venomil
                                                                                                                                                                                   5%
                                                                                                              Tyrosine S/TU
                                                                                                              5%

                                                                                                               Oralvac 13%                                                      Pollinex Quattro
                                                                                                                                                                                42%
* Sales breakdown based on gross sales at budget exchange rates (before freight, rebates and exchange) :
£69.3 million.                                                                                                                                                                                5
After deducting rebates, freight charges and foreign exchange adjustments, total sales for FY2019 is £73.7
million                                                                                                        *Allergy Therapeutics currently has no products licensed for sale in the USA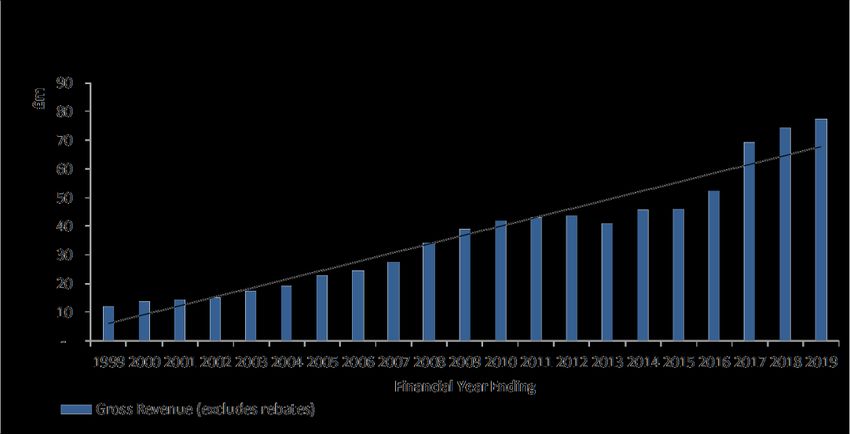
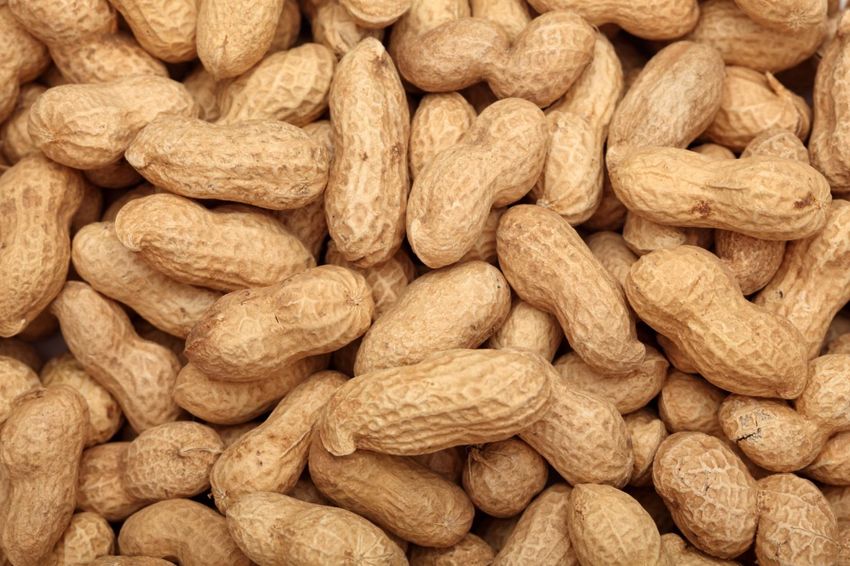
Polyvac peanut product
    Positive preclinical data                                           Provides proof of concept
    published in JACI *                                                 for the generation of sustained
    demonstrates positive safety                                        immunity and protection
    and efficacy profile reducing                                       through vaccination
    systemic and local allergic
    symptoms in a peanut allergy
    model                                                               Aim is long-term immunity

                                                                                                                                                                             Peanut
                                                                                                                                                                             represents a
                                                                                                                                                                             new opportunity
                                                                                                                                                                             into $8bn**
                                                                                                                                                                             worldwide food
                                                                                                                                                                             allergy market

* Storni et al., Vaccine against peanut allergy based on engineered virus-like particles displaying single major peanut allergens. J Allergy Clin Immunol 2019
** The Journal of Allergy and Clinical Immunology 2016. 1% of US population. EACCI Food Allergy and Anaphylaxis Guidelines Group 2016 0.2% of Western European Population.                     6
Management assumption of annual treatment of $2k
Reduced reactogenicity and protection against
systemic anaphylaxis
Vaccines require low
reactogenicity so they do not
cause anaphylaxis when administered to
patients
Single injection protected
against
systemic anaphylaxis
One injection against single allergen
sufficient to induce protection against whole
peanut allergen mixture – never Control (no vaccine)
shown before VLP+Roasted Peanut Vaccine
VLP+Native Peanut Vaccine
VLP+Ara h 2 Vaccine
J Allergy Clin Immunol. 2019. doi: 10.1016/j.jaci.2019.12.007. [Epub ahead of print] 7Peanut programme progressing well
Proof of concept established Optimal strain of E.coli
in animal models for identified to express the VLP-
generation of sustained peanut proteins
immunity and protection
through vaccination
Successful Scientific Advice
Meetings held with three
Manufacturing Process European regulators
(GMP) for clinical studies • Agreed in principal with the
established at CMO proposed development
• First GMP batch programme
manufactured
• Technical batches
manufactured and drug
product filled Submission of clinical trial
• Stability and toxicology application anticipated 2021
programme commenced
8Grass MATA MPL programme In the Phase II (G205) study, a highly statistically significant dose response (p
Financial
Results

            10
P&L – six months ended 31 December 2019
2020 2019 Variance %
+8% £’m £’m £’m
Revenue 50.5 46.7 3.8 8%
Good sales performance
in mixed pollen season (underlying figures)
Gross profit 39.1 37.3 1.8 5%
Overheads (21.8) (21.6) (0.2) 1%
+£0.2m R&D - Expenditure (4.5) (5.0) 0.5
Overheads up
due to phasing and
efficiencies - Settlement 3.2 3.2
Operating profit 16.0 10.7 5.3
£17.3m Net Financing costs (0.1) (0.0) (0.1)
Operating profit pre R&D Tax (0.6) (0.4) (0.2)
(2019: £15.7m) increase due to good sales
and operating efficiencies Profit after tax 15.3 10.3 5.0
11Sales – six months ended
31 December 2019
2020 2019 Variance
%
£’m £’m £’m
Good sales growth driven by
good performance in Gross Revenue at Constant
Northern Europe 54.1 49.1 5.0 10%
Exchange Rate
Rebate at Constant
Growth in Pollinex, Pollinex (3.3) (2.4) (0.9)
Exchange Rate
Quattro and Venomil
Net Revenue at Constant
50.8 46.7 4.1 9%
Exchange Rate
Most markets Effect of Foreign Exchange (0.3) (0.3)
performing robustly
Net Revenue 50.5 46.7 3.8 8%
Small FX impact in this *Constant exchange rate
1.12
period as exchange rates Euro/£
similar Current exchange rate
1.13 1.12
Euro/£
* Constant currency uses prior year weighted average exchange rates to translate current year foreign currency denominated revenue to
give a year on year comparison excluding the effects of foreign exchange movements. 12Balance sheet at
31 December 2019
2020 2019 Variance
£'m £'m £'m
Non-current assets
IFRS 16* Property , plant and equipment 11.3 10.0 1.3
Operating lease assets Right of use assets* 9.0 9.0
(£9m) and lease creditors Intangible assets 4.6 4.9 (0.3)
(£9m) on balance sheet Investments 5.5 5.4 0.1
30.4 20.3 10.1
(£1.6m) Current assets
Inventories
Trade and other receivables
8.7
8.8
9.0
10.3
(0.3)
(1.6)
Debtor drop due to reduction Cash 39.7 31.6 8.1
in debtor days
Derivative financial instruments 0.3 0.3
Liabilities
£39.7m Financial Liabilities
Lease liabilities*
(2.0)
(9.0)
(2.8) 0.8
(9.0)
Cash at 31 Dec 2019
Other Liabilities (25.8) (24.0) (1.7)
Net Assets 51.2 44.5 6.7
£2.0m Equity
Share capital and share premium 113.2 113.2 0.0
Debt. Seasonal overdraft
in place (undrawn) P&L account and other reserves (62.0) (68.7) 6.7
Total Equity 51.2 44.5 6.7
13Cashflow for the six months ended
31 December 2019
2020 2019
£’m £’m £’m £’m
st
Opening cash balance 1 July 27.4 15.5
Positive net cash
Profit before tax 15.9 10.7
generated by good sales,
cost phasing and control Adjustments re operations (1.6) (4.0)
Net cash generated by operations 14.3 6.8
Tax received 0.6 0.4
Interest paid (0.3) (0.1)
Good working capital Interest received 0.2 0.1
control Investments and acquisitions (0.1) (0.2)
Capital expenditure (1.1) (0.7)
Net cash used in investing activities (1.0) (0.8)
Net movement in borrowings (0.4) (0.3)
Net Proceeds of equity raise 10.2
Strong cash position of IFRS repayment (0.7)
£39.7m driven by trading Net cash (used in)/generated in
(1.0) 9.9
performance financing activities
Effects of exchange rates on cash (0.3) 0.1
Closing Cash Balance 31 December 39.7 31.6
14Summary and outlook
15Three Pillars to Growth
01 02 03
Europe Strong pipeline US Market
New technologies underpin Significant opportunity
Continue good growth via
pipeline breadth and depth in largest allergy market
marketing and supply chain as
well as better adherence
Looking for further opportunities to Preparing for stepwise Phase III Grass
extend pipeline MATA MPL trial
Continue expansion of key
products across region
Investment strategy
Look for new markets for current supported by growing
products revenue stream
162020 set to be a key year
Consistent sales Continued gain in First stage of
growth market share Grass MATA MPL
outperforming the Phase III trial start
market
Continued progress of Delivering against Groundwork to
Peanut vaccine our strategy: capture the US
programme ahead of three pillars to market opportunity
CTA submission in growth
2021
17Q&A
Section 4

            Appendix

                       19
Solid Sales and Global presence
Sales and marketing network comprising c.140 European sales force
Latvia
Estonia
Lithuania
South Korea
Belarus
Netherlands Poland
UK
Germany
Czech Rep.
Slovakia
Austria
Switzerland
Serbia
Italy
Albania
Spain
Portugal Greece
Canada
Malta Subsidiaries in 7
countries and distribution
agreements in additional
14 countries
20Preparing for US entry
>100 injections Capturing the
Current treatment: up to 100 $2bn opportunity
injections over 3-5 years*** estimated allergy
immunotherapy market** New USP and FDA regulations
drive towards pharmaceutical
2-3m grade, centrally manufactured,
Americans receive allergy single allergen treatments
16% immunotherapy***
$300-400m
Some adherence
levels as low as 16%* Estimated peak
grass sales**
Currently no registered Building on progress to date
injected products • $100m invested in clinical studies to date
• 15 clinical trials completed to date,
including Phase I, II & III successful
studies
• Investigated in over 3,000 patients
worldwide, mainly in the US
*Hankin CS, Cox L, Lang D et al 2007 JACI
** Internal estimate 21
*** Professor Lawrence DuBuske MDInnovative, Broad Pipeline and Marketed Products
Also available as a
Pre-clinical Phase I Phase II Phase III Market/Registered Named Patient Product
Grass MATA Short-course SCIT
Tree MATA Short-course SCIT
Ragweed MATA Short-course SCIT
Bee Venom SCIT Short-course SCIT
Wasp Venom SCIT Short-course SCIT
Grass MATA MPL Short-course Grass SCIT with MPL
Birch MATA MPL Short-course Birch SCIT with MPL
Ragweed MATA MPL Short-course Ragweed SCIT with MPL
Trees MATA MPL Short-course Tree SCIT with MPL
Oral Grass, Trees Sublingual immunotherapy with flexible-dosing
& House Dust Mite
Short-course modified Allergen
Modified Mite Platform
HDM SCIT + MPL
Short-course
Peanut SCIT
Peanut SCIT
SCIT: Subcutaneous Immunotherapy 22
MATA: Modified Allergen Tyrosine AdsorbedCutting-edge Platform Technologies
Modified
Recombinant Microcrystalline Monophosphoryl Virus-Like
Allergen Native Allergen
Allergen Tyrosine (MCT) Lipid A (MPL) Particles (VLP)
(Allergoid)
MATA
MATA MPL (PQ)
Sublingual
Mite SCIT
Mite SCIT + MPL
Venom SCIT
Peanut*
* Product under pre-clinical investigation, full product profile yet to be determined
23PQ: Differentiated platform approach enhances
compliance, leads to higher efficacy and
successful outcomes
Allergoid
Allergoid
Allergen chemically Reduces IgE reactivity and
modified thus aids tolerability
Micro
Crystalline MCT
Tyrosine (MCT) L Tyrosine retains the Allergoid
A natural amino acid
which is readily and MPL at the site of injection
metabolised (half life = 48 hours) as depot
MPL MPL Adjuvant
Adjuvant
MPL (Monophosphoryl MPL allows Specific
Lipid A) is a non-toxic Immunotherapy (SIT)
derivative of treatment course to be
lipopolysaccharide shortened (big impact on
(LPS) adherence)
24VLP technology
Make the allergen look like a virus to the immune
system
Consequently induces a strong cellular and humoral
immune response
Antagonizing the Th2 driven allergy = protective
immunity
VLP + allergen = optimized immunotherapy:
Th2 Th1You can also read