INTRODUCING ROOTS 2019 - Spark Media
←
→
Page content transcription
If your browser does not render page correctly, please read the page content below

INTRODUCING
 ROOTS 2019

              1
WHY ARE WE HERE

          You can’t build a beautiful model without a
                plan / manual (architecture)

            Good news: our profession now has the
            architecture (framework) to guide all our
                        marketing efforts

                                                        2
WHY ARE WE HERE
                                           01
WHAT WE KNOW FOR SURE

       • Whilst buyer behaviour might
         adapt to changing market
         realities…

       • …our brains don’t
       • Well they do change but they
         will not change in our lifetime
       • We are wired to respond in
         certain ways

                                                3
WHY ARE WE HERE
                                                    01
GOOD NEWS - UNPACKED
ROOTS forms the SA framework of this architecture

                                                         4
WHY ARE WE HERE

MORE GOOD NEWS
       • The more we learn about the evolution in marketing
         thinking, the more we see the value and relevance of
         ROOTS data.

                               Source:

                                              (After all, the Ehrenberg-Bass Institute has)

                                                                                              5
1.   Credentials and Methodology

2.   Highlights of the many categories

                                                         01
3.   Buyer Behaviour DISCOVERIES

4.   Media

5.   Conclusion

                                         CREDENTIALS &
                                         METHODOLOGY

                                                              66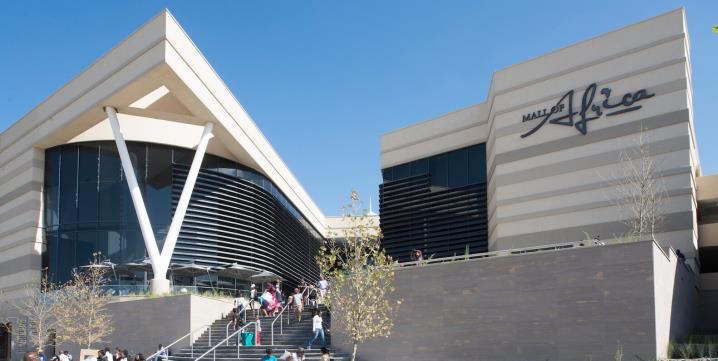
HISTORY & CREDENTIALS
                                                                     02
HOW IS ROOTS CONDUCTED?

         • Multistage clustered random probability sampling
         • Research Universe - decision makers (shoppers) aged 18 plus, living in formal
           households within selected local newspaper footprints across South Africa.
         • Decision makers are questioned in their home by a trained interviewer using a
           tablet to capture the answers.
         • This is known as a CAPI interview (Computer Assisted Personal Interview).
         • The interview lasts for 50 minutes.
         • Sample sizes vary from 150 to 300 interviews per area depending on it’s size and
           diversity.
         • This ensures a safe margin of error (95% confidence level).

                                                                                              7
HISTORY & CREDENTIALS
                                                                                                             02
ROOTS FOOTPRINT                                                                 LIMPOPO - 1

= more than 100                                                                                                   MPUMALANGA - 7

individual footprints                                                NORTH WEST - 1
                                                                                                                         TSHWANE (PRETORIA) - 7
                                                    FREE STATE - 4
                                                                                                                         EAST RAND - 9

                                                                                                                         JHB NORTH - 8

                                                                                                                         WEST RAND - 4
                              NORTHERN CAPE - 1
                                                                                                                         JHB SOUTH - 5

                                                                                                                         EMFULENI (VAAL) - 5

                                                                                                                          SOWETO - 10

                                                                                                                  ETHEKWINI (DURBAN) - 9
                  OTHER WESTERN CAPE - 3
                                                                                                                  ZULULAND - 1

                                                                                                                  NORTH COAST - 2
                                                                                          EASTERN CAPE - 4
                                                                                                                  MID SOUTH COAST - 3
                                                                               GARDEN ROUTE - 3
                                                                                                                  LOWER SOUTH COAST - 3
                                                  CAPE TOWN - 13
                                                                                                                  REST OF KZN - 4

                                                                                                                                                  8
HISTORY & CREDENTIALS
                                                                                                            02
RESPONDENT BASE - SPREAD OF SEM
                                      ROOTS 2019                Establishment Survey

           4 500
           4 000
           3 500
           3 000                                                                                             *
           2 500
           2 000
           1 500
           1 000                                                                                                 *
             500
               0

         * This graph reads: ROOTS 2019 has a respondent base of 3,032 respondents in SEM 10 (High) where
         as the Establishment Survey has a respondent base of 776 respondents in SEM 10 (High)

                                                                                                                     9
1.   Credentials and Methodology

2.   Highlights of the many categories

                                                  01
3.   Buyer Behaviour DISCOVERIES

4.   Media

5.   Conclusion

                               ROOTS HIGHLIGHTS

                                                       10
SOME HIGHLIGHTS
03
#1 USE THE INTERNET DAILY Total trendable sample
Growth of internet use over 7 years – 3 ROOTS surveys 71
88 areas that can be trended 52
Each marker / dot = approximately 300 interviews 28
2013 2016 2019
2103 2016 2019
100
90
80
70
60
50
40
30
Implications:
20
10 Questionnaire changes
0 inclusion of online behaviour
* This graph reads: in 2013, 28% of decision makers use of the internet daily, this has increased to 52% and 71% in ROOTS 2016
and ROOTS 2019 respectively. The graph indicates all 88 areas and the increase in each area’s daily use of the internet.SOME HIGHLIGHTS
03
#2 TRENDED REACH OVER TIME
The stability of local community papers – 3 ROOTS surveys
88 areas that can be trended Health check
2013 2016 2019
67% 65% 66%
35%
29%
25%
22%
18% 17% 19%
15%
12%
Local Papers Daily Papers Weekly / Weekend Weekly Magazine
Papers
* This graph reads: In ROOTS 2013, 67% of decision makers read their local paper, in 2016 this figure was 65% and in 2019, 66% read
their local paper.
12SOME HIGHLIGHTS
03
TRENDED REACH OVER TIME: JABAVU
The stability of local community papers – 2 ROOTS surveys
2016 2019
83%
67%
22%
17%
5% 4% 3%
2%
Jabavu Urban News Daily Sun Soccer Laduma Drum
* This graph reads: In ROOTS 2016, 67% of decision makers in Jabavu read their local paper – The Jabavu Urban News, in 2019 this
figure has increased to 83% of decision makers in Jabavu read their local paper – The Jabavu Urban News.
13SOME HIGHLIGHTS
03
TRENDED REACH OVER TIME: BOKSBURG
The stability of local community papers – 2 ROOTS surveys
2016 2019
87%
61%
9% 11%
5% 7% 6% 4%
Boksburg Advertiser Daily Sun Sunday Times Huisgenoot
* This graph reads: In ROOTS 2016, 61% of decision makers in Boksburg read their local paper – the Boksburg Advertiser, in 2019 this
figure has increased to 87% of decision makers in Boksburg read their local paper – the Boksburg Advertiser.
14SOME HIGHLIGHTS
03
#3 PEOPLE SHOP AT DIFFERENT TIMES OF THE MONTH
2013 2019
Implication:
56% Changes in behaviour
53%
Convenience is key
33% • Increase in no. of stores
30%
• Needs changing
12% opportunity
More 12% to get into people's
shopping 2%
baskets
2%
One bulk shop a month Twice a month/every two Weekly or almost weekly Twice a week or more
and some top-ups weeks
This graph reads: In ROOTS 2013, 56% of shoppers did one bulk shop a month & some top-ups and 30% did twice a month/ every two weeks.
In ROOTS 2019 these figures have changed to 53% of shoppers did one bulk shop a month & some top-ups and 33% did twice a month/ every
two weeks
Roots Spark Release 2019SOME HIGHLIGHTS
03
#4 ONLINE SHOPPING IS STILL IN ITS INFANCY
Airline tickets 11%
Holiday / accomodation 9%
Movie / theatre 9%
Clothes 8%
Food & Groceries 6%
Vitamins 5%
Toiletries 4%
This graph reads: In ROOTS 2019, 11% of decision makers bought airline tickets online
16SOME HIGHLIGHTS
03
#5 INTERESTING TOPLINE INFO
Banking: Cell phones:
VODA
ABSA FNB STD CAPI
MTN
NED COM CELL
20 BANK TEC BANK
17 40 38 C
2016 16 15 13 2016 15
VODA
ABSA CAPITEC NED-
21 FNB STD COM MTN CELL
21 BANK BANK 38 35 C Telkom
18
2019 2019
5
15 12 17
In ROOTS 2016, ABSA had a 20% share of people with a bank In ROOTS 2016, Vodacom had a 40% share of people
account. In ROOTS 2019, this has increased to 21%. with cell phone. In ROOTS 2019, it is 38%.
17SOME HIGHLIGHTS
03
#5 INTERESTING TOPLINE INFO
Clothes Shopping: Loyalty Cards:
Mr PnP Clicks
Edgars Smart
Price WW JET Club Edgars
WW
40 Shopper Thank U
40 32 23 Card 16
2016 2016 37 17
26
PnP Clicks
Mr Smart Club
Edgars Acker Edgars
Price WW
mans
Shopper
Card Thank
Disco
33 43 very
33 28 35 U
2019 20 2019 15 15
In ROOTS 2016, Edgars had a 40% share of people who shopped for In ROOTS 2016, PnP Smart Shopper had a 37% share of
clothes in the past 6 months. In ROOTS 2019, this decreased to 33%. people with loyalty card. In ROOTS 2019, it is 43%.
181. Credentials and Methodology
2. Highlights of the many categories
03
3. Buyer Behaviour DISCOVERIES
4. Media
5. Conclusion
BUYER BEHAVIOUR
& WHAT ROOTS REVEALS
SOME MAJOR DISCOVERIES FROM THIS ARCHITECTURE
19BUYER BEHAVIOUR
04
UNDERSTANDING BUYER BEHAVIOUR MATTERS BECAUSE
• We are all in the business of building brands
• We talk to potential buyers or users
• This works best when we understand what makes them tick
• And we can talk meaningfully
• And actually influence what they do
20BUYER BEHAVIOUR
04
BUYER BEHAVIOUR & WHAT ROOTS REVEALS
TODAY, in the interest of time
and relevance – we will examine
4 DISCOVERIES
• What ROOTS Reveals
• Anchored in Principles
21BUYER BEHAVIOUR
04
DISCOVERY #1
• LOYALTY – (probably the most important discovery)
• Humans are naturally curious & like choice.
22BUYER BEHAVIOUR
04
ROOTS REVEALS
PRINCIPLE
The detail per local
geographic areas
of who your
“Your consumers are
just somebody else’s
shoppers / users are consumers who
occasionally buy from
& who you share you”
your shoppers /
users with. Prof Andrew Ehrenberg
23BUYER BEHAVIOUR
04
A loyalty card program doesn’t make you ‘sharing immune’
Spar WW SANDTON
18% 40% Top F&G retailers:
1. PnP 76%
2. Checkers 40%
3. Woolworths 40%
PDM’S in Sandton who have 4. Spar 18%
a PnP loyalty card and (Base: F&G past month)
shopped for F&G at PnP
(67,000) in the past month,
Clicks also shopped at:
13% Checkers
F&V 58%
City/FLM
10%
24BUYER BEHAVIOUR
04
DISCOVERY #2
• Randomness – people behave randomly
25BUYER BEHAVIOUR
04
ROOTS REVEALS
We know there are people in
the market every week. But we PRINCIPLE
don’t know who they are or “Consumer
behaviour is random
how to reach them individually.
and unpredictable –
Markets are thin so look for high adjusted for our
mood or need at a
aggregate propensities / particular point in
time.”
clusters or catchment areas.
Prof Andrew Ehrenberg
26BUYER BEHAVIOUR
04
RANDOMNESS – PEOPLE SHOP FOR CLOTHES AT
DIFFERENT TIMES OF THE YEAR
2013 2016 2019
31 30 32 Implications:
30
Seasonality
26
25 25 Needs of shoes & clothing shoppers
22 22 Important to connect with shoppers
on a continuous basis
9
7 7 7 7
4 5 4
3
Once a month or Every 2 - 3 months Every 4 - 5 months Every 6 - 12 months Once a year Less than once a
more year
This graph reads: In ROOTS 2013, 7% of shoppers shopped for clothes once a month or more often. In 2016, this dropped to 4%
and in 2019, it is 3%.BUYER BEHAVIOUR
04
RANDOMNESS – HIGH PROPENSITIES
Looking at high indices
Interested in Food / Cooking / Baking: Interested in Home & Décor
• JHB North East • Rosebank
• Kimberley • Nelspruit
• Uitenhage • JHB North East
Buy wine (once a week or more often)
• Constantia / Plumstead / Hout Bay
• Plett / Knysna / Sedgefield
• Milnerton
Areas with a high propensity for an interest in Food / Cooking / Baking are JHB North East, Kimberley & Uitenhage
Areas with a high propensity for an interest in Home & Décor are Rosebank, Nelspruit & JHB North East
Areas with a high propensity for buying wine (once a week or more often) are Constantia / Plumstead / Hout Bay & Plett / Knysna / Sedgefield & MilnertonBUYER BEHAVIOUR
04
Soft Furnishings or Home accessories
(across all ROOTS Footprints) 29%
18%
13%
So much choice?
24,354 have bought soft furnishings or 11%
home accessories in the past week
97,417 have bought soft furnishings or home
accessories in the past month
10%
Now Edgars Home
1,169,000 (16%) shoppers have bought soft furnishings or home
accessories in the past 12 months
Of the 7,295,000 shoppers in the ROOTS survey
29BUYER BEHAVIOUR
04
Small electrical appliances in Midrand
35%
16%
14%
So much choice?
813 have bought small electrical 14%
appliances in the past week
3, 250 have bought small electrical appliances 14%
in the past month
39,000 (77%) shoppers have bought small electrical
appliances in the past 12 months
Of the 51,000 shoppers in Midrand
30BUYER BEHAVIOUR
04
DISCOVERY #3
• DECISION MAKING – People largely make
decisions intuitively.
31BUYER BEHAVIOUR
04
DISCOVERY #3
SYSTEM 1 SYSTEM 2
95% 5%
Fast / Impulsive Slow / Thoughtful
Unconscious / Instinctive Conscious / Deliberate
Automatic Effortful
Everyday decisions Complex decisions
Error prone Reliable
32BUYER BEHAVIOUR
04
ROOTS REVEALS
Measures mindshare or PRINCIPLE
mental availability.
Shows just how
competitive markets
“ We think much less than
are across categories ”
we think we think.
at a local level. Daniel Kahneman
And shows how Make it easy to buy &
customers are spoilt for easy to be thought
choice. of.
33BUYER BEHAVIOUR
04
COMPETITIVE MARKETS
Area by area your brands compete
For example: Medical Aids
Sandton
This graph reads: In ROOTS 2016, 27% of Sandton decision makers have a Discovery Medical Aid,
and in ROOTS 2019, 36% of Sandton decision makers have a Discovery Medical Aid.
34BUYER BEHAVIOUR
04
COMPETITIVE MARKETS
Area by area your brands compete
For example:
Takeaways (P4W)
Protea - Soweto
This graph reads: In ROOTS 2016, 73% of Protea, Soweto decision makers have bought takeaways from KFC in the past 4 weeks
and in ROOTS 2019, 72% of Protea, Sowet decision makers have bought takeaways from KFC in the past 4 weeks.
35BUYER BEHAVIOUR
04
DISCOVERY #4
• THE LOCAL IMPERATIVE –
• People choose to live (& shop) locally.
• In geographic areas that suit them & are
convenient to their life stages & lifestyles.
36BUYER BEHAVIOUR
04
ROOTS REVEALS
PRINCIPLE
Identify high incidence
areas for your users & Understand your
stores based on people shoppers/ users at a
with a likelihood to buy local level.
your category. Geo-segmentation is
your priority
segmentation tool.
37BUYER BEHAVIOUR
04
AVERAGE TIME PREPARED TO TRAVEL FOR…
Differs by category & by area
13 MINS 15 MINS 21 MINS
FOOD & GROCERIES A GOOD RESTAURANT BUYING A NEW CAR
20 MIN - DOBSONVILLE 20 MIN - GERMISTON 35 MIN – DIEPKLOOF
9 MIN – FAERIE 11 MIN
7 MIN -
GLEN UMHLANGA
AMANZIMTOTI
(TSHWANE)
In ROOTS 2019, the average time prepared to travel is 13 minutes to buy Food & Groceries, in Dobsonville shoppers are
prepared to travel 20 minutes to buy Food & Groceries. In Amanzimtoti shoppers are only prepared to travel 7 minutes to
buy Food & Groceries.
38BUYER BEHAVIOUR
04
CATCHMENT AREAS: MALL OF AFRICA
Midrand 26%
Sandton 11%
Randburg 6%
Fourways 6%
Centurion 4%
Glenvista /
Mondeor 4%
Roodepoort 4%
Kempton 3%
Ruimsig 3%
Southdale/
Turffontein 3%
This graph reads: Of the people who have shopped at Mall of Africa, in the past 3 months, 26% live in Midrand.
39BUYER BEHAVIOUR
04
CATCHMENT AREAS ARE LOCAL
EG: MIDRAND
Shopping centres visited before opening of MALL OF AFRICA (2016) and after (2019)
2016 2019
47%
75%
MIDRAND
41% 41%
CBD
Noordwyk
35% 35% Shopping CentreBUYER BEHAVIOUR
04
AREA PROFILES DIFFER
Age:16-34
Age:35-49
58% 48% 92%
Age: 50+
34 47 40 Indian
% % %
Coloured
76% 53% 50%
Black
SEM 8 -10
58% of Chatsworth are in SEM 8-10, 34% are 16-34 years old and 76% are Indian.BUYER BEHAVIOUR
04
COMPETING STORE PROFILES DON’T CHANGE SIGNIFICANTLY PER AREA
In Randburg, PNP shoppers look like Checkers, Spar & online shoppers
This graph reads: Of the shoppers in Randburg, 92% are in SEM 8-10, and 93% of the PnP shoppers in Randburg are in SEM 8-10
and 93% of the Checkers shoppers in Randburg are in SEM 8-10 and 91% of the Spar shoppers in Randburg are in SEM 8-10.
And 95% of the Online Grocery Shoppers in Randburg are in SEM 8-10.
42BUYER BEHAVIOUR
04
ROOTS OFFERS LOCAL FLAVOUR – WITH BREADTH
AND DEPTH Fourways
43% VS. 48% 54% VS. 15% 10% VS. 6%
Had a beauty Music concert Have a home
treatment or live event loan
39% VS. 26% 44% VS. 34% 3% VS. 1%
Been to gym Had a headache Got married
59% VS. 82% 62% VS. 25% 2% VS. 2%
Had hair done Flown - anywhere Had a baby
* VS Average for Large Metro'sBUYER BEHAVIOUR
BUYER BEHAVIOUR
04
#4 DISCOVERIES – A QUICK RECAP:
DISCOVERIES ROOTS REVEALS ROOTS REVEALS
1. Per local geographic areas, who 3. Measures mindshare or
1. LOYALTY your shoppers / users are & who mental availability.
you share your shoppers / users
with. 4. Identify high incidence areas
2. RANDOMNESS of people with a likelihood to
2. There are people in the market buy your category.
continuously. High aggregate
3. DECISION MAKING propensities / clusters or
catchment areas.
4. THE LOCAL IMPERATIVE
441. Credentials and Methodology
2. Highlights of the many categories
04
3. Buyer Behaviour DISCOVERIES
4. Media
5. Conclusion
MEDIA
4505
MEDIA
MARKETING COMMUNICATION (vs architecture)
MARKETING’S GOAL – INFLUENCING BUYER BEHAVIOUR
Mental
availability
Making it easy to be
thought of, by as many
+ Physical
availability
• Distribution
• Store location
people in as many buying
• Access
situations – as possible
• Easy to buy
4605
MEDIA
MARKETING COMMUNICATION (vs architecture)
Most of us here are focussed on media/channel selection,
Responsible for the creation / development of effective media
strategies
WARNING: USUALLY THE
MOST EXPENSIVE PART OF MARKETING & BRAND
BUILDING and THE MOST CRITICAL
4705
MEDIA
MARKETING COMMUNICATION (vs architecture)
Re-cap!
NO LOYALTY
To grow your brand :
Attract light + Non-users
They can be hard (and expensive) to reach and it’s even harder to get their
attention (as opposed to regular users/shoppers who notice you more easily)
4805
MEDIA
MARKETING COMMUNICATION (vs architecture)
Re-cap!
RANDOMNESS
AND…
We cannot predict who, when, or which of your products they will need
(at an individual level)
But the good news is that all these consumer insights have also given us a
better manual/framework to help make smarter media decisions
4905
MEDIA
MARKETING COMMUNICATION (vs architecture)
OVERALL GOAL:
MASS EFFECTIVE REACH
NOT Frequency, or tight targeting, or only
personalisation campaigns as we have been told
(this is based on “loyalty” and dare we say, not a very good
understanding of Buyer Behaviour)
5005
MEDIA
MARKETING COMMUNICATION (vs our architecture)
MAXIMISING QUALITY REACH IS THE NO. 1 PRIORITY
(not frequency)
“Not talking to enough potential buyers
is like building a cathedral in the desert”
– Hamish Priest
Evaluate against Effectiveness first (value) &
Efficiency second (price)
5105
MEDIA
MARKETING COMMUNICATION (vs architecture)
MASS EFFECTIVE (Quality) REACH
Mental
availability
1. Who
+ Physical
availability
5. Where
2. Why
3. How
4. When
5205
MEDIA
MARKETING COMMUNICATION (vs architecture)
MASS EFFECTIVE REACH
Large Relevant Audiences
1. WHO?
All category users/buyers/shoppers
Target the purchase NOT the person/profile
Brand segmentation is a marketing myth
5305
MEDIA
MARKETING COMMUNICATION (vs architecture)
ROOTS REVEALS: LARGE RELEVANT AUDIENCES.
Food & groceries in Randburg
Local papers are read by 5 x more food & grocery shoppers* than any other
print medium.
75%
5X 14% 6% 8%
Randburg Sun Sunday Times The Star Move
This reads:
75% of PDMs in Randburg who are wholly or partly responsible for food and grocery shopping read their local paper.
The best read weekly paper is the Sunday Times with 14%.
The best read Daily Paper is the The Star with 6%.
And the best read weekly magazines is Move with 8%.
* Wholly or partly responsible for food and grocery shopping 54MEDIA
MARKETING COMMUNICATION (vs architecture)
05
ROOTS REVEALS: LARGE RELEVANT AUDIENCES.
Shoes & clothing Eldorado Park
Local papers are read by 10 x more shoes & clothing shoppers* than any
other print medium.
10X
77% 8% 9% 1%
Eldorado Park Sunday Times Daily Sun Drum
Urban News
This reads:
77% of PDMs in Eldorado Park who bought shoes or clothing in the past 6 months read the Eldorado Park Urban News.
The best read weekly paper is the Sunday Times with 8%.
The best read Daily Paper is the Daily Sun with 9%.
And the best read weekly magazines is Drum with 1%.
* Bought shoes or clothing in the past 6 months 5505
MEDIA
MARKETING COMMUNICATION (vs architecture)
ROOTS REVEALS: LARGE RELEVANT AUDIENCES.
Motor vehicles in Pretoria East
Local papers are read by 5 x more car shoppers than any other print medium.
5X
74% 14% 10% 12%
Pretoria Record East Sunday World Pta News Move
This reads:
74% of PDMs in Pretoria East who bought a new or second hand car in eth past 12 months read their Pretoria Record East.
The best read weekly paper is the Sunday World with 14%.
The best read Daily Paper is the Pretoria News with 10%.
And the best read weekly magazine is Move with 12%.
* Bought a new or second hand car in the past 12 months. 5605
MEDIA
MARKETING COMMUNICATION (vs architecture)
MASS EFFECTIVE REACH
More likely to pay attention
2. WHY?
The reason for consuming the media type
Media environment must match the task orientation
57MEDIA vs ( our
05
MARKETING architecture) (vs our architecture)
COMMUNICATION
2. WHY?
• Readers use their local papers for planning their shopping.
• They prefer their inserts to be delivered in their local paper
Behaviour created over time!!
WHERE
& the consistent exposure does a really good job of branding as well.
.
58WHY
MARKETING COMMUNICATION (vs architecture)
05
PLANNING SHOPPING
88% 79% 62%
Of CT North prefer their inserts
delivered in their local paper
Of CT Southern Suburbs read the inserts
delivered in their local paper
Of Soweto use their local paper to
make F & G shopping decisionsMEDIA vs ( our
05
MARKETING architecture) (vs architecture)
COMMUNICATION
3. WHEN?
a) Continuity
Aim for weekly exposure
(NOT frequency!)
60MEDIA vs (our
05
MARKETING architecture)
COMMUNICATION (vs our architecture)
CONTINUITY In every 1 of the 52 weeks in a year,
people are in your category
“Catch them when they fall” – (trigger a response when they have a need)
?
Plan for weekly
exposure to
remind the ever-
? ? changing pool of
consumers who
are ready to buy
? ?
More likely to notice when “In Market”
61WHEN
MEDIA vs (our
05
MARKETING architecture)
COMMUNICATION (vs architecture)
3. WHEN?
+/-6.4 million
Local papers in the
market every week in SA
62MEDIA vs (our
05
MARKETING architecture)
COMMUNICATION (vs architecture)
3. WHEN? Cont.
b) Recency
exposure as close to the purchase occasion as possible
63MEDIA vs (our
05
MARKETING architecture)
COMMUNICATION (vs our architecture)
RECENCY
NEED PURCHASE OCCASION
AD
?
64WHEN
MARKETING COMMUNICATION (vs architecture)
05
Local papers mostly
distributed from
Wednesday - Friday
6505
MEDIA
MARKETING COMMUNICATION (vs architecture)
4. HOW?
Media that delivers large audiences first
(and quickly) = the foundation
Add niche/smaller options later if budget allows, but aim
for adding Reach not Frequency (duplication)
66MEDIA vs (our
05
MARKETING architecture)
COMMUNICATION (vs architecture)
HIGH REACH & LOW DUPLICATION
(Total 2019 sample)
4. HOW?
70% 69%
65%
18% 17%
5% 4%
Local All Dalies Combined Daily Daily adds All Weekly Combined Weekly Weekly adds
and Local and Local
This graph reads: Of all ROOTS respondents 65% read their local paper vs. 18% of all daily papers.
70% of decision makers read both a daily & a local paper. Only 5% read any daily newspaper and NOT a local paper.MEDIA vs (our
05
MARKETING architecture)
COMMUNICATION (vs architecture)
HIGH REACH & LOW DUPLICATION
ROODEPOORT
EG: Roodepoort
4. HOW?
83% 84% 84%
4% 5%
1% 1%
Roodepoort The Star Roodepoort The Star Adds Sunday Times Roodepoort Sunday Times
Record Record & The Star Record & Sunday Adds
combined Times combined
This graph reads: Of all Roodepoort decision makers, 83% read their local paper – Roodepoort Record vs. 1% who read The Star.
84% of decision makers read both The Star & the Roodepoort Record. Only 1% read The Star and NOT the Roodepoort Record.MEDIA vs (our
05
MARKETING architecture)
COMMUNICATION (vs architecture)
HIGH REACH & LOW DUPLICATION
(Total 2019 – internet)
4. HOW? 72%
65%
25%
7%
Local paper Any news site online Combined Local Paper & Any News site online adds
News Site Online
This graph reads: Of all ROOTS respondents 65% read their local paper vs. 25% who read news site online.
72% of decision makers read both their local paper and read news site online. Only 7% read news sites online and NOT a local paper.MEDIA
05
MEDIA
MARKETING COMMUNICATION (vs architecture)
HIGH REACH & LOW DUPLICATION
FOURWAYS
(vs internet) in FOURWAYS
4. HOW? 84%
70%
58%
14%
Local paper Any news online Combined Local Paper & Any Online adds
News Online
This graph reads: Of all ROOTS respondents 70% read their local paper vs. 58% who read any news site online.
84% of decision makers read both their local paper and read any news site online. Only 14% read any news sites online and NOT a local paper.MEDIA vs (our
05
MARKETING architecture)
COMMUNICATION (vs our architecture)
4. HOW?
Local newspapers reach such large relevant
audiences with a frequency of 1,
that it is inefficient or not necessary to add another
media type (with the same messaging).
71MARKETING
MEDIA COMMUNICATION (vs architecture)
05
MASS EFFECTIVE (Quality) REACH
Mental
availability
1. Who
+ Physical
availability
5. Where
2. Why
3. How
4. When
72MEDIA vs (our
05
MARKETING architecture)
COMMUNICATION (vs architecture)
5. WHERE?
Physical availability
a) High propensities
Fish where the fish are
73MARKETING COMMUNICATION (vs architecture)
05
5. WHERE?
a) High propensities
60% 72% 68% 72% 69%
Of people
Of monthly shoes Of people with
Of people who do Of people earning interested in food,
& clothing WIFI / ADSL @
gardening read R51,000+ PI read cooking or baking
shoppers read home read their
their local paper their local paper read their local
their local paper local paper
paper
Local papers = highest media reach per category
74MEDIA vs (our
05
MARKETING architecture)
COMMUNICATION (vs architecture)
5. WHERE?
Physical availability
b) Catchment areas
Location of stores or branches
75MEDIA
MARKETING COMMUNICATION (vs our architecture)
05
5. WHERE?
The real power of local / geography = relevance
ACCESSIBILITY
+
AVAILABILITY
76MARKETING
MEDIA COMMUNICATION (vs architecture)
05
5. WHERE?
People shop and live locally
EG: MIDRAND
2019
75%
73% Midrand Reporter ReadershipMEDIA vs (our
05
MARKETING architecture)
COMMUNICATION (vs architecture)
5. WHERE?
People shop and live locally
EG: ALBERTON CITY
2019
66%
76% Alberton Record ReadershipMEDIA vs (our
05
MARKETING architecture)
COMMUNICATION (vs architecture)
So it’s no surprise:
Local papers continue to thrive!
1. WHO? 2. WHY? 3. HOW? 4. WHEN? 5. WHERE?
Reaching large relevant audiences in an environment where people are
primed to pay attention to shopping / services advertising
79CONCLUSION
06
BUILDING FOR GROWTH
• We are very proud of our strong & profitable newspaper brands.
Our success is based on your support
We know that’s not because you ‘love us’ so much or want a relationship with us, but
because…
They consistently deliver your messages to the hard to find large relevant
audiences
…for the past 40 years
80CONCLUSION
06
OUR MEDIA BRANDS
We aim to follow the sage advice
and keep our brands
MENTALLY AVAILABLE & PHYSICALLY AVAILABLE
(known by almost all local residents) (distributed to the home – easily accessible)
We would love to keep partnering with you to do the same
81CONCLUSION
06
We are excited about the future of the local
paper media category!
So keep creating brands that stand out
Provide appropriate messaging to influence buyers
We are confident that we will continue to reach “the few” who do
care & are interested – at the right time
in as many weeks as possible, in the most effective & efficient way.
82THANK YOU
83You can also read