Investigation of diets associated with dilated cardiomyopathy in dogs using foodomics analysis
←
→
Page content transcription
If your browser does not render page correctly, please read the page content below

www.nature.com/scientificreports
OPEN Investigation of diets associated
with dilated cardiomyopathy
in dogs using foodomics analysis
Caren E. Smith1, Laurence D. Parnell2, Chao‑Qiang Lai2, John E. Rush3 & Lisa M. Freeman3*
Dilated cardiomyopathy (DCM) is a disease of the heart muscle that affects both humans and dogs.
Certain canine diets have been associated with DCM, but the diet-disease link is unexplained, and
novel methods are needed to elucidate mechanisms. We conducted metabolomic profiling of 9 diets
associated with canine DCM, containing ≥ 3 pulses, potatoes, or sweet potatoes as main ingredients,
and in the top 16 dog diet brands most frequently associated with canine DCM cases reported to
the FDA (3P/FDA diets), and 9 non-3P/FDA diets. We identified 88 named biochemical compounds
that were higher in 3P/FDA diets and 23 named compounds that were lower in 3P/FDA diets.
Amino acids, amino acid-derived compounds, and xenobiotics/plant compounds were the largest
categories of biochemicals that were higher in 3P/FDA diets. Random forest analyses identified
the top 30 compounds that distinguished the two diet groups with 100% predictive accuracy. Four
diet ingredients distinguished the two diet groups (peas, lentils, chicken/turkey, and rice). Of these
ingredients, peas showed the greatest association with higher concentrations of compounds in 3P/
FDA diets. Moreover, the current foodomics analyses highlight relationships between diet and DCM
in dogs that can identify possible etiologies for understanding diet-disease relationships in dogs and
humans.
Dilated cardiomyopathy (DCM) is a common, progressive, and “largely irreversible” heart disease affecting
humans1. Dilated cardiomyopathy is associated with left ventricular dilation and systolic dysfunction, and com-
monly leads to congestive heart failure or sudden death1,2. Dilated cardiomyopathy can result from both genetic
and environmental causes. Genetic mutations contribute to DCM in humans but known mutations are identified
in only 25–40% of those with familial DCM, reflecting substantial gaps in understanding of the causes of D CM3.
In addition, the natural history of DCM in humans is highly variable suggesting that environmental factors may
affect disease progression even in DCM with a genetic basis.
This disease does not only occur in humans; DCM is the second most common heart disease affecting pet
dogs, with prevalence over 50% in some breeds, such as the Doberman P inscher4–6. DCM in dogs, as in humans,
is a serious disease leading to congestive heart failure or sudden death, with survival times typically less than one
year after the onset of heart failure and significant echocardiographic improvement u nlikely5. Several genetic
mutations also have been associated with DCM in dogs but most dogs with canine DCM do not have a genetic
mutation identified7–11. Even in the Doberman Pinscher, in which two different mutations associated with DCM
have been identified, some dogs with DCM have a single mutation, some have both mutations, and some have
neither7–9. This variable genetic background and a highly variable disease progression, even in dogs with the
same mutation, also support a role for environmental factors in canine DCM.
In addition to genetic causes, DCM can also occur secondary to environmental causes such as direct
toxins (e.g., alcohol, chemotherapeutic agents, antibiotics, heavy metals), infectious agents, and nutritional
deficiencies12–14. Deficiencies of a variety of nutrients, such as thiamine, magnesium, choline, vitamin E and
selenium, have been associated with DCM in humans or animal m odels12,15–17. Deficiencies of two amino acid or
amino acid-related compounds also can cause a nutritional DCM. Taurine deficiency has been investigated exten-
sively in cats with DCM, where it is known to cause DCM that is reversible with taurine s upplementation18,19.
In dogs, the role of taurine in DCM is less clear but has been associated with DCM, particularly in certain
breeds20–35. Deficiency of L-carnitine, an amino acid-derived molecule, also has been implicated in DCM in dogs
1
Nutrition and Genomics Laboratory, Jean Mayer USDA Human Nutrition Research Center on Aging at Tufts
University, Boston, MA, USA. 2USDA Agricultural Research Service, Nutrition and Genomics Laboratory, Jean
Mayer USDA Human Nutrition Research Center on Aging at Tufts University, Boston, MA, USA. 3Department of
Clinical Sciences, Cummings School of Veterinary Medicine, Tufts University, North Grafton, MA, USA. *email:
Lisa.Freeman@Tufts.edu
Scientific Reports | (2021) 11:15881 | https://doi.org/10.1038/s41598-021-94464-2 1
Vol.:(0123456789)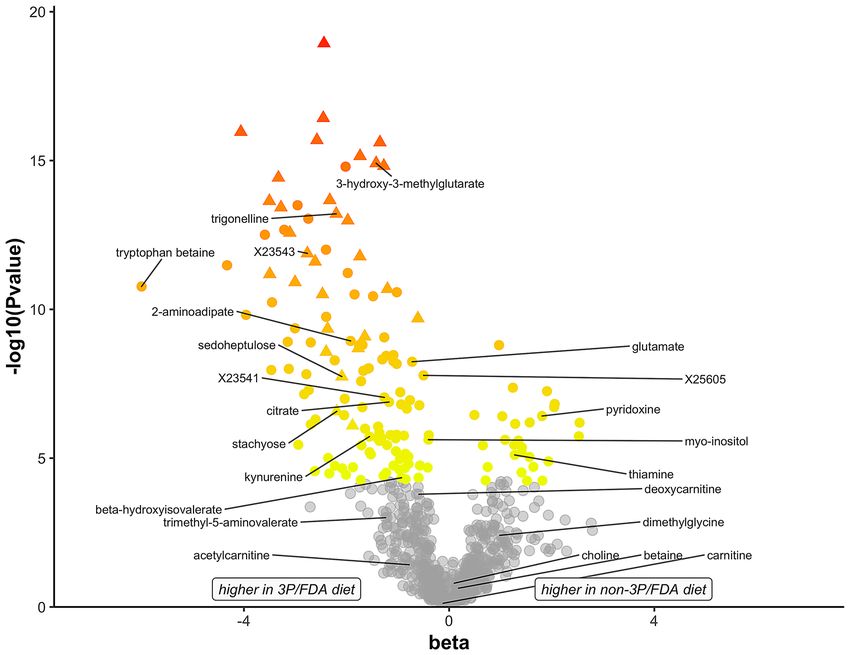
www.nature.com/scientificreports/
and humans36,37. Carnitine belongs to a chemical category of trimethylated quaternary amines and imines called
“betaines,” which have been identified in many foods and linked to human h ealth38,39.
Recent focus on the role of diet in DCM in dogs stems from veterinary reports and Food and Drug Admin-
istration (FDA) investigation of a potential link between certain diets and DCM in d ogs34,40–46. As of September,
47
2020, > 1100 dogs with DCM had been reported to the FDA . One of the unique characteristics about the dogs
with diet-associated DCM is their outcome. While DCM in dogs is usually a progressive disease with short sur-
vival times, multiple studies have shown that dogs with diet-associated DCM have significant echocardiographic
improvement and longer survival time after diet change and medical t reatment34,40,44–46. The diets reported to
be associated with DCM often are marketed as “grain-free” and often contain certain ingredients that became
part of commercial foods relatively recently (e.g., pulses, potatoes, and sweet potatoes) and lack others (such
as rice or corn). Most of the ingredients that are included in the associated diets are also found in human diets,
but dogs often eat them in even higher quantities because most dogs eat a single commercial pet food, rather
than a variable mixture of multiple foods as humans do. However, intake of certain pet food ingredients such as
pulses and tubers vary widely among human populations, and in some groups represent staple foods that provide
substantial sources of protein and energy. Despite ongoing research efforts, understanding of whether diet may
be involved in the observed DCM in dogs remains unclear. Standard nutritional analyses of the associated diets
have failed to identify a causative factor and so other, more novel approaches are needed.
One novel approach for studying relationships between diet and diseases is metabolomics, which meas-
ures small molecules that can identify biomarkers of disease or diet, as well as to help delineate mechanistic
pathways48,49. While metabolites are typically assessed in plasma or urine, this method can also be used to
compare the same biochemical compounds in foods50, where it has been referred to as “foodomics”51. Identify-
ing the biochemical distinguishers of diets associated with DCM in dogs and more traditional dog foods could
reveal possible biochemical compounds in food that are contributing to DCM in pet dogs, and also may help
to identify food ingredients and biochemical compounds that could play a role in human DCM as well. The
study’s primary objective, therefore, was to apply a metabolomics approach to identify biochemical compounds
that differ between commercial dog foods that have been associated with canine DCM and in more traditional
commercial dog foods.
Results
Biochemical compounds differ in two diet groups. A total of 830 biochemical compounds (665 of
known identity and 165 of unknown identity) were measured and compared in two diet groups. One group
(called 3P/FDA; n = 9) consisted of diets clinically associated with DCM in dogs, from the top 16 dog food
brands fed to dogs with DCM reported to the FDA, and contained ≥ 3 pulses, potatoes, or sweet potatoes in the
top 20 ingredients43. The comparison group (non-3P/FDA; n = 9) were diets not associated clinically with DCM
in dogs and did not meet the other criteria for the 3P/FDA diets.
Regression coefficients and the log10 P values from the 3P/FDA and non-3P/FDA diet comparison are plotted
to show the extent of chemical differences between the diet groups (Fig. 1). Named and unnamed compounds
with negative beta coefficients (n = 122, 81.9%) showed higher concentrations in the 3P/FDA diets, while named
and unnamed compounds with positive beta coefficients were lower in 3P/FDA diets (n = 27, 18.1%; Supple-
mental Table 1).
Of the compounds that were significantly higher in the 3P/FDA diet group, the largest categories of named
compounds were amino acid related (n = 24), and those classed as xenobiotics/plant compounds (n = 20; Table 1).
Other categories of compounds that were higher in the 3P/FDA diet group included lipids (n = 18), carbohydrates
(n = 7), energy metabolism (n = 6), cofactors and vitamins (n = 5), nucleotides (n = 5), and peptides (n = 3). A
large proportion of compounds that were higher in the 3P/FDA diet group were unnamed (n = 34; Supplemental
Table 1). Three of these unnamed compounds were detectable only in the 3P/FDA diet group (X-23541, X-23534,
and X-25605).
Of the compounds that were significantly lower in the 3P/FDA diet group, the largest category of named
compounds was cofactors and vitamins (n = 8). Other categories that were lower included xenobiotics/plant com-
pounds (n = 6), lipids (n = 5), amino acids (n = 3), and carbohydrates (n = 1). There were 4 unnamed compounds
that were lower in 3P/FDA diet group.
Using random forest analysis, a set of 30 biochemical compounds that distinguished the 3P/FDA and non-
3P/FDA diet groups was identified, yielding a predictive accuracy of 100%. Predictive ranks (1 to 30) reflect
the biochemical importance of each of these 30 compounds (Supplemental Table 1). Included among these
distinguishing compounds are amino acids, cofactors and vitamins, peptides, lipids, nucleotides, carbohydrates
(stachyose and sedoheptulose), and 14 unnamed compounds. As plotted in Fig. 1, all 30 compounds distinguish-
ing the two diet groups were higher in the 3P/FDA diet group.
Vitamins were lower in 3P/FDA diets. Seven of the 8 vitamins that were significantly lower in 3P/FDA
diets were B vitamins: pyridoxine (vitamin B6), thiamine (vitamin B1), folate (vitamin B9), pantothenate (vita-
min B5), and riboflavin (vitamin B2) were lower in 3P/FDA diets (Table 2).
Amino acids, amino acid derivatives, and plant‑derived compounds differ by diet group. As
indicated above, a number of amino acids and amino acid-related compounds differed significantly between 3P/
FDA and non-3P/FDA diets. Tryptophan betaine (525.21 fold), glutamate (1.96 fold), kynurenine (5.66 fold),
2-aminoadipate (6.72 fold; also called 2-aminoadipic acid), pipecolate (12.59 fold), N6,N6-dimethyllysine (4.26
fold), beta-hydroxyisovalerate (2.49 fold; also called 3-hydroxyisovaleric acid), and homoarginine (14.02 fold)
Scientific Reports | (2021) 11:15881 | https://doi.org/10.1038/s41598-021-94464-2 2
Vol:.(1234567890)www.nature.com/scientificreports/
Figure 1. Illustration of 830 biochemical compounds that were significantly different between diet groups.
Diets were assigned to one of two groups: (1) associated with clinical cases of dilated cardiomyopathy (DCM)
in dogs; containing ≥ 3 pulses, potatoes, or sweet potatoes in the top 20 ingredients; and in the top 16 dog food
brands named most frequently in DCM cases reported to the FDA (3P/FDA) or (2) not meeting the above
criteria (non-3P/FDA). The beta values, where a negative value denotes higher levels in the 3P/FDA diet group,
are plotted against the negative of log10(P value). Compounds plotted in gray have P values above the cutoff of
5.80E−05, and are considered as not statistically significantly different between diet groups. Triangles indicate
compounds that distinguish the two diet groups based on random forest analysis. Those compounds featured in
this manuscript are labeled.
were among those that were higher in the 3P/FDA diet group (Table 1). Taurine was not significantly different
between the diet groups.
Acetyl-D,L carnitine (the D isomer of carnitine; P = 0.038), gamma butyrobetaine (also called deoxycarnitine;
P = 0.0002), 5-aminovaleric acid betaine (also called N,N,N-trimethyl-5-aminovalerate; P = 0.001), and dimethyl
glycine (P = 0.004) were higher with nominal significance (P < 0.05) in the 3P/FDA diet group (Supplemental
Table 1). The plant-derived betaine compounds, trigonelline (N-methylnicotinic acid) and histidine betaine were
significantly higher in the 3P/FDA diets (7.76 fold and 8.30 fold, respectively; Table 1). Carnitine did not differ
significantly between the two diet groups.
Other metabolites of interest. Three additional compounds were also significantly higher in the 3P/
FDA diet group: 3-hydroxymethylglutaric acid, myo-inositol, and citrate (Supplemental Table 1).
Ingredients are associated with biochemical compound concentrations. Based on biochemical
compounds that differed between 3P/FDA and non-3P/FDA diets and differences in some ingredients across
diet groups, we reasoned that ingredients could be contributing to the biochemical differences. To investigate
ingredient-compound relationships, we first identified “distinguishing ingredients” that differed by five or more
dog food products when compared across 3P/FDA and non-3P/FDA diet groups. These four ingredients were
as follows: (1) peas (present in 9 3P/FDA diets and 4 non-3P/FDA diets), (2) lentils (present in 6 3P/FDA diets
and 1 non-3P/FDA diet), (3) chicken/turkey (present in 1 3P/FDA diet and 8 non-3P/FDA diets), and (4) rice
(present in 0 3P/FDA diets and 7 non-3P/FDA diets). In the current study, potatoes and sweet potatoes were
insufficiently represented in either diet type (present in 2 3P/FDA diets and in 1 non-3P/FDA diet) to evaluate.
The relationship between each of these four distinguishing ingredients (peas, lentils, chicken/turkey, and rice)
and the biochemical compounds that differed by diet group was visualized by plotting the log2 ratio of the mean
Scientific Reports | (2021) 11:15881 | https://doi.org/10.1038/s41598-021-94464-2 3
Vol.:(0123456789)www.nature.com/scientificreports/
Chemical or functional class Compound Fold Beta SE P
Amino Acids Diff
Alanine and aspartate metabolism Asparagine 2.88 − 1.024 0.177 1.63E−06
Glutamate metabolism Glutamate 1.96 − 0.721 0.094 5.76E−09
Glutathione metabolism Glutathione, oxidized (GSSG)1 11.20 − 2.612 0.246 2.49E−12
Leucine, isoleucine and valine 3-Methylglutaconate 3.04 − 1.086 0.138 3.43E−09
Leucine, isoleucine and valine Methylsuccinate 3.23 − 0.970 0.199 2.42E−05
Leucine, isoleucine and valine Beta-hydroxyisovalerate 2.49 − 0.929 0.199 4.54E−05
Lysine metabolism N6,N6-dimethyllysine1 4.26 − 1.646 0.196 8.19E−10
Lysine metabolism 2-Aminoadipate 6.72 − 1.920 0.232 1.15E−09
Lysine metabolism N6-methyllysine 5.55 − 1.639 0.276 1.02E−06L
Lysine metabolism N,N-dimethyl-5-aminovalerate 4.91 − 1.359 0.241 2.63E−06
Lysine metabolism 6-Oxopiperidine-2-carboxylate 2.48 − 0.855 0.162 7.13E−06
Lysine metabolism Hydroxy-N6,N6,N6-trimethyllysine2 2.62 − 0.847 0.183 5.11E−05
Lysine metabolism Pipecolate 12.59 − 1.723 0.373 5.38E−05
Methionine, cysteine, taurine Methionine sulfone 8.48 − 1.976 0.193 5.99E−12
Polyamine metabolism 4-Acetamidobutanoate 3.68 − 1.264 0.151 8.73E−10
Tryptophan metabolism Tryptophan betaine2 525.21 − 5.995 0.608 1.70E−11
Tryptophan metabolism Kynurenine 5.66 − 1.553 0.271 1.88E−06
Tyrosine metabolism Gentisate 4.56 − 1.527 0.289 7.46E−06
Urea cycle; arginine, proline Dimethylarginine (ADMA + SDMA)1 6.28 − 1.975 0.165 1.03E−13
Urea cycle; arginine, proline N-monomethylarginine1 4.88 − 1.740 0.161 1.66E−12
Urea cycle; arginine, proline Homoarginine 14.02 − 4.329 0.412 3.30E−12
Urea cycle; arginine, proline Homocitrulline 7.40 − 2.397 0.267 1.78E−10
Urea cycle; arginine, proline Argininate 1.81 − 0.570 0.114 1.77E−05
Urea cycle; arginine, proline N-delta-acetylornithine 17.60 − 2.010 0.423 3.60E−05
Xenobiotics/Plant compounds
Afromosin 47.15 − 2.358 0.454 9.81E−06
Formononetin 40.18 − 3.146 0.381 1.23E−09
Fucitol 6.43 − 1.586 0.211 9.89E−09
Galactarate (mucic acid) 10.32 − 2.231 0.288 5.18E−09
Gentisic acid-5-glucoside 7.04 − 2.604 0.421 5.03E−07
Histidine betaine (hercynine)2 8.30 − 2.400 0.218 9.88E−13
Hydroquinone beta-D-glucopyranoside 26.23 − 2.954 0.237 3.17E−14
3-Hydroxybenzoate 38.43 − 2.696 0.445 7.31E−07
4-Hydroxybenzoate 1.72 − 0.595 0.127 4.53E−05
Kaempferol 3-O-glucoside/galactoside 27.90 − 2.084 0.424 2.19E−05
Maltol 2.64 − 1.145 0.198 1.67E−06
Nicotianamine1 15.61 − 3.278 0.265 3.75E−14
Pheophorbide A 23.79 − 2.227 0.447 1.81E−05
Protocatechuic acid-3-glucoside 4.20 − 1.302 0.167 4.79E−09
Salicylate 13.53 − 1.874 0.379 2.01E−05
Salicylate-glucoside 44.15 − 3.125 0.416 9.99E−09
Soyasaponin I 5.41 − 2.736 0.394 5.15E−08
Sulfate 1.47 − 0.395 0.068 1.69E−06
Tartarate 45.77 − 3.959 0.439 1.53E−10
Trigonelline2 7.76 − 2.201 0.181 6.16E−14
Table 1. Biochemical compounds that were higher in the 3P/FDA diet group compared to the non-3P/FDA
diet group43. P value of 0.05/830 = 0.00006 was statistically significant. P reflects difference in concentration
between 3P/FDA and non-3P/FDA diet groups. Amino acids and xenobiotics/plant compounds are included
here. In all, 122 named and unnamed biochemical compounds were significantly higher in the 3P/FDA
diet group compared to the non-3P/FDA diet group. Complete list of compounds in Supplemental Table 1.
1
Member of 30 compound set determined by random forest analyses to distinguish the 3P/FDA and non-3P/
FDA diet groups. 2 Betainized compound.
Scientific Reports | (2021) 11:15881 | https://doi.org/10.1038/s41598-021-94464-2 4
Vol:.(1234567890)www.nature.com/scientificreports/
Chemical or functional class Compound Fold Beta SE P value
Cofactors and vitamins Diff
Folate metabolism Folate 0.15 1.419 0.260 4.36E−06
Nicotinate and nicotinamide metabolism Nicotinate 0.20 1.411 0.293 3.02E−05
Pantothenate and CoA metabolism Pantothenate 0.49 0.658 0.119 3.71E−06
Riboflavin metabolism Riboflavin 0.14 1.907 0.276 5.62E−08
Thiamine metabolism Thiamin 0.27 1.278 0.243 7.78E−06
Tocopherol metabolism Gamma-tocotrienol 0.11 1.935 0.380 1.28E−05
Vitamin B6 metabolism Pyridoxal 0.59 0.493 0.078 3.55E−07
Vitamin B6 metabolism Pyridoxine 0.20 1.812 0.289 3.83E−07
Xenobiotics/plant compounds
Deoxymugineic acid 0.28 1.091 0.193 2.42E−06
Feruloylquinate (1) 0.11 2.057 0.312 1.51E−07
Feruloylquinate (3) 0.22 1.349 0.239 2.57E−06
Feruloylquinate (4) 0.22 1.415 0.266 6.42E−06
1,1-Kestotetraose 0.06 2.529 0.440 1.84E−06
2-Oxindole-3-acetate 0.04 2.543 0.417 6.43E−07
Lipids
Galactosyl glycerolipids 1,2-dilinoleoyl-galactosylglycerol (18:2/18:2) 0.13 1.567 0.301 9.10E−06
Galactosyl glycerolipids 1-palmitoyl-galactosylglycerol (16:0) 0.12 1.818 0.396 5.71E−05
Galactosyl glycerolipids 1-linoleoyl-galactosylglycerol (18:2) 0.20 1.518 0.330 5.74E−05
Sphingolipid synthesis Phytosphingosine 0.26 1.243 0.177 4.28E−08
Sphingolipid synthesis Sphingadienine 0.16 2.047 0.315 1.92E−07
Amino acids
Tryptophan metabolism Indoleacetate 0.29 1.288 0.212 7.03E−07
Tryptophan metabolism Serotonin 0.20 1.642 0.331 1.96E−05
Tyrosine metabolism 1-Carboxyethyltyrosine 0.49 0.712 0.155 5.61E−05
Carbohydrate
Glycolysis, gluconeogenesis, and pyruvate metabo-
Glucose 0.30 1.268 0.230 3.57E−06
lism
Table 2. Biochemical compounds that were lower in the 3P/FDA diet group compared to the non-3P/FDA
diet group. P value of 0.05/830 = 0.00006 was statistically significant. P reflects difference in concentration
between 3P/FDA and non-3P/FDA diet groups. Complete list of compounds in Supplemental Table 1.
concentration of each compound at two ingredient rankings (absent versus high) against the P value representing
the difference between the two concentrations at the two ingredient rankings (Fig. 2).
Figure 2 illustrates the compounds that are higher and lower in the 3P/FDA diet group compared to the non-
3P/FDA diet group. Solid (filled) horizontal bars indicate a positive relationship between an ingredient and a
compound. When all four distinguishing ingredients are plotted (Fig. 2), the ingredient-compound relationship
for peas shows more solid bars for peas compared to the other ingredients, supporting the possibility that peas
contribute to higher concentrations of these biochemical compounds. In contrast to peas, rice and chicken/
turkey are associated primarily with open bars, indicating lower amounts of the compounds in association with
these ingredients. Compared to peas, ingredient-compound associations for lentils are fewer, but in a similar
direction as peas.
The last 21 compounds of Fig. 2 (beginning with indolacetate) illustrate the compounds that are lower (open
bars) in the 3P/FDA diet group compared to the non-3P/FDA diet group and their relationships to the same
four ingredients. Peas were associated with significantly negative ratios (i.e., lower concentrations of the com-
pound; open bars) for 20 compounds. Lentils are associated with lower concentrations of one compound that is
similarly associated with peas. Chicken/turkey and rice are both positively associated with compounds (9 and
19, respectively) that are lower in the 3P/FDA diet group.
These results suggest that peas represent the ingredient contributing the greatest differences between 3P/FDA
and non-3P/FDA diets, and that they are associated with higher concentrations of many compounds (88 named
biochemical compounds were significantly higher in the 3P/FDA group and 23 named biochemical compounds
that were significantly lower in the 3P/FDA group). Generally, compounds that were higher in the high pea diets
are lower in the high chicken/turkey or high rice diets.
Discussion
The current study identified a substantial number of biochemical differences in the 3P/FDA diets, which have
been associated with DCM in pet dogs, compared to non-3P/FDA d iets34,40–46. Most (81.9%) biochemical com-
pounds that differed between diet groups were higher in 3P/FDA diets compared to non-3P/FDA diets, and
Scientific Reports | (2021) 11:15881 | https://doi.org/10.1038/s41598-021-94464-2 5
Vol.:(0123456789)www.nature.com/scientificreports/
Scientific Reports | (2021) 11:15881 | https://doi.org/10.1038/s41598-021-94464-2 6
Vol:.(1234567890)www.nature.com/scientificreports/
◂Figure 2. Relationships between four key ingredients and biochemical compounds found to distinguish 3P/
FDA from non-3P/FDA diet groups. Panels illustrate the data as follows: (a) pea; (b) lentil; (c) chicken/turkey;
(d) rice. For each of four ingredients that distinguished 3P/FDA and non-3P/FDA diets (i.e., peas, lentils,
chicken/turkey, and rice), the mean level of each compound was compared between diets high versus absent
in each ingredient (e.g., diets high in peas compared to diets containing no peas). The P value is depicted
as − 1*(log10[P value]) on the x-axis. Solid (filled) bars indicate a significant positive correlation between
compound and ingredient (e.g., diets high in peas had significantly higher levels of a compound compared
to diets with no peas), while open bars indicate a significant negative correlation between compound and
ingredient. For relationships that do not meet statistical significance, no bar is plotted. Colors represent the
classification of the compounds: red, amino acids; orange, xenobiotics and plant-derived compounds; light
green, lipid; dark green, carbohydrate; cyan, cofactors and vitamins; blue, energy; violet, nucleotides; yellow,
peptide; gray, partially characterized; black, unnamed. The designation RF30 indicates a member of 30
compound set determined by random forest analyses to distinguish the 3P/FDA and non-3P/FDA diet groups.
four distinguishing ingredients, peas, lentils, chicken/turkey, and rice, which also differed across the diet groups,
appear to contribute to these differences. Peas and, to a lesser degree, lentils appear to be a possible primary
source for the biochemical compounds found to be significantly higher in 3P/FDA diets. While we cannot estab-
lish with certainty if any of these compounds and ingredients are causal for disease, the findings support peas
as a leading possible ingredient associated with diet-associated DCM in dogs. In general, diets containing peas
were commonly associated with compounds being higher in the 3P/FDA diets, rather than with compounds
that were lower or deficient in these diets.
One possible hypothesis regarding how the 3P/FDA diets may contribute to DCM posits that these diets could
be insufficient in key nutrients that lead to disease. With respect to nutrient insufficiency, several compounds that
are relevant to cardiac metabolism, including B vitamins and related compounds, were lower in 3P/FDA diets.
B vitamins are co-factors in numerous reactions relevant to cardiac metabolism. Because vitamins B6 and B12,
for example, are co-factors in carnitine and taurine synthesis (both of which are important for normal myocar-
dial function), a deficiency or insufficiency in B vitamins potentially could contribute to DCM52,53. B vitamins
are heat-sensitive, so the results could be related to the amount of B vitamins included in the formulations by
individual manufacturers and to levels remaining after extrusion. For example, a study of canned cat foods that
were all labeled as complete and balanced found that 12/90 of the diets were below the Association of American
Feed Control Officials minimums for thiamine. Pre- and post-manufacture storage conditions also could affect
B vitamin levels54. Taurine and carnitine, however, were not significantly different between the diet groups. Thia-
mine (vitamin B1) deficiency also can cause DCM d irectly12,55. Investigation of potential mechanisms related to
B vitamins will require additional analyses, including metabolomics studies in dogs with diet-associated DCM.
In contrast to the small number of compounds that were significantly lower in the 3P/FDA diet group, a
large set of biochemical compounds were higher. Within the set of compounds that was significantly higher, the
categories of amino acids, betaines, and xenobiotics/plant-based compounds are well represented. Although
nutrient deficiencies are more obviously suggested when dietary nutrients are lower, such as the B vitamins noted
above, deficiencies also can be created indirectly by excess or unbalanced food components that interfere with
the normal absorption of a nutrient in the gastrointestinal tract. For example, dietary fiber could alter the digest-
ibility and bioavailability of essential nutrients that appear to be adequately supplied in the diet, contributing to
a deficiency56. A particular nutrient also could appear to be adequate in the diet but it may not be bioavailable to
the animal in a particular form (e.g., organic vs. non-organic sources of zinc, copper oxide vs. copper sulfate)57,58.
Anti-nutritional factors naturally present in certain ingredients also could theoretically play a role, although most
should be inactivated by heat during the manufacturing process.
In the current study, the over-represented categories of amino-acid related compounds, betaines, and xeno-
biotics/plant-based compounds also could be contributing to deficiencies in molecules that are essential to heart
function, such as carnitine. Carnitine is critical in cardiac metabolism through its facilitation of the transport of
long chain fatty acids from the cytosol and across the mitochondrial inner membrane for beta-oxidation. Car-
nitine itself did not differ across the two diet groups, but other amino acid-related compounds that were higher
in the 3P/FDA diets could influence carnitine metabolism. Specifically, several compounds that were previously
shown to alter carnitine transport could affect carnitine bioavailability to cardiac tissue. The high affinity carnitine
transporter, primarily designated as SLC22A5 and formerly called OCTN2 (organic cation transporter novel
2), was identified and characterized over two decades a go59, and its connection to DCM described over the last
decade60. Grube et al. noted that OCTN2 expression in heart tissue was lower in human patients with DCM, and
that genetic variants of SLC22A5 caused heart failure through reduced uptake of carnitine. Several compounds
found to be higher in 3P/FDA diets in the current study have been demonstrated to reduce L-[3H] carnitine
transport into the myocardium through inhibition of the transporter59,61. These inhibitors include the D isomer
of carnitine, acetyl-D,L carnitine, gamma butyrobetaine (deoxycarnitine), choline, and b etaine59,61, and the first
two of these carnitine transport inhibitors were higher in 3P/FDA diets. A third compound, 5-aminovaleric
acid betaine (N,N,N-trimethyl-5-aminovalerate) was shown to inhibit beta-oxidation of fatty acids in mouse
cardiomyocytes, also through inhibition of the carnitine transporter40 and was also higher in 3P/FDA diets in
the current study. These findings support the possibility that 3P/FDA diets supply biochemical compounds that
limit carnitine bioavailability at the level of the mitochondria, interfering with fatty acid oxidation and reducing
the heart’s energy supply. Altogether, these relationships support one potential means by which 3P/FDA diets
contribute to DCM, although others are possible through various mechanisms that affect myocardial metabolism.
In addition to deficiencies, other possibilities through which the 3P/FDA diets could cause DCM are com-
pounds that have direct toxic effect on the myocardium. For example, plants such as almonds, fruits, and beans
Scientific Reports | (2021) 11:15881 | https://doi.org/10.1038/s41598-021-94464-2 7
Vol.:(0123456789)www.nature.com/scientificreports/
can release cyanide, which is c ardiotoxic62. In the current study, a large number of “unnamed” compounds dif-
fered between 3P/FDA and non-3P/FDA diets. Additional work is needed to identify them and any potential role
they may play in heart function. We are also unable to exclude the possibility that added or naturally occurring
chemicals (e.g., pesticides, mycotoxins, and heavy metals) are present as toxic contaminants in the foods, but
were not detected through metabolomics.
The current project focuses on small molecules in dog foods that have been associated with DCM, but at
least two relevant studies have assessed metabolites in samples of humans with and without DCM63,64. Because
many compounds are derived from foods and could affect disease risk without undergoing metabolic conversion,
findings from these previous studies are relevant to understanding diet-disease relationships. In these published
reports, six compounds were significantly higher in human DCM p atients63 or in humans with increased disease
64
severity : glutamic acid, 3-hydroxymethylglutaric acid, myo-inositol, 4-acetamidobutanoate, kynurenine, and
gamma-glutamylisoleucine. In the current study, all six of these compounds also were significantly higher in
the 3P/FDA diets compared to the non-3P/FDA diets. In contrast, higher levels of three compounds—3-hy-
droxyisovaleric acid (also called beta-hydroxyisovalerate), aminoadipic acid, and citric acid—were associated
with protection against DCM in human patients64. These three compounds were all higher in 3P/FDA (DCM-
associated) diets in the current study. These findings reinforce the need to follow up this foods-based research
in dogs and humans, including feeding studies in dogs with and without DCM, to understand the relationships
between foods, biochemical compounds, and heart disease in both species.
Although the primary objective of this metabolomics approach was to identify biochemical compounds that
distinguished 3P/FDA and non-3P/FDA diets, the impact of ingredients in contributing to these differences was
also of interest. Peas emerged as one ingredient that differed across the two diet groups, and was also positively
and strongly associated with many compounds that were higher in 3P/FDA foods. Several independent studies,
including dietary interventions that used metabolomics analyses, previously confirmed associations between
peas and several compounds (trigonelline, dimethylglycine, and tryptophan betaine) that our study identified
as higher in the 3P/FDA d iets65–67. Although trigonelline (nicotinic acid N-methylbetaine) can be classified as
a product of niacin (vitamin B3) metabolism in mammals, it also occurs in many plants67. Trigonelline was
identified as a marker of pea intake in a human feeding s tudy65. A second, randomized, crossover study in peo-
ple identified tryptophan betaine, trigonelline, and dimethylglycine as markers of legume i ntake66. It is unclear
whether any of these or other compounds found in high levels in peas could have negative effects on the heart
when fed in large amounts, but this warrants further investigation. Other compounds that distinguished 3P/FDA
and non-3P/FDA diet groups, such as the tetrasaccharide stachyose, are found in legumes but are not specific to
peas68,69. Previous reports on ingredients that contribute to DCM in dogs have implicated pulses in general or
specific pulses such as lentils or peas34,35,43,44. As of April 30, 2019, 89% of DCM-associated diets reported to the
FDA contained peas and 93% of diets contained peas or l entils43. In the current study, lentils were not as strongly
associated with compounds that were significantly different between diet groups although their patterns were
similar to those of peas. Our results do not support a role for other pulses (e.g., chickpeas), which were present
much less frequently than peas in the diets we analyzed, but additional research is warranted to fully evaluate
the associations with pulses other than peas.
Numerous limitations must be acknowledged. While 18 dog food products were analyzed (nine of each diet
group), the selection was based on diets that were associated with clinical cases of DCM seen by the authors.
All diets in the 3P/FDA group contained ≥ 3 pulses, potatoes, or sweet potatoes in the top 20 ingredients and
all were in the top 16 dog food brands named most frequently in DCM cases reported to the FDA43. However,
it is important to note that there was some subjectivity in the selection and the diets in both groups represent a
small number of products relative to all dog foods available in the US marketplace. Although informative, the
individual selections and even the diet categories may not be the optimal categorization and additional research
will continue to add to the knowledge base to refine the design of future studies and clinical recommendations.
It is possible that the causative or contributing factor(s) in the 3P/FDA diets was one of the many unnamed
compounds identified or a factor was not measured in the current metabolomic analysis. That only two food
samples were analyzed from each selected product, and not all samples were obtained from two different bags
of food. (i.e., in some cases, both samples were from a single bag) is another limitation. Some of the diet samples
were obtained directly from owners of dogs with DCM; most of these diets had been opened and stored for
variable periods of time, first by the owner and then by the investigators, so this could introduce variability and
could bias the 3P/FDA diets in having lower levels of certain nutrients that could degrade as a result of variable
storage conditions. In addition, the relative rank for each ingredient (absent, low, moderate, high) was based on
the ingredient’s position on the food label and was not based on quantitative data on the exact amount of peas or
other ingredients that are present in each individual product. Finally, all pea fractions (e.g., peas, pea protein, pea
starch, pea fiber) were classified in the same way and it is not yet known whether pea fractions have similar effects.
The current study used a metabolomics approach to foods (“foodomics”) to identify molecular and potential
ingredient sources that differentiate two diet groups reported to alter DCM risk in pet dogs. Biochemical com-
pounds that differed by diet group included amino-acid related compounds, carnitine-related molecules, the set
of methylated compounds referred to as betaines, and a variety of unnamed xenobiotics and plant compounds,
and we hypothesize that one or more of these compounds may contribute to DCM in dogs. The hypotheses
generated will require follow-up interventions with metabolomics in dogs to establish causality and provide
definitive diet-disease evidence. Finally, while this study focuses on a specific form of heart disease in dogs, it
demonstrates the usefulness of investigating relationships between biochemical compounds, food ingredients,
and diseases such as DCM.
Scientific Reports | (2021) 11:15881 | https://doi.org/10.1038/s41598-021-94464-2 8
Vol:.(1234567890)www.nature.com/scientificreports/
Methods
Biochemical analyses were limited to commercial dog foods. The project did not include any interaction with or
any experiments on vertebrate animals. All analyses were carried out in accordance with relevant guidelines and
regulations including validation by Clinical Laboratory Improvement Amendments (CLIA), ISO 9001certifica-
tion and accreditation by the College of American Pathologists and the New York State Department of Health
Clinical Laboratory.
Diets. Nine dry (extruded) dog foods that clinically appeared to be associated with DCM in pet dogs were
selected for analysis. These nine diets all contained at least three occurrences of pulses, potatoes, or sweet pota-
toes in the top 20 ingredients and were in the top 16 dog food brands fed to dogs with DCM reported to the FDA
in the agency’s update in June, 2019 (3P/FDA diets)43. In addition, nine dry dog foods that met World Small
Animal Veterinary Association r ecommendations70, were not, in the authors’ experience, associated clinically
with DCM in dogs, and did not meet the other criteria for the 3P/FDA diets were selected for analysis as con-
trols (Non-3P/FDA diets). Two samples from each product were obtained so that each product could be tested
in duplicate. Where possible, samples that were obtained directly from owners of dogs with DCM were used for
the analysis. For these diets, only a single bag of food was used and two samples from separate parts of the bag
were selected. Most of these diets had been opened by the owner and stored for variable periods of time, first by
the owner and then by the investigators. When diets being fed to individual dogs were not available, two new
bags from the same lot were purchased and one sample from each bag was collected for analysis. All samples
were labeled with a code so the identity was unknown to the laboratory. Samples were shipped overnight to a
commercial laboratory (Metabolon, Inc., Morrisville, NC).
Metabolomic analysis. Metabolic profiling of two samples from each of 18 dog food products was con-
ducted by Metabolon, Inc. using standardized methods. Biochemical compounds were quantified using ultra‐
high‐performance liquid chromatography–tandem mass spectroscopy and identified by comparison to a refer-
ence library of 4500 purified standards containing retention time, molecular weight, mass–charge ratio, and
mass spectroscopy spectral data. A total of 830 biochemical compounds were detected, identified, and met
quality control requirements according to standard protocols of the commercial laboratory. All identified com-
pounds, both named and unnamed, were included in the analyses.
Ingredient ranking. Diets’ ingredient lists varied both within and between diet groups (i.e., 3P/FDA and
non-3P/FDA). While some ingredients were present only in one diet group (for example, grains were present
only in the non-3P/FDA diet group), other ingredients were shared across both diet groups. Ingredient positions
on dog food labels, like human food labels, indicate relative amounts of each ingredient by weight. To facilitate
analyses of the relationships between ingredients and biochemical compounds, a relative rank for each ingredi-
ent (absent, low, moderate, high) was assigned by one of the authors (LMF, a veterinary nutritionist) based on
the ingredient’s position on the food label.
Identification of distinguishing ingredients. Dog foods included a variety of ingredients, with up to
57 ingredients in a single diet. When all the different ingredients across the 18 different diets were added, several
hundred ingredients were represented, some of which are contained only in a single food or a few foods, while
others were common within a diet group. We identified major distinguishing ingredients that differed by five or
more dog foods across the two diet groups. For example, rice was present in 7/9 non-3P/FDA diets and 0/9 3P/
FDA diets, yielding a difference (7–0) of 7. Mineral supplements and probiotics were excluded from ingredients
analysis. Ingredients that differed by five or more dog foods when compared across 3P/FDA and non-3P/FDA
diet groups were considered “distinguishing ingredients.”
Statistical analyses. Linear regression was used to assess associations between the 3P/FDA and non-3P/
FDA diet groups and the individual biochemical compounds present in the foods. A conservative Bonferroni
correction for 830 biochemical compounds was applied to determine statistical significance (0.05/830 = 0.00006).
P values < 0.05 and ≥ 0.00006 were considered to be nominally significant.
Random forest classification was applied to biochemical compounds in 3P/FDA and non-3P/FDA diets to
identify the top 30 compounds that yielded a predictive accuracy of 100%. These compounds were identified
through “importance” rank ordering that was generated through random permutation.
Analysis of the relationship between ingredients and biochemical compounds that differed significantly
between 3P/FDA and non-3P/FDA diets was assessed by pair-wise comparison of compounds when each of four
distinguishing ingredients was ‘absent’ compared to when each ingredient was ranked ‘high’. Statistical signifi-
cance for ingredient-compounds analyses was conservatively corrected by multiplying the number of compounds
tested by the number of ingredients tested (four). Specifically, for named compounds that were higher in 3P/
FDA foods (n = 88 compounds) the threshold P threshold was calculated as 0.05/(88 × 4) to yield P = 0.0001. For
named compounds that were lower in 3P/FDA foods (n = 23), the P threshold was calculated as 0.05/(23 × 4) to
yield P = 0.0005. Similar methods were applied for unnamed compounds. For unnamed compounds that were
higher in 3P/FDA foods (n = 34), the threshold P value was 0.0004 and for unnamed compounds that were lower
in 3P/FDA foods (n = 4), the threshold P value was 0.003. Statistical analyses for biochemical compounds and
ingredients were conducted in SAS 9.4.
Scientific Reports | (2021) 11:15881 | https://doi.org/10.1038/s41598-021-94464-2 9
Vol.:(0123456789)www.nature.com/scientificreports/
Data availability
The datasets generated during and/or analyzed during the current study are not publicly available due to ongoing
research but are available from the corresponding author on reasonable request.
Received: 29 January 2021; Accepted: 8 July 2021
References
1. Maron, B. J. et al., for the American Heart Association, Council on Clinical Cardiology, Heart Failure and Transplantation Com-
mittee, Quality of Care and Outcomes Research and Functional Genomics and Translational Biology Interdisciplinary Working
Groups, and Council on Epidemiology and Prevention groups. Contemporary definitions and classification of the cardiomyopa-
thies: an American Heart Association Scientific Statement from the Council on Clinical Cardiology, Heart Failure and Transplanta-
tion Committee; Quality of Care and Outcomes Research and Functional Genomics and Translational Biology Interdisciplinary
Working Groups; and Council on Epidemiology and Prevention. Circulation. 113, 1807–1816 (2006).
2. Japp, A. G., Gulati, A., Cook, S. A., Cowie, M. R. & Prasad, S. K. The diagnosis and evaluation of dilated cardiomyopathy. J. Am.
Coll. Cardiol. 67, 2996–3010 (2016).
3. Rosenbaum, A. N., Agre, K. E. & Pereira, N. L. Genetics of dilated cardiomyopathy: Practical implications for heart failure man-
agement. Nat. Rev. Cardiol. 17, 286–297 (2020).
4. Calvert, C. A. et al. Association between results of ambulatory electrocardiography and development of cardiomyopathy during
long-term follow-up of Doberman Pinschers. J. Am. Vet. Med. Assoc. 216, 34–39 (2000).
5. Martin, M. W. S., Stafford Johnson, M. J. & Celona, B. Canine dilated cardiomyopathy: A retrospective study of signalment, pres-
entation and clinical findings in 369 cases. J. Small Anim. Pract. 50, 23–29 (2009).
6. Wess, G. et al. Prevalence of dilated cardiomyopathy in Doberman Pinschers in various age groups. J. Vet. Intern. Med. 24, 533–538
(2010).
7. Meurs, K. M. et al. A splice site mutation in a gene encoding for PDK4, a mitochondrial protein, is associated with the development
of dilated cardiomyopathy in the Doberman pinscher. Hum. Genet. 131, 1319–1325 (2012).
8. Meurs, K. M. et al. Association of dilated cardiomyopathy with the striatin mutation genotype in boxer dogs. J. Vet. Intern. Med.
27, 1437–1440 (2013).
9. Meurs, K. M. et al. A missense variant in the titin gene in Doberman pinscher dogs with familial dilated cardiomyopathy and
sudden cardiac death. Hum. Genet. 138, 515–524 (2019).
10. Yost, O., Friedenberg, S. G., Jesty, S. A., Olby, N. J. & Meurs, K. M. The R9H phospholamban mutation is associated with highly
penetrant dilated cardiomyopathy and sudden death in a spontaneous canine model. Gene 697, 118–122 (2019).
11. Meurs, K. M. et al. Assessment of PDK4 and TTN gene variants in 48 Doberman Pinschers with dilated cardiomyopathy. J. Am.
Vet. Med. Assoc. 257, 1041–1044 (2020).
12. Van Vleet, J. F. & Ferrans, V. J. Myocardial diseases of animals. Am. J. Pathol. 124, 98–178 (1986).
13. Packer, M. Cobalt cardiomyopathy: A critical appraisal in light of a recent resurgence. Circ. Heart Fail. 9, e003604 (2016).
14. Weintraub, R. G., Semsarian, C. & Macdonald, P. Dilated cardiomyopathy. Lancet 390(10092), 400–414 (2017).
15. Reeves, W. C., Marcuard, S. P., Willis, S. E. & Movahed, A. Reversible cardiomyopathy due to selenium deficiency. J. Parent. Ent.
Nutr. 13, 663–665 (1989).
16. Li, R. K., Sole, M. J., Mickle, D. A., Schimmer, J. & Goldstein, D. Vitamin E and oxidative stress in the heart of the cardiomyopathic
syrian hamster. Free Radic. Biol. Med. 24, 252–258 (1998).
17. Freeman, L. M. & Rush, J. E. Nutrition and cardiomyopathy: Lessons from spontaneous animal models. Curr. Heart Fail. Rep. 4,
84–90 (2007).
18. Pion, P. D., Kittleson, M. D., Rogers, Q. R. & Morris, J. G. Myocardial failure in cats associated with low plasma taurine: A reversible
cardiomyopathy. Science 237, 764–768 (1987).
19. Pion, P. D., Kittleson, M. D., Thomas, W. P., Delellis, L. A. & Rogers, Q. R. Response of cats with dilated cardiomyopathy to taurine
supplementation. J. Am. Vet. Med. Assoc. 201, 275–284 (1992).
20. Kramer, G. A., Kittleson, M. D., Fox, P. R., Lewis, J. & Pion, P. D. Plasma taurine concentrations in normal dogs and in dogs with
heart disease. J. Vet. Intern. Med. 9, 253–258 (1995).
21. Kittleson, M. D., Keene, B., Pion, P. D. & Loyer, C. G. Results of the multicenter spaniel trial (MUST): Taurine- and carnitine-
responsive dilated cardiomyopathy in American cocker spaniels with decreased plasma taurine concentration. J. Vet. Intern. Med.
11, 204–211 (1997).
22. Pion, P. D., Sanderson, S. L. & Kittelson, M. D. The effectiveness of taurine and levocarnitine in dogs with heart disease. Vet. Clin.
North Am. Small Anim. Pract. 28, 1495–1514 (1998).
23. Freeman, L. M., Rush, J. E., Brown, D. J. & Roudebush, P. Relationship between circulating and dietary taurine concentrations in
dogs with dilated cardiomyopathy. Vet. Ther. 2, 370–378 (2001).
24. Sanderson, S. L. et al. Effects of dietary fat and L-carnitine on plasma and whole blood taurine concentrations and cardiac function
in healthy dogs fed protein-restricted diets. Am. J. Vet. Res. 62, 1616–1623 (2001).
25. Fascetti, A. J., Reed, J. R., Rogers, Q. R. & Backus, R. C. Taurine deficiency in dogs with dilated cardiomyopathy: 12 cases (1997–
2001). J. Am. Vet. Med. Assoc. 223, 1137–1141 (2003).
26. Backus, R. C. et al. Taurine deficiency in Newfoundlands fed commercially available complete and balanced diets. J. Am. Vet. Med.
Assoc. 223, 1130–1136 (2003).
27. Delaney, S. J., Kass, P. H., Rogers, Q. R. & Fascetti, A. J. Plasma and whole blood taurine in normal dogs of varying size fed com-
mercially prepared food. J. Anim. Physiol. Anim. Nutr. (Berl.) 87, 236–244 (2003).
28. Spitze, A. R., Wong, D. L., Rogers, Q. R. & Fascetti, A. J. Taurine concentrations in animal feed ingredients; cooking influences
taurine content. J. Anim. Physiol. Anim. Nutr. (Berl.) 87, 251–262 (2003).
29. Torres, C. L., Backus, R. C., Fascetti, A. J. & Rogers, Q. R. Taurine status in normal dogs fed a commercial diet associated with
taurine deficiency and dilated cardiomyopathy. J. Anim. Physiol. Anim. Nutr. (Berl.) 87, 359–372 (2003).
30. Belanger, M. C., Ouellet, M., Queney, G. & Moreau, M. Taurine-deficient dilated cardiomyopathy in a family of golden retrievers.
J. Am. Anim. Hosp. Assoc. 41, 284–291 (2005).
31. Backus, R. C. et al. Low plasma taurine concentration in Newfoundland dogs is associated with low plasma methionine and cyst(e)
ine concentrations and low taurine synthesis. J. Nutr. 136, 2525–2533 (2006).
32. Ko, K. S., Backus, R. C., Berg, J. R., Lame, M. W. & Rogers, Q. R. Differences in taurine synthesis rate among dogs relate to differ-
ences in their maintenance energy requirement. J. Nutr. 137, 1171–1175 (2007).
33. Gray, K. et al. The effect of 48-hour fasting on taurine status in healthy adult dogs. J. Anim. Physiol. Anim. Nutr. (Berl.) 100, 532–536
(2016).
34. Kaplan, J. L. et al. Taurine deficiency and dilated cardiomyopathy in Golden Retrievers fed commercial diets. PLoS ONE. 13,
e0209112 (2018).
Scientific Reports | (2021) 11:15881 | https://doi.org/10.1038/s41598-021-94464-2 10
Vol:.(1234567890)www.nature.com/scientificreports/
35. Ontiveros, E. S. et al. Development of plasma and whole blood taurine reference ranges and identification of dietary features associ-
ated with taurine deficiency and dilated cardiomyopathy in golden retrievers: A prospective, observational study. PLoS ONE. 15,
e0233206 (2020).
36. Keene, B. W. et al. Myocardial L-carnitine deficiency in a family of dogs with dilated cardiomyopathy. J. Am. Vet. Med. Assoc. 198,
647–650 (1991).
37. Rizos, I. Three-year survival of patients with heart failure caused by dilated cardiomyopathy and L-carnitine administration. Am.
Heart J. 139(2 Pt 3), S120–S123 (2000).
38. Kärkkäinen, O. et al. Whole grain intake associated molecule 5-aminovaleric acid, betaine decreases β-oxidation of fatty acids in
mouse cardiomyocytes. Sci. Rep. 8, 13036 (2018).
39. Millard, H. R. et al. Dietary choline and betaine; associations with subclinical markers of cardiovascular disease risk and incidence
of CVD, coronary heart disease and stroke: The Jackson Heart Study. Eur. J. Nutr. 57, 51–60 (2018).
40. Adin, D. et al. Echocardiographic phenotype of canine dilated cardiomyopathy differs based on diet type. J. Vet. Cardiol. 21, 1–9
(2019).
41. United States Food and Drug Administration. FDA investigating potential connections between diet and cases of canine heart
disease. https://www.fda.gov/animal-veterinary/cvm-updates/fda-investigating-potential-connection-between-diet-and-cases-
canine-heart-disease (July 12, 2018).
42. United States Food and Drug Administration. FDA provides update on investigation into potential connection between certain
diets and cases of canine heart disease. https://www.fda.gov/animal-veterinary/cvm-updates/fda-provides-update-investigation-
potential-connection-between-certain-diets-and-cases-canine-heart. February 19, 2019.
43. United States Food and Drug Administration. FDA provides third status report on investigation into potential connection between
certain diets and cases of canine heart disease. https://www.fda.gov/animal-veterinary/cvm-updates/fda-provides-third-status-
report-investigation-potential-connection-between-certain-diets-and-cases. June 27, 2019.
44. Freid, K. J. et al. Retrospective study of dilated cardiomyopathy in dogs. J. Vet. Intern. Med. 35(1), 58–67 (2021).
45. Jones J., Carey L., & Palmer L.A. FDA update on dilated cardiomyopathy: Fully and partially recovered cases. Scientific Forum
Exploring Causes of Dilated Cardiomyopathy in Dogs. https://www.ksvdl.org/resources/documents/dcm-forum/FDA_KSU-Scien
ce-Forum-slides_09-29-2020.pdf. September 29, 2020.
46. Walker A. L. et. al. Association of diet with clinical outcomes in dogs with dilated cardiomyopathy and congestive heart failure. J.
Vet. Cardiol. S1760–2734(21)00019–9 (2021). Online ahead of print.
47. Solomon, S. M. Opening remarks. Scientific Forum Exploring Causes of Dilated Cardiomyopathy in Dogs. http://www.ksvdl.org/
resources/documents/dcm-forum/DCM-Forum-SolomonOpening-Remarks.pdf. September 29, 2020.
48. Gibbons, H. & Brennan, L. Metabolomics as a tool in the identification of dietary biomarkers. Proc. Nutr. Soc. 76, 42–53 (2017).
49. Zhang, L. et al. Functional metabolomics characterizes a key role for N-acetylneuraminic acid in coronary artery diseases. Circula-
tion. 137, 1374–1390 (2018).
50. Kim, S., Kim, J., Yun, E. J. & Kim, K. H. Food metabolomics: From farm to human. Curr. Opin. Biotechnol. 37, 16–23 (2016).
51. Montero, L. & Herrero, M. Two-dimensional liquid chromatography approaches in foodomics - A review. Anal. Chim. Acta 1083,
1–18 (2019).
52. Dunn, W. A., Aronson, N. N. Jr. & Englard, S. The effects of 1-amino-D-proline on the production of carnitine from exogenous
protein-bound trimethyllysine by the perfused rat liver. J. Biol. Chem. 257, 7948–7951 (1982).
53. Roman-Garcia, P. et al. Vitamin B12-dependent taurine synthesis regulates growth and bone mass. J. Clin. Invest. 124, 2988–3002
(2014).
54. Markovich, J. E., Freeman, L. M. & Heinze, C. R. Analysis of thiamine concentrations in commercial canned foods formulated for
cats. J. Am. Vet. Med. Assoc. 244, 175–179 (2014).
55. DiNicolantonio, J. J., Niazi, A. K., Lavie, C. J., O’Keefe, J. H. & Ventura, H. O. Thiamine supplementation for the treatment of heart
failure: A review of the literature. Congest. Heart Fail. 19, 214–222 (2013).
56. Grundy, M. M. et al. Re-evaluation of the mechanisms of dietary fibre and implications for macronutrient bioaccessibility, diges-
tion and postprandial metabolism. Brit. J. Nutr. 116, 816–833 (2016).
57. Wedekind, K. J. & Lowry, S. R. Are organic zinc sources efficacious in puppies?. J. Nutr. 128, 2593S-2595S (1998).
58. National Research Council. Minerals. In: Nutrient Requirements of Dogs and Cats. 145–192 (National Academies Press, 2006).
59. Tamai, I. et al. Molecular and functional identification of sodium ion-dependent, high affinity human carnitine transporter OCTN2.
J. Biol. Chem. 273, 20378–20382 (1998).
60. Grube, M. et al. Selective regulation of Cardiac Organic Cation Transporter Novel Type 2 (OCTN2) in dilated cardiomyopathy.
Am. J. Pathol. 178, 2547–2559 (2011).
61. Wu, X. et al. Functional characteristics and tissue distribution pattern of organic cation transporter 2 (OCTN2), an organic cation/
carnitine transporter. J. Pharm. Exp. Ther. 290, 1482–1492 (1999).
62. Jones, D. A. Why are so many food plants cyanogenic?. Phytochemistry 47, 155–162 (1998).
63. Alexander, D., Lombardi, R., Rodriguez, G., Mitchell, M. M. & Marian, A. J. Metabolomic distinction and insights into the patho-
genesis of human primary dilated cardiomyopathy. Eur. J. Clin. Invest. 41, 527–538 (2011).
64. Verdonschot, J. A. J. et al. Metabolic profiling associates with disease severity in nonischemic dilated cardiomyopathy. J. Card. Fail.
26, 212–222 (2020).
65. Posma, J. M. et al. Integrated analytical and statistical two-dimensional spectroscopy strategy for metabolite identification: Appli-
cation to dietary biomarkers. Anal. Chem. 89, 3300–3309 (2017).
66. Madrid-Gambin, F. et al. Untargeted 1H NMR-based metabolomics analysis of urine and serum profiles after consumption of
lentils, chickpeas, and beans: An extended meal study to discover dietary biomarkers of pulses. J. Agric. Food Chem. 66, 6997–7005
(2018).
67. Mohamadi, N., Sharififar, F., Pournamdari, M. & Ansari, M. A review on biosynthesis, analytical techniques, and pharmacological
activities of trigonelline. J. Diet. Suppl. 15, 207–222 (2018).
68. Martin-Cabrejas, M. A. et al. Effect of industrial dehydration on the soluble carbohydrates and dietary fiber fractions in legumes.
J. Agric. Food Chem. 54, 7652–7657 (2006).
69. Njoumi, S., Josephe Amiot, M., Rochette, I., Bellagha, S. & Mousquet-Rivier, C. Soaking and cooking modify the alpha-galacto-
oligosaccharide and dietary fibre content in five Mediterranean legumes. Int. J. Food Sci. Nutr. 70, 551–561 (2019).
70. World Small Animal Veterinary Association Global Nutrition Committee. Guidelines on selecting pet foods. https://wsava.org/
wp-content/uploads/2021/04/Selecting-a-pet-food-for-your-pet-updated-2021_WSAVA-Global-Nutrition-Toolkit.pdf.
Acknowledgements
This work was funded in part by Nestlé Purina PetCare and the Barkley Fund. This work was funded in part by
United States Department of Agriculture project number 8050-51000-107-00D, and this entity had no part in the
design of the experiments, in the collection, analysis and interpretation of data, nor in composing the manuscript.
Mention of trade names or commercial products in this publication is solely for the purpose of providing specific
Scientific Reports | (2021) 11:15881 | https://doi.org/10.1038/s41598-021-94464-2 11
Vol.:(0123456789)You can also read