The gut mycobiome of healthy mice is shaped by the environment and correlates with metabolic outcomes in response to diet - Doctaris
←
→
Page content transcription
If your browser does not render page correctly, please read the page content below

ARTICLE
                  https://doi.org/10.1038/s42003-021-01820-z                OPEN

                  The gut mycobiome of healthy mice is shaped by
                  the environment and correlates with metabolic
                  outcomes in response to diet
                  Tahliyah S. Mims1,9, Qusai Al Abdallah1,9, Justin D. Stewart 2,3, Sydney P. Watts1, Catrina T. White1,
                  Thomas V. Rousselle4, Ankush Gosain 5, Amandeep Bajwa4, Joan C. Han1,6, Kent A. Willis 1,7,9 ✉ &
                  Joseph F. Pierre 1,8,9 ✉

                  As an active interface between the host and their diet, the gut microbiota influences host
1234567890():,;

                  metabolic adaptation; however, the contributions of fungi have been overlooked. Here, we
                  investigate whether variations in gut mycobiome abundance and composition correlate with
                  key features of host metabolism. We obtained animals from four commercial sources in
                  parallel to test if differing starting mycobiomes can shape host adaptation in response to
                  processed diets. We show that the gut mycobiome of healthy mice is shaped by the envir-
                  onment, including diet, and significantly correlates with metabolic outcomes. We demon-
                  strate that exposure to processed diet leads to persistent differences in fungal communities
                  that significantly associate with differential deposition of body mass in male mice compared
                  to mice fed standardized diet. Fat deposition in the liver, transcriptional adaptation of
                  metabolically active tissues and serum metabolic biomarker levels are linked with alterations
                  in fungal community diversity and composition. Specifically, variation in fungi from the genera
                  Thermomyces and Saccharomyces most strongly associate with metabolic disturbance and
                  weight gain. These data suggest that host–microbe metabolic interactions may be influenced
                  by variability in the mycobiome. This work highlights the potential significance of the gut
                  mycobiome in health and has implications for human and experimental metabolic studies.

                  1 Department of Pediatrics, College of Medicine, The University of Tennessee Health Science Center, Memphis, TN, USA. 2 Department of Geography and the

                  Environment, Villanova University, Radnor, PA, USA. 3 Department of Ecological Science, Vrije Universiteit Amsterdam, Amsterdam, The Netherlands.
                  4 Department of Surgery, Transplant Research Institute, James D. Eason Transplant Institute, College of Medicine, The University of Tennessee Health

                  Science Center, Memphis, TN, USA. 5 Division of Pediatric Surgery, Department of Surgery, College of Medicine, The University of Tennessee Health Science
                  Center, Memphis, TN, USA. 6 Department of Physiology, College of Medicine, The University of Tennessee Health Science Center, Memphis, TN, USA.
                  7 Division of Neonatology, Department of Pediatrics, College of Medicine, The University of Alabama at Birmingham, Birmingham, AL, USA. 8 Department of

                  Microbiology, Immunology and Biochemistry, College of Medicine, The University of Tennessee Health Science Center, Memphis, TN, USA. 9These authors
                  contributed equally: Tahliyah S. Mims, Qusai Al Abdallah, Kent A. Willis, Joseph F. Pierre. ✉email: kwillis@peds.uab.edu; jpierre1@uthsc.edu

                  COMMUNICATIONS BIOLOGY | (2021)4:281 | https://doi.org/10.1038/s42003-021-01820-z | www.nature.com/commsbio                                            1
ARTICLE                                                                COMMUNICATIONS BIOLOGY | https://doi.org/10.1038/s42003-021-01820-z

T
        he modern diet is dominated by processed sugar and                   organisms detected by next-generation sequencing represent
        carbohydrates that are linked to metabolic and immune-               organisms present in the diet or true commensal colonization
        mediated diseases1. Disruption of the gut microbiome also            by organisms replicating within the gut lumen. Therefore, we
influences the development of metabolic disease2,3, and dietary               sequenced the food pellets that arrived with the mice from their
composition is a key driver of gut microbial community structure             respective vendors as well as the standardized chow and pro-
and function1. Gut microbes form an interface between the diet               cessed diets that the mice were fed in our experiments. In addi-
and the host, participate in digestion and energy extraction from            tion, we detected no consistent environmental or procedural
otherwise indigestible fiber and oligosaccharides4, produce short-            contamination in our sequencing controls, where Fusarium was
chain fatty acids and novel metabolites, and ultimately shape host           detected at low levels in some samples. On arrival, diets from the
endocrine and immune signaling. Given these findings, robust                  vendors showed similar fungal (Supplementary Fig. 1) and multi-
microbial communities appear crucial component to metabolic                  kingdom microbial composition (Supplementary Fig. 2), distinct
homeostasis as supported by data across diverse species, life                from the experimental diets and different from jejunal microbial
stages, and disease states2,5.                                               communities of arriving animals, suggesting the ITS DNA
   While the gut microbiome is often equated to bacteria,                    detected in food was introduced during food manufacturing and
microbial communities contain diverse populations of archaea,                not representative of viable organisms or major source of fungi
viruses, protists, and fungi6. Collectively termed the mycobiome,            identified within the gut.
gut fungal communities of molds and yeasts are crucial to
maintaining gut homeostasis and systemic immunity7. Mounting
                                                                             Gut fungal communities cluster by vendor. The gut bacterial
evidence suggests other domains of life, such as viruses, can also
                                                                             communities of experimental mice differ markedly by ven-
influence host metabolic tone8. However, data describing the role
                                                                             dor18. This variability has been utilized to understand the
of the mycobiome in host metabolism remain scarce9,10. Recent
                                                                             interrelatedness of gut and lung microbiota19 and standardize
studies in humans and mice indicate commensal fungi have the
                                                                             microbiota for genetic studies20. We tested to what extent the
potential to influence host metabolism directly7,11–14 and via
                                                                             vendor-induced variability in gut bacterial communities held
alterations to bacterial community composition15,16. The latter
                                                                             true for gut fungal communities. Upon arrival from the vendor,
interactions between bacteria and fungi are likely to yield greater
                                                                             the gut fungal communities of healthy laboratory mice from
insight into the complex microbial gut ecology and health.
                                                                             each vendor were distinct (p = 0.001, R2 = 0.211, permuta-
   The role of the gut mycobiome in host metabolism remains
                                                                             tional multivariate analysis of variance, PERMANOVA; p =
unresolved. This question is further obscured by the difficulty in
                                                                             0.575, permutational multivariate analysis of dispersion,
discriminating environmental and transiently ingested fungi from
                                                                             PERMDISP2), with a unique composition (p = 0.001, f = 1.1;
true colonizers, especially in free-living and genetically heterogeneous
                                                                             canonical correspondence analysis, CCA), despite similar
human populations. Thus, we designed a study using specific
                                                                             diversity (p = 0.53, f = 0.77; ANOVA Chao1 Index, Fig. 1a–f).
pathogen-free mice with the same genetic background so that we
                                                                             Across the four vendors, a core mycobiome of 18 genera was
could control for age, sex, and previous founder exposures. We also
                                                                             identified. An additional 14 genera were identified in animals
sourced these mice from four different vendors to vary their initial
                                                                             from multiple vendors. Mice from JAX hosted the most unique
gut mycobiomes. Utilizing this design, we tested our hypothesis that
                                                                             genera (5: Rasamsonia, Mycosphaerella, Millerozyma, Geos-
the gut mycobiome would associate with host metabolic response to
                                                                             mithia, and Byssochlamys) followed closely by TAC (Bipolaris,
a processed diet, which is representative of typical westernized diets.
                                                                             Hanseniaspora, and Tritirachium), then CR (Lichtheimia and
   First, we found the gut mycobiome of laboratory mice differs
                                                                             Dioszegia), while only one genus (Plectosphaerella) was unique
dramatically between animal vendors. Using a combinatory
                                                                             to animals from ENV (Supplementary Fig. 3). Interkingdom
approach, we then identified fungal populations that shifted in
                                                                             community composition was also analyzed, supporting large
response to processed diet and identified key fungal taxa that may
                                                                             baseline community differences by vendor driven by unique
be linked to host metabolic alterations. We show baseline cor-
                                                                             bacterial (Supplementary Fig. 4).
relations in the gut mycobiome strongly associate with changes in
host adiposity and serum metabolic biomarkers in response to a
highly processed low-fat diet. Our results support the role of the           Gut fungal community diversity declines with age and expo-
gut mycobiome in host metabolic adaptation and have important                sure to standard diet. Data on longitudinal trends in gut
implications regarding the design of microbiome studies and the              mycobiome development are lacking. After we determined gut
reproducibility of experimental studies of host metabolism.                  fungal communities in mice differed by their initial environment,
                                                                             we asked how these communities changed in a different envir-
                                                                             onment. To determine the temporal dynamics of the gut myco-
Results
                                                                             biome, we exposed mice with the same genetic background from
To determine if the gut mycobiome altered host metabolism, we
                                                                             different vendors to the same standardized chow diet and
studied 72 mice obtained in one shipment each from four vendors
                                                                             microenvironment for 8 weeks (Fig. 1a). While highly variable,
[Charles River Laboratories (CR), Envigo (ENV), The Jackson
                                                                             the complexity of the gut microbial populations generally declines
Laboratory (JAX), and Taconic Biosciences (TAC)]. We char-
                                                                             with maturity21–23, a finding we confirmed here in fungal
acterized the fungal and bacterial communities of the jejunum,
                                                                             populations. Community diversity declined in all animals
the most diverse fungal population in the mouse gut10. We
                                                                             exposed to standardized diet (p = 1.4 × 10⁻⁵, f = 7.4; Chao1
quantified fungal communities using ITS2 rDNA gene sequen-
                                                                             Index, Fig. 1b). Community composition similarly converged
cing, the most reliable culture-independent technique for
                                                                             with time, resulting in more similar, less complex, but still distinct
detecting mammalian-associated fungi17. For fungi, we obtained
                                                                             fungal communities (p = 0.341, R2 = 0.127; PERMANOVA. p =
1,121,549 total ITS2 reads, with an average of 11,104 reads per
                                                                             0.215; PERMDISP2, Fig. 1c. p = 0.001, f = 1.08; CCA, Fig. 1d).
sample. For bacteria, we obtained 1,502,041 total 16S reads, with
                                                                             Supervised partial least squares discriminant analysis confirmed
an average of 14,582 reads per sample.
                                                                             key operational taxonomic units driving differences in commu-
                                                                             nity composition primarily result from loss of unique taxa
Interkingdom composition of murine diets. A fundamental                      (Fig. 1e, f). In general, fungal community differences between the
question of gut mycobiome research is the extent to which fungal             vendors converged, resulting in communities with overall similar

2                          COMMUNICATIONS BIOLOGY | (2021)4:281 | https://doi.org/10.1038/s42003-021-01820-z | www.nature.com/commsbio
COMMUNICATIONS BIOLOGY | https://doi.org/10.1038/s42003-021-01820-z                                                                                        ARTICLE

Fig. 1 Gut fungal communities cluster by vendor, age, and dietary exposure. a Experimental schematic. b Compared to healthy mice exposed to a
standardized chow diet for 8 weeks, baseline community diversity is higher in mice upon delivery from vendors. While gut fungal communities remained
distinctly clustered by vendor, exposure to a standardized chow diet for 8 weeks exerted a convergent effect on community composition (c, d Bray–Curtis
dissimilarity distance). Supervised partial least squares discriminant analysis (e) and linear discriminant analysis of effect size (f) confirm key operational
taxonomic units and genera driving differences in community composition. Hypothesis testing was performed using ANOVA (b), PERMANOVA (c), and
CCA (d). CCA canonical correspondence analysis, OTUs operational taxonomic units, SD standard diet, PERMANOVA permutational multivariate
ANOVA, PCoA principal coordinates analysis. Schematic created using BioRender.com.

diversity and more similar community composition. A reduced
core of 12 shared fungal genera remained, with animals from CR                    Table 1 Determinants of microbial community composition
and Tac being the most divergent (Supplementary Fig. 5). As                       in healthy mice.
previously reported, bacterial communities vary by vendor18, con-
sistent with our findings. In contrast to decreased fungal diversity,              Variable      Fungal                                    Bacterial
bacterial diversity increased after 8 weeks of standard diet, and                               Likelihood ratio    test†   P-value‡      Likelihood ratio test†      P-value‡
beta diversity remained distinct (Supplementary Fig. 6 and                        Vendor        237.9                       0.153         874.5                       0.032
Table 1). Bacterial changes were identified in the genus S247,                     Diet          132.5                       0.004         843.5                       0.001
                                                                                  Sex           159.5                       0.036         288.8                       0.756
Adlercreutzia, and Desulfovibrio in response to the standard chow                 Timepoint     252.3                       0.001         333.3                       0.007
diet. Given independent shifts in fungal and bacterial commu-
                                                                                  †The likelihood ratio test quantifies the goodness-of-fit between generalized linear models
nities, we then investigated temporal dynamics of fungal and
                                                                                  (mvabund).
bacterial communities by building a series of generalized linear                  ‡P-values were estimated using parametric bootstrapping with 999 permutations.

models using mvabund that revealed fungal and bacteria com-
munities differ by diet and timepoint (Table 1 and Supplementary
Fig. 7). Community diversity decreased with time, leading to 5
taxa being selected against and only one taxon, Aspergillus, per-               and therefore susceptible to environmental influences. Collective
sisting. In contrast, bacterial communities differed by vendor but              interkingdom changes are reported in Supplementary Fig. 8,
not sex. From these analyses, we conclude jejunal fungal com-                   which were driven by shifts in the genus S247, Clostridiales, and
munities are indeed dynamic, selected by dietary intervention,                  Desulfovibrio.

COMMUNICATIONS BIOLOGY | (2021)4:281 | https://doi.org/10.1038/s42003-021-01820-z | www.nature.com/commsbio                                                                   3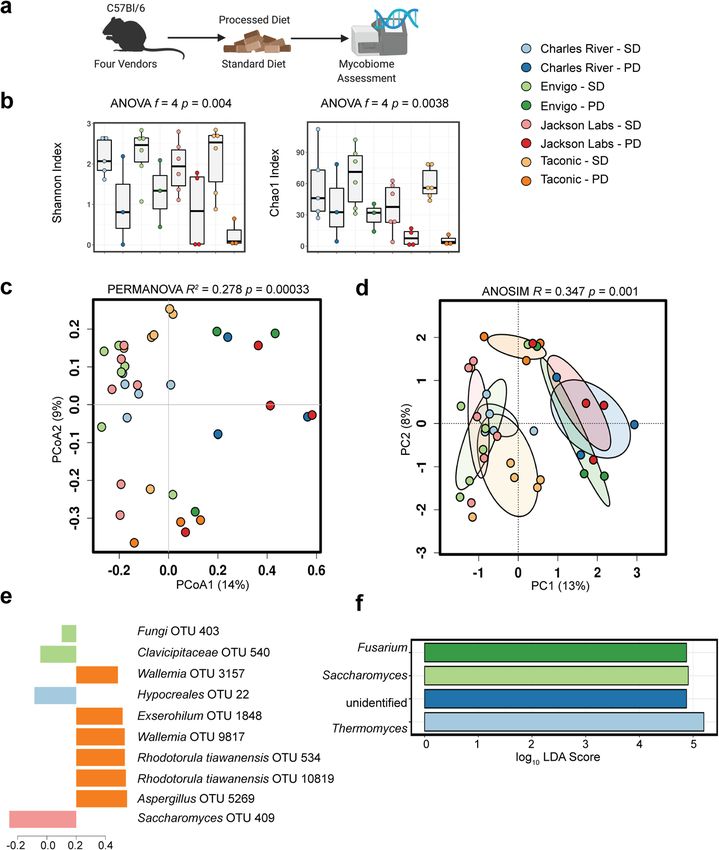
ARTICLE                                                                  COMMUNICATIONS BIOLOGY | https://doi.org/10.1038/s42003-021-01820-z

Fig. 2 Exposure to processed diet produces a more pronounced alteration of gut fungal communities than does exposure to standardized chow.
a Experimental schematic. b Compared to healthy mice exposed to a standardized chow diet for 8 weeks, mice exposed to a processed diet show reduced
community diversity. While gut fungal communities remained distinctly clustered by vendor, exposure to processed diet for 8 weeks exerted a convergent
effect on community composition that exceeded the similar effect of standardized chow (c, d Bray–Curtis dissimilarity distance). Supervised partial least
squares discriminant analysis (e) and linear discriminant analysis of effect size (f) confirm key operational taxonomic units and genera driving differences
in community composition. Hypothesis testing was performed using ANOVA (b), PERMANOVA (c), and ANOSIM (d). ANOSIM analysis of similarities,
CCA canonical correspondence analysis, OTUs operational taxonomic units, LDA linear discriminant analysis, PERMANOVA permutational multivariate
ANOVA, PD processed diet, PCA principal components analysis, PCoA principal coordinates analysis, SD standard diet. Schematic created using
BioRender.com.

Gut fungal community composition changes on exposure to                        convergence of microbial communities that were no longer dis-
processed diet. We demonstrated that environmental differences                 tinct by PERMANOVA and had similar overall diversity
between gut fungal communities converged after exposure to a                   (Supplementary Fig. 9 and Table 1). Nonetheless, more sensitive
standardized diet and environment (Fig. 1). Given that gut bac-                generalized linear modeling identified significant differences
terial communities are influenced by diet24, we sought to                       before and after exposure to a processed diet (p = 0.001,
understand how the mycobiome was shaped by exposure to a                       mvabund, Table 1). We analyzed shifts in bacterial-specific
processed diet. To address this question, we exposed the second                community composition alone following 8 weeks of the processed
group of mice from the same vendors to a processed diet for                    diet. Similar to fungi, a processed diet significantly reduced the
8 weeks. Compared to baseline, the community diversity of fungal               alpha diversity of bacterial communities (Supplementary Fig. 10).
communities declined after exposure to processed diet (p =                     The processed diet also resulted in unique shifts across beta
0.0038, f = 4; ANOVA, Chao1 Index, Fig. 2a). The community                     diversity explained by principal coordinate analysis axis 1 without
composition was also markedly different (p = 0.00033, R2 =                     community convergence observed in fungal populations and
0.278; PERMANOVA, Fig. 2b. p = 0.001, R = 0.347; analysis of                   greater vendor-specific changes remained. Interkingdom com-
similarities (ANOSIM), Fig. 2c, d, p = 0.004, mvabund, Table 1).               munity analysis supported these bacterial-specific differences,
Specific differences were detected by supervised partial least                  collectively suggesting the fungal community is more uniquely
squares discriminant analysis (Fig. 2e) and linear discriminant                selected by the environment and dietary intake compared with
analysis of effect size (Fig. 2f). This change resulted in a                   bacteria (Supplementary Fig. 11).

4                            COMMUNICATIONS BIOLOGY | (2021)4:281 | https://doi.org/10.1038/s42003-021-01820-z | www.nature.com/commsbio
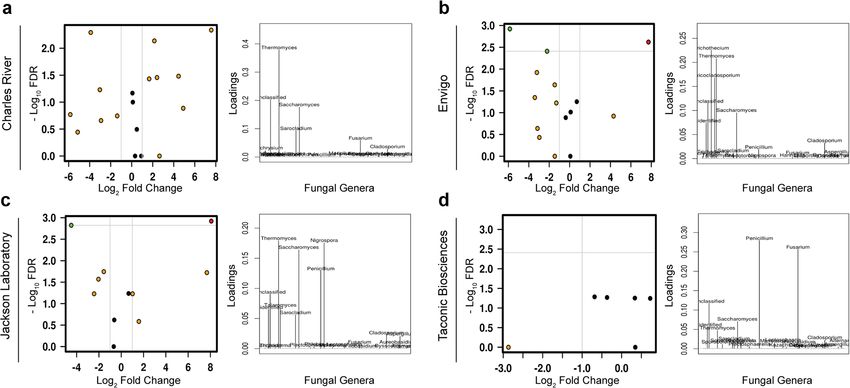
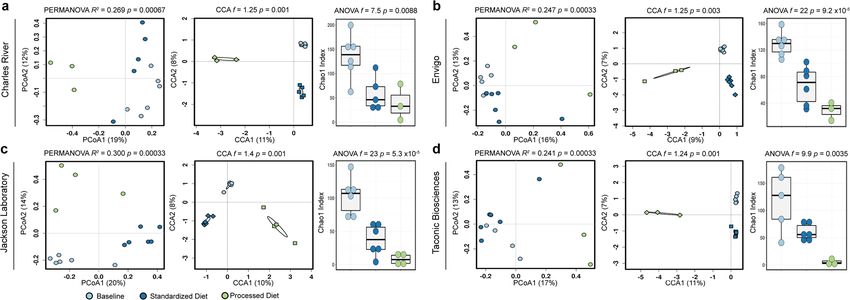
COMMUNICATIONS BIOLOGY | https://doi.org/10.1038/s42003-021-01820-z                                                                         ARTICLE

Fig. 3 Baseline fungal composition influences final community composition. Differences in fungal community composition and diversity present on arrival
from the four laboratory mouse vendors lead to persistent differences in the composition and diversity of fungal communities (a–d). Hypothesis testing for
community composition was performed using permutational multivariate ANOVA and canonical correspondence analysis of Hellinger transformed
Bray–Curtis dissimilarity distances and community diversity by ANOVA of the Chao1 index. CCA canonical correspondence analysis, OTUs operational
taxonomic units, PERMANOVA permutational multivariate ANOVA, PCoA principal coordinates analysis.

Fig. 4 Differences among animals sourced from different vendors persist after exposure to processed diet. Volcano plots of mixed-effect regression
identify differences between animals exposed to a processed diet that are highlighted by loading plots of discriminant analysis of principal components (a–d).
FDR false discovery rate.

Gut fungal community composition differs between standard                       Differences in fungal community composition persist despite
and processed diet. We next asked how the fungal communities                    exposure to processed diet. To identify differences between
in mice exposed to processed diet differed from mice exposed to a               vendors after exposure to processed diet versus standardized
standardized chow diet. While a similar overall trend in reduction              chow, we utilized a series of complementary approaches,
in diversity and separation of multivariate clustering can be seen              including analysis of the composition of microbiomes (ANCOM),
in all animals, differences between the community composition of                mixed-effect regression and discriminant analysis of principal
each vendor remained (Fig. 3a–d). The diversity of animals from                 components. In animals from JAX, the most robust changes were
TAC and JAX was the most reduced, with CR having the most                       a reduction in the genus Saccharomyces and corresponding bloom
retained diversity. The clear divergence of processed diet exposed              in Thermomyces, while animals from ENV demonstrated only the
animals is also apparent on multivariate analyses (p = 0.01, f =                reduction in Saccharomyces and animals from CR the bloom in
1.08; CCA, Fig. 3a–d). The shared core microbiome previously                    Thermomyces. Animals from TAC showed the opposite effect:
observed at baseline or after exposure to standardized chow                     Thermomyces, which was already at low levels in animals exposed
collapsed with only one genus, Aspergillus, shared between all                  to a standard diet, was eliminated after exposure to processed
groups. Animals from CR had the most retained diversity, with                   diet, as was the genus Penicillium (Fig. 4a–d). Furthermore,
the noteworthy unique prevalence of the genera Candida and                      generalized linear modeling identified three specific taxa across
Aureobasidium (Supplementary Fig. 9).                                           taxonomic resolution that were associated with exposure to the

COMMUNICATIONS BIOLOGY | (2021)4:281 | https://doi.org/10.1038/s42003-021-01820-z | www.nature.com/commsbio                                                 5
ARTICLE                                                                  COMMUNICATIONS BIOLOGY | https://doi.org/10.1038/s42003-021-01820-z

Fig. 5 Interkingdom co-occurrence differs by vendor, diet, and time. The 14 most abundant taxa are displayed (comprising > 99.2% of variability). The
color indicates the strength of Bonferroni corrected Spearman’s rho correlation coefficients. The x axis comprises fungal taxa with bacteria on the y axis.
Complete co-occurrence networks are shown in Supplementary Fig. 11.

processed diet: the orders Helotiales (p < 0.001) and Sacchar-                 Metabolic tone is strongly associated with variability in the gut
omycetales (p = 0.049) and the genus Wallemia (p = 0.014,                      mycobiome. To understand if the mycobiome was associated
Supplementary Fig. 9).                                                         with differences in metabolic tone, we performed correlation
                                                                               analysis using the relative abundance of fungal genera and
                                                                               community diversity metrics with metabolic biomarkers (Bicon-
Exposure to processed diet reduces fungi-associated co-occur-                  jugate A-Orthogonal Residual, Spearman correlations with Bon-
rence networks. While overall interkingdom co-occurrence pat-                  ferroni correction, Fig. 7a). Resistin and PIA-1 (plasminogen
terns among taxa did not significantly differ after exposure to the             activator inhibitor-1) were negatively correlated, while and fat
processed diet (p = 0.3438, t-test; Fig. 5), there was a noticeable            mass accrual was positively correlated with the presence of several
reduction in the number and magnitude of co-occurrent rela-                    key fungi. We further explored the relationship between fungal
tionships. This reduction was largely attributed to changes in four            community composition and metabolic tone by building random
fungal taxa (Helotiales, Trichothecium, Toxicocladosporium, and                forest machine learning models and performing variable impor-
Filobasidium).                                                                 tance analysis to identify key fungal taxa (Fig. 7b). We developed
                                                                               robust models for three metabolic outcomes that explain a sizable
                                                                               portion of the data variability. Differences in weight gain mod-
Gut fungal community composition correlates with differences                   erately correlated with differences in particular fungal taxa, of
in body composition and fat deposition. Having established                     which the abundance and distribution of the genus Thermomyces
persistent differences in fungal community composition, we next                were the most important. The most robust model was for serum
asked if these changes altered host metabolic tone. Because female             triglyceride concentration, for which the genus Cladosporium was
mice are protected from diet-induced obesity25, we focused on                  the most important taxa. Similarly, the genera Saccharomyces
male mice (for results from female mice, see Supplementary                     and Aspergillus were important for our model of fasting
Fig. 12). On the processed diet, with body composition quantified               ghrelin concentration. Altogether, these results suggest fungal
by EchoMRI and verified by tissue collection, male mice from CR,                community composition is strongly associated with host meta-
ENV and JAX gained fat mass, but mice from TAC did not                         bolic tone.
(Fig. 6a–c). Utilizing an unbiased panel, we examined differences
in serum metabolic biomarkers after a 5-h fast. Increases in                   Discussion
fasting leptin and ghrelin and decreases in fasting resistin                   Here, we investigated whether variations in gut mycobiome
appropriately correlated with increased adiposity (Fig. 6d). While             relative abundance and composition correlate with key features of
we were unable to detect lipid deposits in mice exposed to                     host metabolism. This question drives towards understanding the
standardized diet, we noted complementary differences in hepatic               complex interkingdom interactions between bacteria and fungi
steatosis (Fig. 6e, f), a marker of metabolic syndrome in mice24,              and how they are both collectively shaped and potentially con-
especially in mice from ENV. Gut bacteria can influence host                    tribute to host homeostasis. To address this question, we asked if
gene expression in animal studies24, so we also examined gene                  differing starting mycobiomes could affect host adaptation to a
expression in metabolically active tissues to test if this was also            standardized diet and an ultra-processed diet rich in purified
true for fungi. In epidydimal white adipose tissue, differences                carbohydrates in a manner that associated with deleterious
between vendors were noted in Prdm16 (PR/SET domain 16,                        metabolic outcomes. Our key findings are that the gut myco-
Fig. 6g). In the liver, key differences were noted in Ppara (Per-              biome of healthy mice is shaped by the environment, including
oxisome Proliferator Activated Receptor Alpha) family, Nr1h4                   diet, and significantly correlates with metabolic changes in the
(FXR, Farnesoid X Receptor), Cd36 (CD36, cluster of differ-                    host. For instance, increased triglyceride concentrations and
entiation receptor 36), Clec7a (Dectin-1), and Agapat1 (GPAT1,                 metabolic biomarkers, including the deposition of hepatic lipids,
Glycerol-3-Phosphate Acyltransferase 1, Fig. 6h).                              correlate with increased abundance of the fungal genera

6                            COMMUNICATIONS BIOLOGY | (2021)4:281 | https://doi.org/10.1038/s42003-021-01820-z | www.nature.com/commsbio
COMMUNICATIONS BIOLOGY | https://doi.org/10.1038/s42003-021-01820-z                                                                        ARTICLE

Fig. 6 The metabolic phenotype of male mice is sensitive to gut fungal community composition. a Experimental schematic. b Male mouse body
composition by EchoMRI. c Male mouse body composition by tissue collection. d Male serum metabolically active biomarkers. e Hematoxylin and eosin-
stained liver tissue show increased deposition after a processed diet, particularly in mice from Envigo. f Quantification of lipid deposition in males exposed
to processed diet. g Gene expression in eWAT under processed diet. h Gene expression in liver. eWAT epididymal white adipose tissue, PD processed diet,
SD standard diet. Schematic created using BioRender.com.

Thermomyces and decreased Saccharomyces. Our results highlight                  However, despite evidence for fungal pattern recognition recep-
the potential importance of the gut mycobiome in health and                     tors in the human gut7 and fungal influences on the disease in the
have implications for human and experimental metabolic studies.                 human gut27,28, continuous gut colonization by fungi remains
  The bacterial microbiome is strongly influenced by dietary                     controversial in humans29. Convincing evidence indicates fungi
exposure26 and influences host metabolism3. Emerging work                        colonize the mouse gut and influence host physiology30 and
demonstrates dietary exposure also shapes fungal communities9.                  disease31. Diet may have a dominant effect over host genotype on

COMMUNICATIONS BIOLOGY | (2021)4:281 | https://doi.org/10.1038/s42003-021-01820-z | www.nature.com/commsbio                                                7
ARTICLE                                                                  COMMUNICATIONS BIOLOGY | https://doi.org/10.1038/s42003-021-01820-z

Fig. 7 Fungal genera strongly associate with metabolic tone. a Biconjugate A-Orthogonal Residual method. X indicates p < 0.05 after false discovery rate
correction. b Random forest regression models showing the relative importance of a particular taxon to the model. PIA-1 plasminogen activator inhibitor-1,
R2 correlation coefficient, RMSE root mean square error.

the composition of the gut bacteriome with subsequent altera-                  influenced by the presence of mannan in fungal cell walls16.
tions in host-microbe interactions32. We observed a similar                    Similarly, fungal chitin influences the composition of anaerobic
strong effect of diet on the composition of both fungal and                    bacteria33. Our co-occurrence correlation analysis suggests the
interkingdom community composition. However, because we                        loss of key fungi during dietary exposure was closely related to
used mice with the same genetic background, we were able to                    differences in bacterial community composition, which may
examine the impact of the founding microbial communities lar-                  represent niche replacement in the face of a shifting dietary
gely independent of host genomic influences. In our study, both                 environment or disruption of interkingdom metabolomic net-
prolonged exposure to a processed diet and length of isolation in              works. This study extends the previous work9 in two important
a specific pathogen-free environment reduced fungal diversity. In               avenues. First, we examined the impact of a highly-processed diet
turn, reduced fungal diversity was associated with increased                   on gut communities. This approach allowed us to identify more
adiposity and physiologic alterations seen in the metabolic                    subtle physiologic changes in host metabolic tone. Second, by
syndrome.                                                                      using mice from different vendors, we extended these observa-
   In our controlled study, we found key differences in baseline               tions by observing the effect of different founding mycobiomes on
mycobiome composition reflect differences in metabolic tone in                  host metabolism.
response to diet. For metabolic studies in mice, the choice of                    Among the myriad metabolites and effectors that likely con-
vendor, shipment, diet, and housing may have instrumental roles                nect gut microbial communities to metabolism, the gut bacter-
in shaping outcomes, which should encourage further caution in                 iome may influence host metabolism through several major
drawing causative relationships. Validating outcomes in mice                   mechanisms34. While classically attributed to bacteria, fungi have
from several vendors or across multiple shipments may be                       an often underappreciated role in the production of metabolites
necessary to address this potential confounder. The implication                and may interact with host physiology via analogous
for human microbiome studies, which often examine only bac-                    mechanisms.
teria and sample only fecal communities, is that the mycobiome                    One of the best-known fungal pattern recognition receptors in
may have unappreciated effects on microbiome-associated                        humans is Dectin-1 (CLEC7A), which recognizes fungal β-glucan.
outcomes.                                                                      In addition to immune cells7, adipose tissue expresses Dectin-135.
   Exposure to a high-fat diet may alter fungal and interkingdom               In humans, obesity is associated with increased Dectin-1
community composition9. Our work suggests complex alterations                  expression in adipose tissue35. In mice, Dectin-1 (Clec7a) has a
in co-abundance networks are associated with diet. Fungal cell                 MyD88-independent role in diet-induced obesity35. In MyD88-
wall components are a major point of interaction between fungi                 deficient adipose tissue, Dectin-1 was upregulated in both adi-
and bacteria in the environment7. For example, the abundance of                pocytes and adipose-associated macrophages. Furthermore,
a major gut bacteria, Bacteroides thetaiotaomicron, can be                     blockade of Dectin-1 led to improved glucose sensitivity and

8                            COMMUNICATIONS BIOLOGY | (2021)4:281 | https://doi.org/10.1038/s42003-021-01820-z | www.nature.com/commsbio
COMMUNICATIONS BIOLOGY | https://doi.org/10.1038/s42003-021-01820-z                                                                               ARTICLE

                                                                                 Mice. This study was approved by the University of Tennessee Health Science
 Table 2 Experimental diet composition.
                                                                                 Center Intuitional Animal Care and Use Committee. Eight-week-old specific
                                                                                 pathogen-free C57Bl/6 mice of both sexes were purchased from Charles River
 Dietary components       Chow diet                 Processed diet               Laboratories (CR, Wilmington, MA), Envigo (ENV, Indianapolis, IN), Taconic
                          (Envigo 7912)             (research diets              Biosciences (TAC, Rensselaer, NY), and Jackson Laboratories (JAX, Bar Harbor,
                                                    D12450B)                     ME). Mice were maintained in microisolators to prevent contamination. On
                                                                                 arrival, 6 mice from each vendor were humanely euthanized, and jejunal contents
 Protein                  19.1% kcal                20% kcal                     were collected to quantify the baseline mycobiome. The remaining 12 mice/group
 Fat                      5.8% kcal                 10% kcal                     were randomized to chow (Envigo 7912) or purified processed (Research Diets Inc.
 Carbohydrate             44.3% kcal                70% kcal                     D12450B, New Brunswick, NJ) diet (Table 2) and monitored biweekly for 8 weeks
 Fiber                    4.6%                      –                            to quantify food intake and body composition. Jejunal contents were collected to
 Neutral                  13.7%                     –                            quantify the microbial communities at the end of the experiment. Details regarding
                                                                                 exposure, housing, tissue collection, and sample processing are detailed in the
 detergent fiber                                                                  online supplement. Animals were housed in sterile microisolators upon arrival in
 Minerals                 4%                        4.74%                        the same room under a standard 12-h light-dark cycle.
 Energy density           3.1 kcal/g                2.82 kcal/g
                                                                                 Fungal and bacterial ribosomal RNA extraction. Microbial DNA was extracted
                                                                                 using lyticase and proteinase K, amplified, and sequenced according to our pre-
decreased numbers of CD11c+ macrophages. The reverse was                         viously published protocols45. Sequencing was performed using the MiSeq platform
also true in Dectin-1 activation35. We also observed differences in              (Illumina, San Diego, CA) for both the 16 S and the internal transcribed spacer
Clec7a expression in the liver that correlated with differences in               region 2 (ITS2) ribosomal (r)DNA genes at the Argonne National Laboratory
adiposity. This may suggest that mycobiome-driven antigen-                       (Lemont, IL). Murine jejunal luminal samples were resuspended in 500 mL TNES
                                                                                 buffer containing 200 units lyticase and 100 mL 0.1/0.5 (50/50 Vol.) zirconia beads.
presenting cell education in the gut could directly influence sys-                Incubation was performed for 20 min at 37 °C. Following mechanical disruption
temic metabolic tone.                                                            using ultra-high-speed bead beating, 20 mg proteinase K was added to all samples,
   Another important function of gut microbes, often attributed                  which were incubated overnight at 55 °C with agitation. Total DNA was extracted
solely to bacteria, is the production of secondary bile acids (BAs).             using chloroform isoamyl alcohol, and total DNA concentration per mg stool was
                                                                                 determined by qRT-PCR. Purified DNA samples were sent to the Argonne
Our understanding role of BAs has evolved from simple deter-                     National Laboratory (Lemont, IL) for amplicon sequencing using the NextGen
gents to hormones intimately related to multiple metabolic pro-                  Illumina MiSeq platform, utilizing 16S rRNA MiSeq for bacteria and archaea and
cesses, revealing important roles of BAs in dyslipidemia and type                parallel ITS2 rDNA sequencing for fungi. Blank samples for the jejunal sequencing
2 diabetes36. BAs are a significant source of host–microbiome                     run passed through the entire collection, extraction, and amplification process
interaction via cellular receptors such as TGR5 (Gpbar1)37 and                   remained free of DNA amplification.
FXR (Nrlh4)36. Therefore, BA composition is interrelated with
metabolic hormones such as leptin38,39, resistin40, ghrelin, GLP-1               Body composition. Body composition (fat and lean mass) was measured biweekly
                                                                                 using an EchoMRI 1100 system (EchoMRI, Houston, TX). System calibrations
(glucose-like peptide-1), and peptide YY41. However, fungi also                  were performed before each session. These differences were confirmed by tissue
produce BAs and likely participate in the gut BA pool to an                      collection after the experiment ended.
underappreciated extent42. Fusarium, which we found was key to
the structure of processed diet-induced weight gain-resistant TAC                Tissue collection. At the experimental endpoint, epididymal white adipose tissue
mice, is a prolific metabolizer of deoxycholic acid. Other key                    depots (eWAT) and liver were immediately dissected and cleared of any connective
fungi, such as Aspergillus and Penicillium, can also produce sec-                tissue before being weighed to determine specific organ/tissue weights. Tissues
                                                                                 were then snap-frozen in liquid nitrogen or fixed in 10% neutral buffered formalin
ondary BAs42. BAs also influence the stability of other fungal                    for histology.
metabolites. For example, luminal BAs43 influence the stability of
a prominent lipase in Thermomyces, which we observed as the
                                                                                 Serum metabolic biomarkers. Serum triglycerides were quantified using a Tri-
taxa most significantly associated with weight gain on a processed                glyceride Colorimetric Assay Kit (Cayman Chemicals, Ann Arbor, MI). Metabo-
diet. Intriguingly, in our model, these differences correlated with              lically active hormones were quantified using the Bio-Plex Pro Mouse Diabetes
differences in metabolic hormones, including leptin, resistin, and               Panel (Bio-Rad Laboratories, Hercules, CA). Both were prepared according to the
ghrelin. These findings may suggest a potential role for fungi in                 manufacturer’s instructions. Freshly obtained blood samples were allowed to clot
                                                                                 for 30 min at room temperature before undergoing centrifugation at 5000 rcf for
host metabolic processes via BA signaling.                                       5 min to obtain serum samples. We utilized an 8-plex Bio-Plex Pro Mouse Diabetes
   In summary, these data indicate the gut mycobiome in healthy                  Panel from Bio-Rad (cat. #171F7001M, Hercules, CA) to quantify ghrelin, GIP,
mice is highly variable and responds to disturbances such as                     GLP-1, glucagon, insulin, leptin, PAI-1, and resistin in mouse serum.
changes in the environment and diet. Despite these ecological
pressures, resilient differences in gut mycobiome composition in                 Histochemistry. Liver histology using hematoxylin and eosin was performed on
healthy mice strongly associated with differences in host meta-                  paraldehyde-preserved tissue. The liver was harvested and fixed overnight in 4%
bolic tone, including differential fat deposition, metabolic bio-                paraformaldehyde. Tissues were processed (Tissue-Tek V.I.P, Sakura Finetek,
                                                                                 Torrance, CA) and embedded in paraffin. For representative images, samples were
markers, and gene expression in metabolic tissues. We also                       cut (5.0 μm) and placed on adhesive coated slides (Newcomer Supply, Madison,
highlighted two fungal-derived products with plausible effects on                WI), deparaffinized, rehydrated and H&E stained (Cat. No. H-3502, Vector
host metabolism. While there are potentially thousands of                        Laboratories, Burlington, Canada). For pathology assessment of lipid deposition,
metabolically active fungal products, our work argues for future                 samples were imaged in triplicate for representative images.
work in defined gnotobiotic animal models to further elucidate
the mechanisms of mycobiome-host interaction. Finally, our                       Gene expression. Gene expression in liver and epididymal white adipose tissue
                                                                                 was quantified using SYBR Green qRT-PCR (Applied Biosystems, Inc., Foster City,
findings suggest that differences in the gut mycobiome may be an                  CA) on the QuantStudio 6 Flex Real-Time PCR System (Applied Biosystems).
underappreciated source of variability in health and metabolic                   Tissues were collected in TRIzol reagent (Ambion, Austin, TX). RNA was isolated
outcomes in response to dietary interventions.                                   using the TRIzol and chloroform method, and RNA purity was validated through
                                                                                 UV-Vis spectrophotometry using a Nanodrop Lite (ThermoScientific, Wilmington,
                                                                                 DE). Total RNA (1.0 μg) was reverse-transcribed to complementary DNA (cDNA)
                                                                                 using a Transcriptor First Strand cDNA Synthesis Kit (Roche, Indianapolis, IN)
Methods                                                                          according to the manufacturer’s instructions. RT-PCR amplification comprised an
Ethics statement. All animal studies were approved by the Institutional Animal   initial denaturation step (95 °C for 10 min), 45 cycles of denaturation (95 °C for
Care and Use Committee at the University of Tennessee Health Science Center      10 s), annealing (55 °C for 20 s) and extension (60 °C for 30 s), followed by a final
(protocol # 17-089). Laboratory animal care policies follow the Public Health    incubation at 55 °C for 30 s and cooling at 40 °C for 30 s. All measurements were
Service Policy on Humane Care and Use of Laboratory Animals. All results are     normalized by the expression of the GAPDH gene, a stable housekeeping gene.
reported in a manner consistent with ARRIVE guidelines44.                        Gene expression was determined using the delta–delta Ct method: 2−ΔΔCT

COMMUNICATIONS BIOLOGY | (2021)4:281 | https://doi.org/10.1038/s42003-021-01820-z | www.nature.com/commsbio                                                        9
ARTICLE COMMUNICATIONS BIOLOGY | https://doi.org/10.1038/s42003-021-01820-z
(ΔΔCT = [Ct (target gene) − Ct(GAPDH)]tested − [Ct(target gene) − Ct Received: 20 July 2020; Accepted: 9 February 2021;
(GAPDH)]control) and displayed as relative mRNA levels.
Statistical analysis. Sequence data were processed in QIIME 1.9 and analyzed in
Calypso 8.8446 (Hellinger transformed) and R 3.6.0 primarily using the vegan and
mvabund (model-based analysis of multivariate abundance data) packages47. References
Biochemical data were analyzed using R. Machine learning was performed in R and 1. Kau, A. L., Ahern, P. P., Griffin, N. W., Goodman, A. L. & Gordon, J. I.
presented in accordance with the TRIPOD guidelines48.
Human nutrition, the gut microbiome and the immune system. Nature 474,
327–336 (2011).
Bioinformatics. Sequencing data were processed using QIIME 1.9.1. Sequences 2. Maruvada, P., Leone, V., Kaplan, L. M. & Chang, E. B. The human
were demultiplexed, denoised, and clustered into operational taxonomic units microbiome and obesity: moving beyond associations. Cell Host Microbe 22,
(OTUs). For bacteria, sequences were aligned via PyNAST, and taxonomy was 589–599 (2017).
assigned against the SILVA database. For fungi, sequences were aligned, and tax- 3. Sonnenburg, J. L. & Bäckhed, F. Diet-microbiota interactions as moderators of
onomy was assigned using the UNITE (dynamic setting) database. All OTU count human metabolism. Nature 535, 56–64 (2016).
data followed a negative binomial distribution. Processed data were then imported 4. Kovatcheva-Datchary, P. et al. Dietary fiber-induced improvement in glucose
into Calypso 8.84 for further data analysis and visualization. Additional data metabolism is associated with increased abundance of prevotella. Cell Metab.
analysis was performed in R. On import in Calypso, all mitochondrial sequences 22, 971–982 (2015).
were discarded. For bacteria, any samples withCOMMUNICATIONS BIOLOGY | https://doi.org/10.1038/s42003-021-01820-z ARTICLE
31. Wheeler, M. L. et al. Immunological consequences of intestinal fungal Acknowledgements
dysbiosis. Cell Host Microbe 19, 865–873 (2016). Funding from NIH, NCI: R01 CA253329 (J.F.P.); NIH, NHLBI: K08 HL151907 (K.A.W.);
32. Carmody, R. N. et al. Diet dominates host genotype in shaping the murine gut NIH, NIDDK: R01 DK117183 (A.B.); NIH NIDDK R01 DK125047 (A.G.). The authors
microbiota. Cell Host Microbe 17, 72–84 (2015). would also like to thank the Children’s Foundation Research Institute at Le Bonheur
33. Charlet, R. et al. Remodeling of the Candida glabrata cell wall in the Children’s Hospital for providing scientific editing.
gastrointestinal tract affects the gut microbiota and the immune response. Sci.
Rep. 8, 3316 (2018).
34. Kreznar, J. H. et al. Host genotype and gut microbiome modulate insulin
Author contributions
Conceptualization: K.A.W., A.G., and J.F.P. Investigation: T.S.M., Q.A., S.P.W.,
secretion and diet-induced metabolic phenotypes. Cell Rep. 18, 1739–1750 (2017).
C.T.W., T.R., and A.B. Formal data analysis: J.S., K.A.W., J.F.P. Writing—original
35. Castoldi, A. et al. Dectin-1 activation exacerbates obesity and insulin
draft: K.A.W. Writing—review and editing: T.S.M., Q.A., J.S., S.P.W., C.T.W., T.R.,
resistance in the absence of MyD88. Cell Rep. 19, 2272–2288 (2017).
A.G., A.B., J.C.H., K.A.W., and J.F.P. Supervision and funding acquisition: K.A.W.
36. Staels, B. & Fonseca, V. A. Bile acids and metabolic regulation: mechanisms and
and J.F.P. The funding source had no role in the study design; in the collection,
clinical responses to bile acid sequestration. Diabetes Care 32, S237–S245 (2009).
analysis, and interpretation of data; in the writing of the report; or in the decision
37. Willis, K. A. et al. TGR5 signaling mitigates parenteral nutrition associated
to submit the paper for publication. The content is solely the responsibility of the
liver disease. Am. J. Physiol. Gastrointest. Liver Physiol. 41, 203 (2020).
authors and does not necessarily represent the official views of the National Institutes
38. Liang, C. P. & Tall, A. R. Transcriptional profiling reveals global defects in
of Health.
energy metabolism, lipoprotein, and bile acid synthesis and transport with
reversal by leptin treatment in ob/ob mouse liver. J. Biol. Chem. 276,
49066–49076 (2001). Competing interests
39. Mertens, K. L., Kalsbeek, A., Soeters, M. R. & Eggink, H. M. Bile acid signaling The authors declare no competing interests.
pathways from the enterohepatic circulation to the central nervous system.
Front. Neurosci. 11, 617 (2017).
40. Schmid, A., Schlegel, J., Thomalla, M., Karrasch, T. & Schäffler, A. Evidence of Additional information
functional bile acid signaling pathways in adipocytes. Mol. Cell. Endocrinol. Supplementary information The online version contains supplementary material
483, 1–10 (2019). available at https://doi.org/10.1038/s42003-021-01820-z.
41. Roberts, R. E. et al. The relationship between postprandial bile acid
concentration, GLP-1, PYY and ghrelin. Clin. Endocrinol. 74, 67–72 (2011). Correspondence and requests for materials should be addressed to K.A.W. or J.F.P.
42. Kollerov, V. V. et al. Deoxycholic acid transformations catalyzed by selected
filamentous fungi. Steroids 107, 20–29 (2016). Reprints and permission information is available at http://www.nature.com/reprints
43. Wang, H., Hagedorn, J., Svendsen, A., Borch, K. & Otzen, D. E. Variant of the
Thermomyces lanuginosus lipase with improved kinetic stability: a candidate Publisher’s note Springer Nature remains neutral with regard to jurisdictional claims in
for enzyme replacement therapy. Biophys. Chem. 172, 43–52 (2013). published maps and institutional affiliations.
44. Kilkenny, C., Browne, W. J., Cuthill, I. C., Emerson, M. & Altman, D. G.
Improving bioscience research reporting: the ARRIVE guidelines for reporting
animal research. PLoS Biol. 8, e1000412 (2010). Open Access This article is licensed under a Creative Commons
45. Willis, K. A. et al. Fungi form interkingdom microbial communities in the Attribution 4.0 International License, which permits use, sharing,
primordial human gut that develop with gestational age. FASEB J. 33, adaptation, distribution and reproduction in any medium or format, as long as you give
12825–12837 (2019). appropriate credit to the original author(s) and the source, provide a link to the Creative
46. Zakrzewski, M. et al. Calypso: a user-friendly web-server for mining and Commons license, and indicate if changes were made. The images or other third party
visualizing microbiome-environment interactions. Bioinformatics 33, 782–783 material in this article are included in the article’s Creative Commons license, unless
(2017). indicated otherwise in a credit line to the material. If material is not included in the
47. Wang, Y., Naumann, U., Wright, S. T. & Warton, D. I. mvabund—an R article’s Creative Commons license and your intended use is not permitted by statutory
package for model‐based analysis of multivariate abundance data. Methods regulation or exceeds the permitted use, you will need to obtain permission directly from
Ecol. Evol. 3, 471–474 (2012). the copyright holder. To view a copy of this license, visit http://creativecommons.org/
48. Collins, G. S., Reitsma, J. B., Altman, D. G. & Moons, K. G. M. Transparent licenses/by/4.0/.
reporting of a multivariable prediction model for individual prognosis or
diagnosis (TRIPOD): the TRIPOD statement. J. Clin. Epidemiol. 68, 134–143
(2015). © The Author(s) 2021
COMMUNICATIONS BIOLOGY | (2021)4:281 | https://doi.org/10.1038/s42003-021-01820-z | www.nature.com/commsbio 11You can also read