Tailoring the near-Surface Composition Profiles of Pressure-Sensitive Adhesive Films and the Resulting Mechanical Properties - mvm kit
←
→
Page content transcription
If your browser does not render page correctly, please read the page content below

RESEARCH ARTICLE

                                                                                                                                                www.acsami.org

Tailoring the near-Surface Composition Profiles of Pressure-Sensitive
Adhesive Films and the Resulting Mechanical Properties
Alexander Diethert,† Katharina Ecker,† Yana Peykova,‡ Norbert Willenbacher,‡ and
Peter M€uller-Buschbaum*,†
†
  Technische Universit€at M€unchen, Physik-Department E13, Lehrstuhl f€ur Funktionelle Materialien, James-Franck-Strasse 1,
  85747 Garching (Germany)
‡
  Institut f€ur Mechanische Verfahrenstechnik und Mechanik, Karlsruher Institut f€ur Technologie (KIT), Kaiserstrassse 12,
  76131 Karlsruhe (Germany)

    ABSTRACT: We present a possibility of tailoring the near-
    surface composition profiles of pressure sensitive adhesive (PSA)
    films by an exposure to atmospheres of different relative humid-
    ities (RHs). The statistical copolymer P(EHA-stat-20MMA)
    with a majority of ethylhexylacrylate (EHA) and a minority of
    methylmethacrylate (MMA), being cast from a toluene based
    solution, is chosen as a model system. The near-surface composi-
    tion profile is probed with X-ray reflectivity. All probed samples
    show an enrichment of PMMA at the sample surface; however,
    the near-surface PMMA content strongly increases with increasing RH. The influence of the RH on the composition profile is
    present down to a depth of 50 nm. Therefore the surface tensions being derived from contact angle measurements do not show any
    measurable humidity dependence. In contrast, in a mechanical tack test with a smooth punch surface, a strong influence is probed.
    This observation can be explained by considering the integrated PMMA content over an appropriate near-surface region and the
    resulting impact on the cavitation process.
    KEYWORDS: pressure-sensitive adhesive, solution casting, X-ray reflectivity, surface enrichment

1. INTRODUCTION                                                                  Moreover, the performance of an adhesive can also be changed
    Pressure-sensitive adhesives (PSAs) mark one class of adhesives           mechanically. Inspired by gecko feet, it is possible to achieve a
that have the ability to create releasable bonds. PSAs have a wide-           much stronger shear adhesion force as compared to the normal
spread range of different applications, which includes stick-on notes,         adhesion force by making use of aligned carbon nanotubes.13,14 An
adhesive foils, scotch tapes, labels, and reusable packages. Thus PSAs        alternative approach is a fibrillar structure that is terminated by a
offer the opportunity to connect extremely different materials such as          continuous film.15 As long as the system is in a stretched state an
paper, metals, glasses, ceramics, and polymers in a reuseable way.            enhanced adhesion is measured. When it is mechanically switched
Typically, the adhesion is well balanced by the constituents of the PSA       to a collapsed state, the adhesion is reduced. Furthermore, Feng
film. For example, to install low-tack materials a nontacky component          and co-workers demonstrated transfer printing based on kineti-
is added in order to limit the contact area between the PSA system            cally switchable adhesion to an elastomeric stamp.16 Whether a
and the bonded surface. These added components can be inorganic               film is deposited on a substrate or picked up by the stamp is
solid particles like glass beads, calcium carbonate or glassy polymers.1      determined by the speed of the film/stamp interface.
    For some applications, it is desirable to have a controllable                Most common is the use of temperature as a stimulus to change
adhesive bond via an external stimulus. One approach is based on              the adhesion due to a change in morphology of the adhesive in order
the use of a switchable adherent. For example, the adhesion                   to achieve a change in tackiness. For example, liquid crystalline
between a switchable polystyrene/poly(2-vinylpyridine) brush                  polymers can be used because of the big impact of the orientation of
and an elastomeric adhesive can be controlled by the use of                   the side chains. The transition from a smectic layering toward an
selective solvents.2 With this method, the authors varied the                 isotropic state, within a narrow temperature range, leads to a
surface composition of the brush and observed a change in the                 significant change in tack force.17,18 Alternatively, in semicrystalline
strength of the adhesive bond. The same concept also works when               polymers the adhesive performance can be switched by heating the
the brush itself is switched from a sticky to a nonsticky state.3,4           sample above the melting temperature of the crystals. For this
    Besides the response to selective solvents, the nature of possible        purpose, for example Agirre and co-workers produced waterborne
stimuli can be very different. Among others, responses of adhesives
have been reported to temperature,57 exposure to light,8 presence            Received: March 1, 2011
of water9 or water vapor,10,11 and the application of an electrical           Accepted: May 23, 2011
voltage.12                                                                    Published: May 23, 2011

                              r 2011 American Chemical Society             2012          dx.doi.org/10.1021/am200254m | ACS Appl. Mater. Interfaces 2011, 3, 2012–2021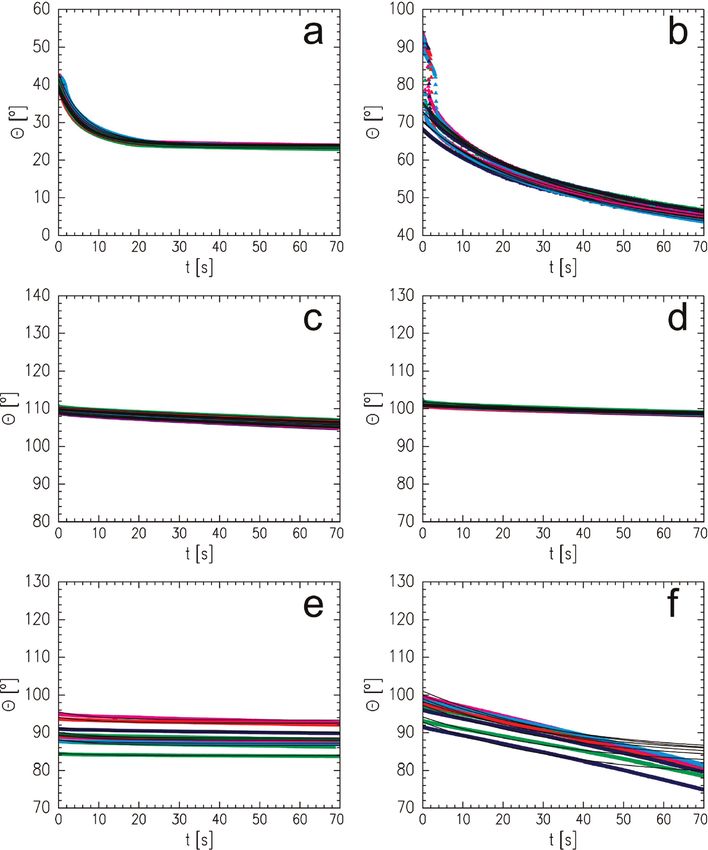
ACS Applied Materials & Interfaces                                                                                                    RESEARCH ARTICLE

PSAs copolymerized out of ethylhexylacrylate, methacrylic acid and       mechanical tack test, the resulting composition profiles as well as
stearyl acrylate.19 The crystallinity was controlled by the monomer      their impact on the surface tension and the tackiness are
ratio in the formulation, the process conditions and the blending        presented and discussed. The article concludes with a summary
ratio. Because of the change in temperature, the crystallinity was       of the results and a short outlook.
changed, and as a consequence, the shear resistance and the peel
strength were altered.                                                   2. EXPERIMENTAL SECTION
   In our investigation, we focus on a stimulus given by the
presence of water vapor. In contrast to the simple absence or               2.1. Sample Preparation. The statistical copolymer P(EHA-stat-
presence of water vapor, we use different relative humidities             20MMA) with a monomer composition of 80% ethylhexylacrylate (EHA)
(RHs). Our idea is to tailor the near-surface morphology of the          and 20% methylmethacrylate (MMA) and a molecular weight of Mw =
adhesive via the RH of the surrounding atmosphere. An increased          248 k is chosen for this investigation. P(EHA-stat-20MMA) was polymerized
RH leads to an increased selectivity with respect the more polar         with a radical solution polymerization technique and, thus, shows a broad
component in the adhesive. To make this effect applicable for             molecular weight distribution, which is typical for adhesive applications.
adhesives, we use a system that comprises components that differ             For the film preparation the polymer was dissolved in toluene using
in polarity and tackiness. The mechanical properties change as a         a concentration of 94.5 g/L. Microscope slides (MENZEL, 76 mm
consequence of the altered near-surface composition. Moreover,           26 mm  1 mm), which had been flushed with compressed, oil-free
in a rephrased way, our experiments also contribute to the question      nitrogen directly before casting the solution in order to remove dust
what happens when such an adhesive film is stored under different          particles, are used as a substrate. With the chosen solution concentration,
RH conditions.                                                           the desired film thickness of 50 μm is achieved by casting a solution
   In literature, the influence of the RH on the morphology of            volume of 1 mL onto the substrate. Weight measurements have been
                                                                         carried out to confirm the thickness. The advantage of such thick films is
polymers was investigated experimentally for different non-tacky
                                                                         that, because of their short-ranged nature,2729 the interactions between
systems. One example is the tuning of the phase separation
                                                                         the substrate and the near-surface region can be neglected and thus, a
morphology by selecting the appropriate RH.20 With this
                                                                         maximum sensitivity to the RH is achieved. The complete preparation
approach, in block copolymer electrolytes, the orderdisorder            process is performed under a constant temperature of 20 °C which is
transition was affected,21 and in polymer blends on prepatterned          kept constant by air-conditioning.
substrates, the demixing was controlled.22                                  Because the composition profiles are very sensitive to the evaporation
   Moreover, computer simulations by Klos et al. showed that the         speed being closely related to the accessible volume for the evaporating
RH determines the near-surface composition.23 In the simulation          solvent and thus to the size and shape of the sample chamber, as well as the
the composition profile of a two component statistical copolymer          humidity and the temperature, the sample preparation is done in two
P(A-stat-B) near a selective surface was modeled using the bond          steps. In a first step, the casting of the liquid is performed in a desiccator
fluctuation method. With increasing the interaction parameter             (flange diameter 118.5 mm, SCHOTT, DURAN) filled with silica gel
between the surface and species A, more A-monomers adsorbed              which produces a RH that is measured to be lower than 2%. The substrate
near the interface. Underneath this surface enrichment layer, the        is carefully aligned beforehand to ensure a uniform film thickness. The
authors predicted an enrichment of monomers of type B.                   drying time at such low humidity is 24 h. As a consequence, a well-defined
Stimulated by this simulations, we select a model system based           and reproducible film structure is established.
on a statistical copolymer P(A-stat-B), with two blocks A and B.            In a second step, the dried sample is placed into a humid environ-
One block is selected to be rigid and the other one tacky as             ment, which is provided by another desiccator filled with saturated salt
commonly being used in adhesives. To allow for tunability via            solution. To reduce unnecessary exposure to ambient air and thus
RH, the blocks of the statistical copolymer differ in polarity. Our       uncontrolled conditions, the sample stage in the second desiccator is
model system is the statistical copolymer P(EHA-stat-20MMA)              already prealigned and the lid is closed immediately after placing the
with a composition ratio of 80% of ethylhexylacrylate (EHA) and          sample. The storage time in the second desiccator is another 24 h, giving
20% methylmethacrylate (MMA).                                            again rise to a well-defined and reproducible film structure.
   To understand the observed changes in the tack as a function of          In summary, with the chosen preparation procedure the observed
RH, we determine the corresponding near-surface composition              composition profiles only depend on the installed humidity. If the solution
profiles. Recently, we have shown that X-ray reflectivity (XRR) is a       had been casted directly under humid conditions, it would have been
well suited method to probe such near-surface composition                impossible to separate the effect of interface selectivity due to humidity
                                                                         from a decelerated evaporation speed due to a reduced evaporation
profiles in adhesive films.24 Moreover, we were able to demon-
                                                                         volume originating from the presence of water vapor in the desiccator.
strate that the near-surface composition influences the tackiness of
                                                                            The corresponding X-ray reflectivity, contact angle and probe tack
the adhesive film. We related the adhesive performance of
                                                                         measurements were performed immediately after removing the sample
statistical copolymer films composed of 90% EHA and 10% of a              from the desiccator. Conformational changes of the sample until the end
glassy monomer to the installed near-surface composition profiles.        of the experiments are not to be expected because the time scale for
With decreasing amount of glassy component in a near-surface             significant molecular reorganization is on the order of days.24
region, which has a thickness equal to the punch roughness of the           Six different RHs are selected, whereas one sample is kept in the
tack tester, the tackiness also dropped. The influence of the glassy      desiccator filled with silica gel for the entire 48 h and, thus represents the
component on the cavitation process causes such reduced tack.25          preparation under dry conditions. The five higher RHs are (23.11 (
   In addition to the determination of the near-surface composi-         0.25)%, (43.16 ( 0.33)%, (54.38 ( 0.23)%, (75.47 ( 0.14)% and
tion and tack as a function of RH, we analyze the dependence of          (85.11 ( 0.29)% provided by saturated water-based solutions of
the surface tension of our PSA model system26 P(EHA-stat-                potassium acetate, potassium carbonate, magnesium nitrate, sodium
20MMA).                                                                  chloride and potassium chloride, respectively.30
   This article has the following structure: After a description of         2.2. X-ray Reflectivity (XRR). The X-ray reflectivity (XRR)
the investigated samples and a brief introduction in the main            experiments were performed with a “Siemens D5000 Diffraktometer”.
experimental methods XRR, contact angle measurement and                  The width of the beam was chosen to be 12 mm and the wavelength was

                                                                      2013           dx.doi.org/10.1021/am200254m |ACS Appl. Mater. Interfaces 2011, 3, 2012–2021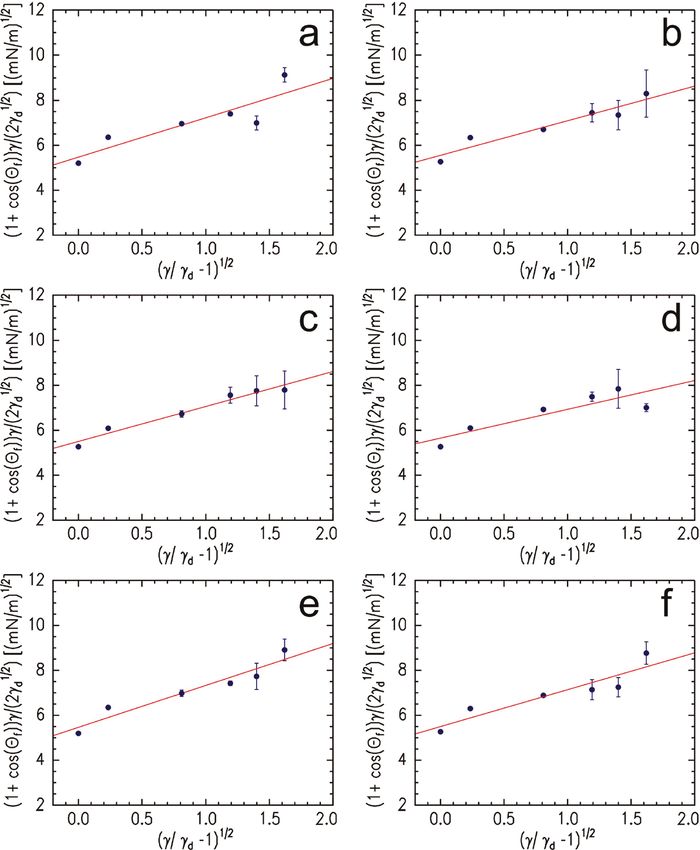
ACS Applied Materials & Interfaces                                                                                                              RESEARCH ARTICLE

Figure 1. (a) Measured XRR data (symbols) in Fresnel-normalized representation of a P(EHA-stat-20MMA) film casted and dried in a desiccator for
24 h and respective fit to the data (solid line). (b) Corresponding refractive index profile to the shown fit. The vertical lines mark the values of the
refractive indices of P(EHA-stat-20MMA) and the related homopolymers as shown by the labels. (c) Black and white coded composition profile
calculated from the refractive index profile. The horizontal lines mark the positions z = 0, 200, and 1500 Å, measured from the sample surface. (d) Zoom
into the near-surface region of the composition profile. (e) Color code used in the composition profiles.

λ = 1.54 Å corresponding to the CuKR line. For beam collimation a slit            Immediately after the droplet was placed onto the sample, the stage
system was used in combination with a tantalum knife edge. The                     was moved into the focus of a prealigned camera with high magnification
reflected beam was detected with a scintillation counter in front of               and a movie of the droplet was recorded for around 70 s with a frame rate
which a graphite monochromator was situated to filter the CuKβ line.              of 15 images per second.
For small reflection angles an absorber reducing the intensity by a factor            The contact angle θ of the droplet with respect to the sample was
of approximately 100 is used to avoid detector saturation and thus wrong           extracted with the “dataphysics SCA20” software from each image of the
counting rates.                                                                    movie by fitting an ellipsoidal contour to the droplet shape. The
   For an incident angle j, the detector was positioned at an angle 2j             influence of gravity on the droplet shape can be neglected for such
measured with respect to the incoming beam. The reflectivity curves cover           small volumes justifying the assumption of an ellipsoidal shape.35 As a
an angular range of 0° < 2j < 7° with a maximum resolution of 0.01°. To            result, θ is determined as a function of time t and the equilibrium contact
account for the lower counting rates at higher incident angles, this range is      angle θf is obtained from a fit to these curves.
divided into three overlapping intervals with adjusted measurement times              The resulting surface energy was determined by the method of Owens
which were merged according to the selected integration times.                     and Wendt.36 For this purpose, the experiment was performed with six
   For a pronounced representation of the features in the measured XRR             different test liquids. The corresponding dispersive (index d) and polar
curves we plot (I(qz)  b)qz4 as a function of the scattering vector qz =          (index p) components of the surface tension of the used liquids37
4πsin(j)/λ. In this so-called Fresnel-normalized representation I(qz) is           are γd(paraffin oil) = 29.5 mN/m, γp(paraffin oil) = 0 mN/m,
the reflected intensity which is normalized to 1 and b is the background            γd(diiodomethane) = 47.4 mN/m, γp(diiodomethane) = 2.6 mN/m,,
which is assumed to be constant. The XRR data analysis was performed               γd(ethylene glycol) = 29.0 mN/m, γp(ethylene glycol) = 19.0 mN/m,
with the reflectivity simulation and analysis tool Parratt32.31 From a fit to        γd(formamide) = 23.5 mN/m, γp(formamide) = 33.4 mN/m,
the data using the Parratt algorithm32 the refractive index profile δ(z) is         γd(glycerol) = 21.2 mN/m, γp(glycerol) = 41.5 mN/m, γd(water) =
obtained. δ(z) is the real part of the complex refractive index n(z) = 1          19.9 mN/m, γp(water) = 52.2 mN/m. At least seven data sets θ(t) were
δ(z) þ iβ(z) and z is the distance from the sample surface.                        recorded for each sample to reduce the statistical error.
   The δ-values for the involved homopolymers related to the statistical              2.4. Mechanical Tack Test. For the probe tack tests25 two
copolymer P(EHA-stat-20MMA) are δ(PEHA) = 3.21  106 and                          different setups were used. Both were operated under room temperature
δ(PMMA) = 4.06  106. They are calculated via the mass density of                 conditions. One is a custom-designed apparatus equipped with a “FGP
the homopolymers, the number of electrons of the respective monomers               XF-3030” force sensor and a probe made of stainless steel. The other
and the corresponding dispersion correction factors in dipole approx-              device is a “Stable Micro System” texture analyzer “TA.XT” using a
imation of the atom form factor.33,34 The high contrast between                    “Kistler” quartz force sensor and a silicon punch to contact the adhesive.
δ(PEHA) and δ(PMMA) makes it easy to distinguish between the                       Both probes are flat-ended and have cylindrical shape. The contact areas
two components. The average refractive index of the statistical copoly-            of both punches were highly polished to almost the same roughness
mer is calculated by weighting the refractive indices of the respective            values of Ra = 17 Å for stainless steel and Ra = 16 Å for silicon,
homopolymers by their composition ratio: δ(P(EHA-stat-20MMA)) =                    respectively. These values were determined by atomic force microscopy
3.37  106.                                                                       measurements.
   2.3. Contact Angle Measurements. The contact angle mea-                            At least 8 repetitions of the tack test were performed per sample so
surements were carried out on a “dataphysics contact angle system                  that the given values of the maximum stress as well as the tack energy
OCA” at a temperature of 20 °C, which was kept constant by air-                    represent an average with sufficient statistical significance. The position
conditioning. A sessile droplet with a volume of 2 μL was dispensed by a           on the sample was changed after each measurement to ensure that each
computer controlled syringe and brought in contact with the surface of             time a fresh spot with an untouched PSA surface was provided. Between
the adhesive film under investigation by a movable sample stage.                   two subsequent measurements the punch was carefully cleaned with a

                                                                                2014           dx.doi.org/10.1021/am200254m |ACS Appl. Mater. Interfaces 2011, 3, 2012–2021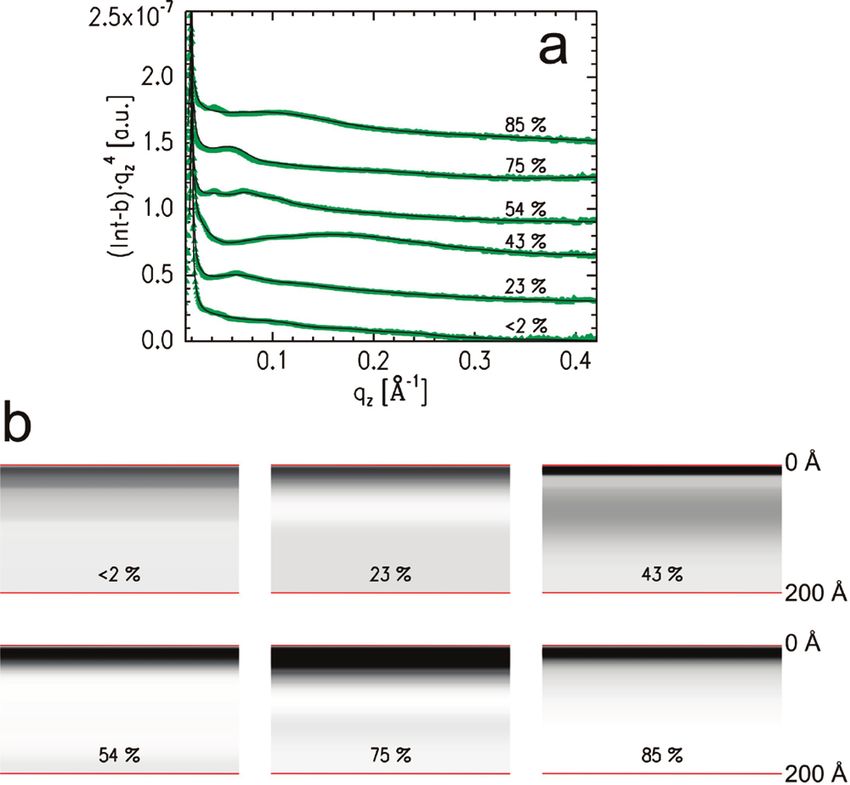
ACS Applied Materials & Interfaces                                                                                                         RESEARCH ARTICLE

soft tissue soaked with toluene so that possible PSA residues or dust
particles were removed. Additionally, to monitor the cavitation process,
the contact area was filmed with a CCD camera. Moreover, the optical
control was used for the alignment of the punch with respect to the PSA
surface.
   For all investigated samples, the punch approached and contacted the
sample at a velocity of 0.1 mm/s. The movement stopped instanta-
neously after a contact pressure of 0.32 MPa had been reached. After a
waiting time of precisely 10 s during which no further movements were
performed, the punch was retracted with a speed of again 0.1 mm/s and
the force and the distance were measured simultaneously. Finally, the
stress was calculated as the measured force divided by the punch area and
the strain as the punch distance from the point of zero stress divided by
the film thickness.
   2.5. Optical Microscopy. Before the XRR experiments, the films
were probed with a “Zeiss Axiotech 25H” optical microscope using
magnifications between 5 times and 100 times. The micrographs were
recorded with a “Hitachi KP-D50” CCD camera.

3. RESULTS AND DISCUSSION
   Using XRR to monitor the dependence of the near-surface                     Figure 2. (a) Measured XRR curves (symbols) and corresponding fits
refractive index profiles on the RH has many advantages: it is                  (solid lines) for a humidity series of P(EHA-stat-20MMA) in Fresnel-
non-destructive, the whole profile can be extracted out of one                  normalized representation. The RH increases from bottom to top as
measurement, it gives a resolution in the Ångstroem regime and                 shown by the labels. The data are shifted along the y axis for clarity.
one gets averaged information over the whole illuminated sample                (b) Corresponding black and white coded composition profiles. The
area.24,38,39                                                                  calculation from the refractive index profiles uses the color code defined
   Furthermore, with the chosen film thickness of 50 μm, the                    in figure 1e.
highest possible surface sensitivity is achieved due to the limited
penetration depth of the X-rays, preventing additional reflection                  Figure 1c is a direct conversion of the refractive index profile
from the glass surface.40 Such a reflection from the substrate                  into a black and white coded representation of the composition
would be visible by the presence of a second critical angle in the             profile (for code see Figure 1e). For all investigated samples the
XRR data (as it is found for films with a thickness below 20 μm).               main features are observed for 0 < z < 200 Å. For larger z, we find
The analysis of such data including a reflection from the substrate             convergence toward the mean composition 80% PEHA and 20%
is more challenging because it would be more difficult to reliably               PMMA in a similar way for all samples. That is why we focus on the
discriminate between enrichment layers near the air interface and              near-surface region and show a zoom into the region 0 < z < 200 Å
enrichment near the interface to the substrate. As a consequence,              (see Figure 1d).
to emphasize the near-surface composition profile we work with                     3.2. Humidity Dependence of the Composition Profiles.
sufficiently thick polymer films.24                                               After the first preparation step which is described in the previous
   The obtained refractive index profiles δ(z) are easily trans-                section, the samples are now exposed to a RH controlled environ-
ferred into composition profiles by applying the rule of three.24               ment in which they are stored for additional 24 h. At a total sample
This is possible because P(EHA-stat-20MMA) consists of two                     age of 48 h, again the near-surface composition profiles are
components with known refractive indices.                                      monitored. Figure 2a shows the XRR curves (symbols) for six
   3.1. Composition Profile after 24 h. As we pointed out in the               different RHs and the corresponding fits to the data (solid lines).
Experimental Section, it is important to have a well-defined                      The increasing intensity difference between the features at low
starting point before the samples are exposed to higher RHs.                   qz values and the background level with increasing RH is indicative
Figure 1a shows the XRR curve (symbols) together with the                      for an enhanced refractive index contrast in the sample and
corresponding fit (solid line) measured after the freshly casted               consequently for increasing heterogeneities along the surface
sample had been drying for 24 h in a desiccator filled with silica             normal within the near-surface region. The extracted composition
gel which is referred to as the status after the first preparation             profiles (see Figure 2b) show this in more detail. Most prominent
step. The modulations in the intensity between qz = 0.03 and 0.36              is the increase in PMMA content at the surface. Except for the
Å1 already indicate a heterogeneous composition profile in the                composition profile corresponding to a RH of 85%, also the
near-surface region.                                                           thickness of the PMMA layer increases as a function of time.
   In detail, from the refractive index profile in Figure 1b, we                Simultaneously to these modifications related to PMMA, also the
extract a weak solubility driven24 enrichment of PMMA with a                   PEHA enriched zone underneath gets more pronounced.
thickness of 70 Å at the sample surface followed by an enrich-                    Looking in more detail into the individual behavior, the curve
ment zone of PEHA which converges in an oscillating way to the                 that corresponds to a RH of 2% and thus to a storage time of 48 h
average composition of the statistical copolymer. This observa-                under dry conditions has strong similarities to the curve obtained
tion is consistent to what is predicted for random multiblock                  after 24 h (see Figure 1a). As a consequence, the resulting
copolymer melts near surfaces.41 Homogeneous bulk material is                  composition profiles are similar. However, there is a small
observed for z > 1000 Å, which corresponds to approximately                    difference in the PMMA content in the vicinity of the surface
9 times the radius of gyration of the copolymer.                               which is slightly higher for the aged sample (48 h) indicated by
                                                                            2015          dx.doi.org/10.1021/am200254m |ACS Appl. Mater. Interfaces 2011, 3, 2012–2021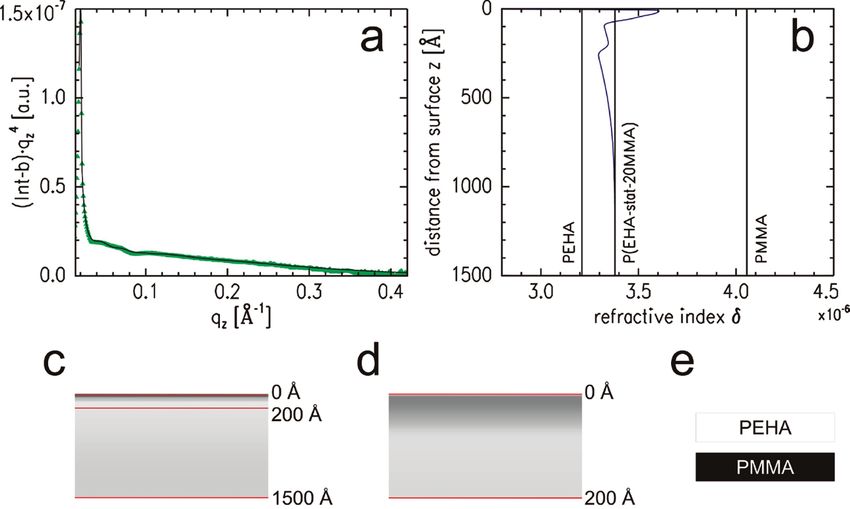
ACS Applied Materials & Interfaces                                                                                                   RESEARCH ARTICLE

                                                                         measured data. The fits have been acceptable as long as the
                                                                         respective PMMA concentration does not exceed the height of
                                                                         the symbols in Figure 3.
                                                                            3.3. Surface Tension As a Function of Relative Humidity.
                                                                         To relate the installed composition profiles to the resulting
                                                                         mechanical properties, we determine the surface tension of films
                                                                         of P(EHA-stat-20MMA) that are prepared under six different
                                                                         RHs following the presented preparation protocol. We apply the
                                                                         method of Owens and Wendt36 using six different test liquids.
                                                                            Because the droplets do not equilibrate immediately, it is
                                                                         necessary to record the contact angle as a function of time. We
Figure 3. Integrated PMMA content in the near-surface region of          observe a monotonic decay of the contact angle with time which
P(EHA-stat-20MMA) as a function of the RH. From top to bottom            slows down and approaches a limiting value. Because of the onset of
the integration region increases as shown by the labels.                 evaporation47 and dissolution of the polymer, it is not possible to
                                                                         measure until the equilibrium angle θf is reached. This observation
the darker color in the corresponding profile in Figure 2b. This          has already been made by Kano and Akiyama who described the
slightly higher PMMA content can be explained by a small                 contact angle of organic solvents on P(EHA-co-acrylic acid) as an
amount of residual solvent which is still present after 24 h having      exponential decay.48 Lavi and Marmur introduced one additional
the ability to transport the more soluble PMMA with respect to           parameter when modeling the spreading behavior of partially
toluene to the surface during evaporation. It has to be noted that       wetting liquids.49
the residual solvent cannot be detected because its ratio is in the         We translate their function to the problem of equilibrating
subpercent regime and it is not enriched in the near-surface             contact angles and use the fit function
region that is accessible with XRR.42,43
   In case of the samples exposed to higher RHs, the PMMA                          θðtÞ ¼ θf þ ð180°  θf Þexp½  kðt  t0 Þm
enrichment is more pronounced as compared to that in the
sample which was completely prepared under dry conditions. An            which is defined for t g t0. t0 is the time when the droplet gets
increased amount of evaporated residual solvent cannot be                in contact with the substrate. At this point the contact angle is
responsible for this behavior because the higher the RH is the           θ(t0) = 180°. For large times t, θ(t) converges to θf being the
less solvent can evaporate. The reason for this is the additional        equilibrium contact angle. θf, k, m, and t0 are the fitted param-
space that is occupied by water vapor in the desiccator for the          eters, where k and m account for the interaction kinetics of the
higher RHs giving rise for a decelerated solvent evaporation. A          droplet with the adhesive and t0 is an experimental parameter
reduced evaporation of residual solvent leads to a lower near-           describing the time delay between the first contact of the droplet
surface PMMA content. This is consistent with the observations           with the sample and the start of the measurement. The values for
made by Gu and Alexandridis reporting that the drying rate               k and m are in the interval (0, 1.5), and t0 is on the order of
decreases with increasing RH.44                                          seconds.
   As a consequence, the additional PMMA which is detected at               Figure 4 shows exemplarily the measured contact angles as a
the sample surface for higher RHs can only be explained by the           function of time with the corresponding fits for P(EHA-stat-
enhanced selectivity of the surrounding atmosphere with respect          20MMA) which was completely prepared under dry conditions.
to PMMA. The polarities of the involved components are 0.026             The fitted equilibrated contact angles θf are (23.7 ( 0.4)° for
for PEHA45 and 0.357 for PMMA46 being calculated as the ratio            paraffin oil, (41.4 ( 1.0)° for diiodomethane, (55.8 ( 1.3)° for
between the polar component of the surface tension and the total         ethylene glycol, (74.9 ( 0.6)° for formamide, (88.4 ( 2.6)°
surface tension. Under constant temperature, the water vapor             for glycerol, and (82.5 ( 2.3)° for water. The errors are the
content and thus the polarity of the medium in which the samples         standard deviation of the fitted θf of the corresponding curves.
are placed increases with increasing RH. As a consequence, the           For the case of ethylene glycol and formamide, the equilibration
more polar PMMA is favored to be adsorbed at the polymerair             times are almost 2 h. Longer measurements have been performed
interface and the near-surface PMMA concentration increases as           to confirm the fitted θf for these two liquids.
a function of RH.                                                           The described measurements and the data analysis are carried out
   To quantify this phenomenon, we integrate the composition             for all six samples of the humidity series. As a result, figure 5 shows
profiles over different depths measured from the surface. We               the corresponding Owens-Wendt plots for the six RHs. In detail,
select a range between z = 0 and z = 20, 40, 150, 500, and 1000 Å        [1 þ cos(θf)]γ/(2γd1/2) is plotted as a function of (γ/γd  1)1/2,
and plot the corresponding average PMMA content as a function            where γ and γd are the total and the dispersive component of the
of RH (see figure 3). As the illustration in figure 2b has already         surface tensions of the involved test liquids. By fitting a linear
suggested qualitatively, the PMMA content in the upper 20 Å              function to these six points for each sample, the surface tensions of
increases monotonically with RH from 55% for dry conditions to           P(EHA-stat-20MMA) for the different RHs are obtained: the y-axis
85% for a RH of 75%. Saturation is reached for RHs which are             intercept is the square root of the dispersive component and the
higher than 75%. For broader integration regions the effect of            slope is the square root of the polar component of the surface
PMMA enrichment gets less pronounced. An averaging of the                tension. The total surface tension is the sum of both.
composition profiles over more than 500 Å finally leads to a                  The OwensWendt plots in Figure 5 already indicate a strong
constant PMMA content as a function of RH.                               similarity between samples prepared under different RHs.
   The error of the plotted PMMA concentrations is on the order          Figure 6 shows from bottom to top the polar component, the
of the symbol size. It is obtained by slight variations of the           dispersive component and the total surface tension as a function
refractive index profiles which correspond to the best fit of the          of RH. As a result, for all contributions to the surface tension no
                                                                      2016          dx.doi.org/10.1021/am200254m |ACS Appl. Mater. Interfaces 2011, 3, 2012–2021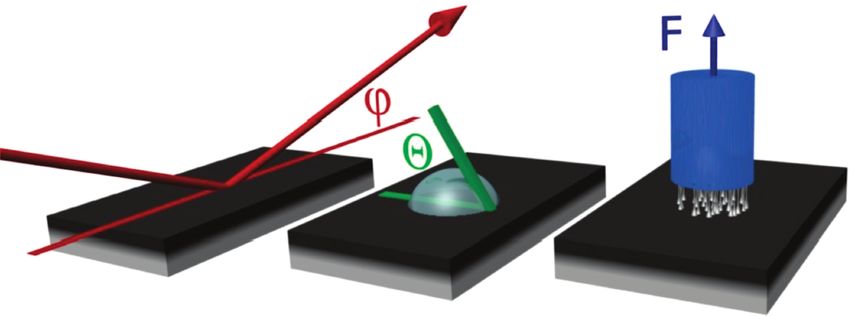
ACS Applied Materials & Interfaces                                                                                                            RESEARCH ARTICLE

Figure 4. Contact angle θ as a function of time t for six different test liquids on a film of P(EHA-stat-20MMA) prepared under dry conditions. Symbols
represent the measured data and the solid lines are the corresponding fits. At least seven curves are measured for each liquid. With increasing polarity, the
liquids are (a) paraffin oil, (b) diiodomethane, (c) ethylene glycol, (d) formamide, (e) glycerol, and (f) water.

RH dependence is detected. Irrespective of the RH, we obtain a                   surface stiffness and the adhesive properties were strongly
mean surface tension of γp(P(EHA-stat-20MMA)) = (2.6 ( 0.6)                      influenced but the surface energy determined with contact angle
mN/m, γd(P(EHA-stat-20MMA)) = (30.5 ( 0.8) mN/m, and                             measurements was unchanged. Similar to that, Falsafi and co-
γ(P(EHA-stat-20MMA)) = (33.1 ( 0.3) mN/m. Literature                             workers found that the surface tension of P(EHA-co-acrylic acid)
values of the corresponding homopolymers45,46 are γ(PEHA) =                      elastomers was constant as a function of acrylic acid content.51 In
30.2 mN/m and γ(PMMA) = 38.4 mN/m.                                               contrast to our work, none of these investigations was able to
   The reason for this result can be found in the installed                      directly monitor the near-surface composition profile, although it
composition profiles. Although we find a significant enrichment                     is to be expected that the variation in the respective control
of PMMA at the sample surface, this enrichment layer has only a                  parameters changed the surface composition.
thickness of less than 70 Å which is in the sub-Rg regime. The                      3.4. Mechanical Tack Test. The constant surface tension as a
interaction between the adhesive and the droplet, however, is                    function of RH implies that the thermodynamic work of adhe-
determined by the composition profile in the near-surface region                  sion for a given punch material is identical for all samples in the
up to a certain depth. Figure 3 gives an estimate that the RH                    humidity series.52,53 Even so, the adhesive performance does
correlation is lost for integration depths higher than 500 Å                     change as a function of RH, which means that this is solely a
explaining the missing RH dependence of the surface tension.                     consequence of the altered near-surface mechanical properties.
   Observations supporting our findings have already been                         The effect is demonstrated via probe tack tests, using a punch
discussed in literature. Staeger et al., for example, investigated               which is fabricated of either stainless steel or silicon. The tack
the nanomechanical properties of poly(styrene-b-butadiene-                       experiments with the steel punch have been carried out for the
b-styrene) triblock copolymers with different copolymer formu-                    same six different RHs as in the presented XRR and contact angle
lations and the impact of UV light exposure.50 As a result, the                  measurements. Additionally, a silicon punch was employed for
                                                                             2017            dx.doi.org/10.1021/am200254m |ACS Appl. Mater. Interfaces 2011, 3, 2012–2021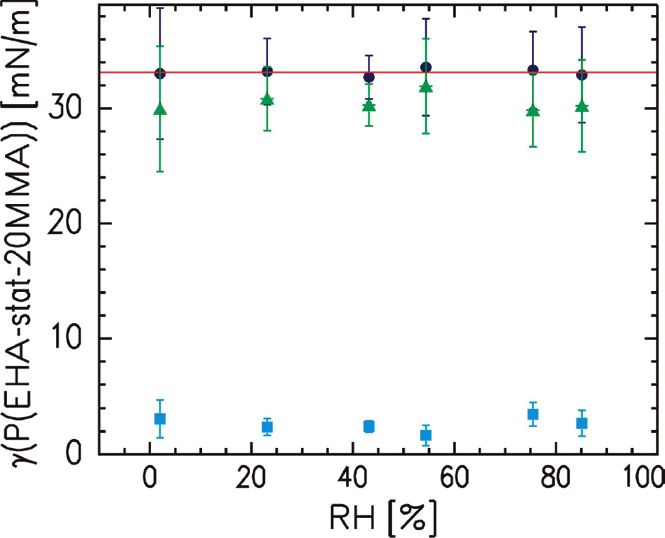
ACS Applied Materials & Interfaces                                                                                                         RESEARCH ARTICLE

Figure 5. OwensWendt plots for P(EHA-stat-20MMA) films prepared under RHs of (a) < 2, (b) 23, (c) 43, (d) 54, (e) 75, and (f) 85%. The symbols
represent the mean contact angles θf for each test liquid and the solid line is a linear fit to the data.

                                                                               stress peak at a strain of around 0.3 which is followed by a plateau
                                                                               region that converges monotonically to 0 starting from a stress
                                                                               value of approximately 0.2 N/mm2. Prominent parameters such as
                                                                               the value of the stress maximum and the tack energy are extracted.
                                                                               The latter is equal to the integral of the stress over the strain. For
                                                                               better comparison, all parameters are normalized to the values
                                                                               corresponding to a RH of 75%, for which the best tackiness is
                                                                               achieved. In this case, the absolute values of the stress maximum
                                                                               and the tack energy for the steel punch are (2.40 ( 0.34) N/mm2
                                                                               and (65.7 ( 8.9) J/m2, respectively. The errors are the standard
                                                                               deviations obtained from at least 8 measurements per sample.
                                                                                   As a result, both the stress maximum and the tack energy
                                                                               increase as a function of RH (see panels c and d in Figure 7). For
Figure 6. Polar (squares) and dispersive (triangles) components of the         the tack energies, most of the increase takes place between RHs
total surface tension of P(EHA-stat-20MMA) (circles) as a function of
the RH. The solid line marks the mean value of the total surface tension.
                                                                               of 23% and 54%. Because of the higher error bars, such details
                                                                               cannot be derived for the stress maxima. But anyhow, the stress
                                                                               maximum for the sample which is prepared under dry conditions
measuring the tackiness of samples prepared under dry condi-                   is significantly lower than those for RHs higher than 54%. This
tions as well as under a RH of 75%.                                            behavior is closely related to an increased number of cavities
   Figure 7a exemplarily shows all stressstrain curves for the                which form during detaching with increasing RH. This is
case of the sample preparation under dry conditions obtained                   illustrated in Figure 7b showing typical optical images of the
with the steel punch. For all investigated RHs, the shape is rather            punch area probed at the moment when all cavities have evolved.
typical for a non-cross-linked PSA material exhibiting a sharp                 Furthermore, when the punch material is exchanged to silicon
                                                                            2018          dx.doi.org/10.1021/am200254m |ACS Appl. Mater. Interfaces 2011, 3, 2012–2021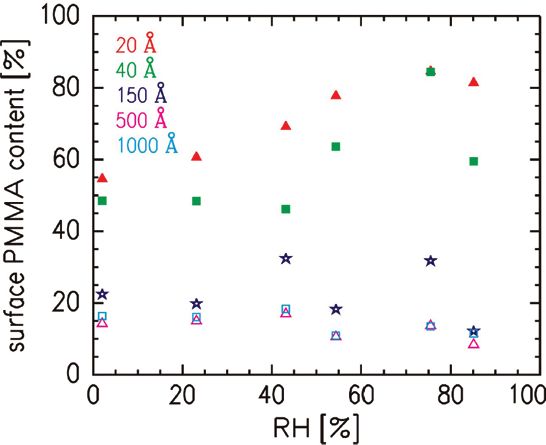
ACS Applied Materials & Interfaces                                                                                                           RESEARCH ARTICLE

Figure 7. (a) Stressstrain curves for the sample that is prepared under dry conditions. (b) Representative optical images for each sample of the
humidity series of the punch area at the moment all cavities have evolved. The RH increases in reading direction. (c) Stress peak as a function of RH
normalized to the value at a RH of 75%. Filled triangles correspond to data obtained with a steel punch and open circles are data measured with a silicon
punch. (d) Tack energy as a function of RH in analogy to panel c.

instead of steel, the trend remains the same. The amplitudes of                 ansatz may be the work by Gay and Leibler,55 who attributed the
the changes in stress maximum and tack energy, however, are                     appearance of the cavities to interfacial defects arising from the
reduced by approximately a factor of 2.                                         different length scale of the roughness of the punch compared to
   The obtained results can only be related to the installed near-              that of the PSA. They claim that the more rigid the adhesive film
surface composition profiles because the bulk material is the same               is, the more the true contact area is restricted to the summits of
for all investigated samples. Due to the small punch roughness of               the rough surfaces. Since the overall, nominal compressing
below 20 Å the main contribution originates from a thin near-                   pressure is 0.32 MPa, it is effectively higher when the true contact
surface volume,24 for which the content of the glassy component                 area is smaller. Because the XRR measurements show that the
increases monotonically as a function of RH. In accordance to the               surface roughness is almost constant as a function of RH, it can be
tack energy, the steepest increase of PMMA concentration occurs                 concluded from the increased near-surface content of the harder
between RHs of 23 and 54% (see Figure 3). For the similar sample                component for the higher RHs, that the effective contact pressure
system P(EHA-stat-acrylic acid), Lakrout and co-workers found                   increases with increasing RH. As a further consequence, also the
that the locus of the cavities is also close to the interface.54 As a           stress maximum and the tack energy increase.25
consequence, the observed increased number of cavities for the                      The same trend follows from a work by Shull and Creton in
higher RHs also reflects the higher near-surface PMMA concen-                    which the stress that is necessary to expand an existing cavity is
tration representing the less mobile component. This reduced                    calculated in terms of pressure.56 The higher the Young’s
mobility of the near-surface material limits the cavity growth,                 modulus of the material, in which the cavity is embedded, the
preventing the merging of appearing cavities. As a result, for the              more energy costly its expansion is. So again, under the assump-
higher RHs, more cavities with a smaller area are observed. This is             tion that the cavities appear close to the interface, a higher RH
also consistent with the findings of Lakrout and co-workers when                 and, thus, a higher PMMA concentration leads to an increase in
comparing the maximum average area of a cavity of pure PEHA                     tack energy.
with P(EHA-stat-acrylic acid).                                                      It has to be noted, however, that a full theoretical description is
   Moreover, the increase in the stress maximum and the tack                    still missing, even for homogeneous samples. Nevertheless, to
energy with increasing PMMA content can only be a conse-                        include near-surface composition variations in future theoretical
quence of the altered mechanical properties of the near-surface                 works might be meaningful. Furthermore, experiments about
area. An explanatory approach could be the almost linear relation               altered mechanical properties close to the interface, possibly via
between the shear storage modulus and the maximum stress,                       light scattering experiments, could be of interest.
which is demonstrated in ref 54. A direct comparison, however,                      Finally, the decreased amplitude of the effect when exchanging
remains difficult because the bulk rheological properties are not                 the punch material from steel to silicon can be understood by the
affected by a change in the near-surface composition.                            interactions of the PSA with the adherent. They affect, for example,
   It is not easy to apply existing theories about probe tack tests to          the wetting of the punch and the stickiness to the polymer although
our findings because up to now, near-surface material has not                    the surface roughness of the probe is unchanged. For silicon, the
been distinguished from bulk material. Anyhow, a promising                      ratio between the surface tension of the punch and the polymeric
                                                                            2019            dx.doi.org/10.1021/am200254m |ACS Appl. Mater. Interfaces 2011, 3, 2012–2021
ACS Applied Materials & Interfaces RESEARCH ARTICLE
components is significantly higher than for steel.57,58 Therefore, The financial support by the Deutsche Forschungsgemeinschaft
composition variations close to the surface have a bigger impact (DFG) in the projects MU 1487/6 and WI 3182/2 is gratefully
when steel is chosen as the punch material. In summary, this means acknowledged.
that for the tuning of the adhesive performance of a PSA via the RH,
also the choice of the material of the adherent plays a significant role.
’ REFERENCES
4. CONCLUSION (1) M€uller-Buschbaum, P.; Ittner, T.; Maurer, E.; K€orstgens, V.;
Petry, W. Macromol. Mater. Eng. 2007, 292, 825–834.
For the first time, the near-surface composition profiles of a (2) Retsos, H.; Gorodyska, G.; Kiriy, A.; Stamm, M.; Creton, C.
PSA model system consisting of a two component statistical Langmuir 2005, 21, 7722–7725.
copolymer (P(EHA-stat-20MMA)) is directly tuned by exposing (3) Lemieux, M.; Usov, D.; Minko, S.; Stamm, M.; Shulha, H.;
the samples to atmospheres with the appropriate relative humid- Tsukruk, V. V. Macromolecules 2003, 36, 7244–7255.
ity (RH). As a consequence, the tack energy in the extreme cases (4) Liu, X.; Ye, Q.; Yu, B.; Liang, Y.; Liu, W.; Zhou, F. Langmuir
of almost zero RH and 85% RH differ by approximately 30%. 2010, 26, 12377–12382.
A suitable preparation protocol has been developed to keep (5) Kessel, S.; Schmidt, S.; M€uller, R.; Wischerhoff, E.; Laschewsky,
the solvent evaporation speed constant and thus to isolate the A.; Kutz, J.; Uhlig, K.; Lankenau, A.; Duschl, C.; Fery, A. Langmuir 2010,
26, 3462–3467.
influence of the presence of water vapor. XRR is the ideal tool to (6) Cooperstein, M. A.; Canavan, H. E. Langmuir 2010, 26,
probe the near-surface molecular composition and gain funda- 7695–7707.
mental understanding of the impact on the macroscopic param- (7) Xie, T.; Xiao, X. Chem. Mater. 2008, 20, 2866–2868.
eters surface tension and tackiness. As a result, the content of (8) Boyne, J. M.; Millan, E .J.; Webster, I. Int. J. Adhes. Adhes. 2001,
the more polar component (PMMA) close to the sample surface 21, 49–53.
increases monotonically as a function of RH. This effect is most (9) Chivers, R. A. Int. J. Adhes. Adhes. 2001, 21, 381–388.
prominent if the mean PMMA content of the upper 20 Å is (10) Chang, T.; Sproat, E. A.; Lai, Y.; Shephard, N. E.; Dillard, D. A.
considered. If the PMMA content is averaged over a thicker near- J. Adhes. 1997, 60, 153–162.
surface region the effect gets less pronounced until it is fully lost (11) Moon, S.; Foster, M. D. Langmuir 2002, 18, 8108–8115.
when integrating over more than 500 Å. In other words, with (12) Shah, S. S.; Howland, M. C.; Chen, L.; Silangcruz, J.;
Verkhoturov, S. V.; Schweikert, E. A.; Parikh, A. N.; Revzin, A. ACS
changing the RH of the atmosphere surrounding the PSA film, Appl. Mater. Interfaces 2009, 1, 2592–2601.
the near-surface composition is altered up to a depth of 500 Å (13) Qu, L.; Dai, L.; Stone, M.; Xia, Z.; Wang, Z. L. Science 2008,
(measured from the surface). 322, 238–242.
This observation is related to the mechanical properties. The (14) Hu, S.; Jiang, H.; Xia, Z.; Gao, X. ACS Appl. Mater. Interfaces
surface tension, which was determined by the method of Owens 2010, 2, 2570–2578.
and Wendt with six test liquids, does not change as a function of (15) Nadermann, N.; Ning, J.; Jagota, A.; Hui, C. Langmuir 2010,
RH. We conclude that the interaction between the test liquids 26, 15464–15471.
and the samples exceeds the depths for which we detect a (16) Feng, X.; Meitl, M. A.; Bowen, M. A.; Huang, Y.; Nuzzo, R. G.;
pronounced modification of the composition profile. Rogers, J. A. Langmuir 2007, 23, 12555–12560.
Mechanical tack tests, however, reveal a clear dependence on (17) Cho, K.; Cho, J. H.; Yoon, S.; Park, E. P.; Lee, J.; Han, S.; Lee,
K.; Koo, J. Macromolecules 2003, 36, 2009–2014.
the near-surface PMMA concentration within a thin near-surface (18) de Crevoisier, G.; Fabre, P.; Copart, J.; Leibler, L. Science 1999,
region having a thickness close to the punch roughness. Both, the 285, 1246–1249.
stress maximum as well as the tack energy increase monotonically (19) Agirre, A.; de las Heras-Alarcon, C.; Wang, T.; Keddie, J. L.;
as a function of PMMA content and, thus, as a function of RH. Asua, J. M. ACS Appl. Mater. Interfaces 2010, 2, 443–451.
This result reflects the altered near-surface mechanical properties (20) Caquineau, H.; Menut, P.; Deratani, A.; Dupuy, C. Polym. Eng.
and is further visible by an increased number of cavities with Sci. 2003, 43, 798–808.
increasing RH. The effect gets less pronounced when a higher (21) Park, M. J.; Balsara, N. P.; Jackson, A. Macromolecules 2009, 42,
surface energy punch material like silicon is chosen. 6808–6815.
In summary, this investigation shows the influence of the RH on (22) Geldhauser, T.; Walheim, S.; Schimmel, Th.; Leiderer, P.;
the molecular structure and the mechanical properties of a PSA Boneberg, J. Macromolecules 2010, 43, 1124–1128.
(23) Klos, J. S.; Romeis, D.; Sommer, J.-U. J. Chem. Phys. 2010, 132,
model system. For the design of PSAs in special applications, this 024907.
knowledge could play a key role. In further studies it might be of (24) Diethert, A.; Peykova, Y.; Willenbacher, N.; M€uller-Buschbaum, P.
interest to focus on additional parameters such as temperature, type ACS Appl. Mater. Interfaces 2010, 2, 2060–2068.
of solvent, and solvent evaporation rate and determine to what (25) Peykova, Y.; Guriyanova, S.; Lebedeva, O. V.; Diethert, A.;
extent they can influence the near-surface composition profile. M€uller-Buschbaum, P.; Willenbacher, N. Int. J. Adhes. Adhes. 2010, 30,
245–254.
’ AUTHOR INFORMATION (26) Zosel, A. Int. J. Adhes. Adhes. 1998, 18, 265–271.
(27) Perlich, J.; Memesa, M.; Diethert, A.; Metwalli, E.; Wang, W.;
Corresponding Author Roth, S. V.; Timmann, A.; Gutmann, J. S.; M€uller-Buschbaum, P.
*Phone: þ498928912451. Fax: þ498928912473. E-mail: muellerb@ ChemPhysChem 2009, 10, 799–805.
ph.tum.de. (28) M€uller-Buschbaum, P.; Stamm, M. Macromolecules 1998, 31,
3686–3692.
(29) Abul Kashem, M. M.; Perlich, J.; Schulz, L.; Roth, S. V.; M€uller-
Buschbaum, P. Macromolecules 2008, 41, 2186–2194.
’ ACKNOWLEDGMENT
(30) Greenspan, L. J. Res. Natl. Bur. Stand., Sect. A 1977, 81, 89–96.
We thank B. Russ and P. B€oni for their assistance in the XRR (31) Braun, C. Parrat32, version 1.6; HMI Berlin: Berlin, 2002.
experiments and BASF SE for donating the polymer samples. (32) Parratt, L. G. Phys. Rev. 1954, 95, 359–369.
2020 dx.doi.org/10.1021/am200254m |ACS Appl. Mater. Interfaces 2011, 3, 2012–2021ACS Applied Materials & Interfaces RESEARCH ARTICLE
(33) Bandrup, J.; Immergut, E. H.; Grulke, E. A.; Bloch, D. Polymer
Handbook, fourth ed.; Wiley-Interscience: Hoboken, NJ, 1999.
(34) Feidenhans’l, R. Surf. Sci. Rep. 1989, 10, 105–188.
(35) Dismukes, E. B. J. Phys. Chem. 1959, 63, 312–314.
(36) Owens, D. K.; Wendt, R. C. J. Appl. Polym. Sci. 1969, 13,
1741–1747.
(37) Menke, T. J.; Funke, Z.; Maier, R.-D.; Kressler, J. Macromole-
cules 2000, 33, 6120–6125.
(38) Born, M.; Wolf, E. Principles of Optics, second ed.; Pergamon
Press: Oxford, U.K., 1964.
(39) James, R. W. The Optical Principles of the Diffraction of X-rays;
OxBow Press: Woodbridge, CT, 1962.
(40) Lekner, J. Theory of Reflection; Martinus Nijhoff Publishers:
Dodrecht, The Netherlands, 1987.
(41) Donley, J. P.; Fredrickson, G. H. Macromolecules 1994, 27,
458–467.
(42) Perlich, J.; K€orstgens, V.; Metwalli, E.; Schulz, L.; Georgii, R.;
M€uller-Buschbaum, P. Macromolecules 2009, 42, 337–344.
(43) Zhang, X.; Yager, K. G.; Kang, S.; Fredin, N. J.; Akgun, B.; Satija,
S.; Douglas, J. F.; Karim, A.; Jones, R. L. Macromolecules 2010, 43,
1117–1123.
(44) Gu, Z.; Alexandridis, P. Langmuir 2005, 21, 1806–1817.
(45) Wu, S. Org. Coat. Plast. Chem. 1971, 31, 27.
(46) Piglowski, J. M.; Bryjak, M. Eur. Polym. J. 1998, 34, 1669–1673.
(47) Erbil, H. Y.; Avci, Y. Langmuir 2002, 18, 5113–5119.
(48) Kano, Y.; Akiyama, S. Polymer 1993, 34, 376–381.
(49) Lavi, B.; Marmur, A. Colloids Surf., A: Physicochem. Eng. Asp.
2004, 250, 409–414.
(50) Staeger, M.; Finot, E.; Brachais, C.-H.; Auguste, S.; Durand, H.
Appl. Surf. Sci. 2002, 185, 231–242.
(51) Falsafi, A.; Tirrell, M.; Pocius, A. V. Langmuir 2000, 16,
1816–1824.
(52) Zosel, A. Colloid Polym. Sci. 1985, 263, 541–553.
(53) Israelachvili, J. Intermolecular & Surface Forces; Academic Press
Inc., 1991.
(54) Lakrout, H.; Sergot, P.; Creton, C. J. Adhes. 1999, 69, 307–359.
(55) Gay, C.; Leibler, L. Phys. Rev. Lett. 1999, 82, 936–939.
(56) Shull, K. R.; Creton, C. J. Polym. Sci., Part B: Polym. Phys. 2004,
42, 4023–4043.
(57) Mantel, M.; Wightman, J. P. Surf. Interface Anal. 1994, 21, 595–605.
(58) Kim, H. J.; Jang, C. E.; Kim, D. E.; Kim, Y. K.; Choa, S. H.;
Hong, S. Tribol. Lett. 2009, 34, 61–73.
2021 dx.doi.org/10.1021/am200254m |ACS Appl. Mater. Interfaces 2011, 3, 2012–2021You can also read