Possible limitations of dolphin echolocation: a simulation study based on a cross modal matching experiment - Nature
←
→
Page content transcription
If your browser does not render page correctly, please read the page content below
www.nature.com/scientificreports
OPEN Possible limitations of dolphin
echolocation: a simulation study
based on a cross‑modal matching
experiment
Chong Wei1*, Matthias Hoffmann‑Kuhnt2*, Whitlow W. L. Au3, Abel Zhong Hao Ho2,
Eszter Matrai4, Wen Feng5, Darlene R. Ketten6,7 & Yu Zhang8,9
Dolphins use their biosonar to discriminate objects with different features through the returning
echoes. Cross-modal matching experiments were conducted with a resident bottlenose dolphin
(Tursiops aduncus). Four types of objects composed of different materials (water-filled PVC pipes,
air-filled PVC pipes, foam ball arrays, and PVC pipes wrapped in closed-cell foam) were used in the
experiments, respectively. The size and position of the objects remained the same in each case. The
data collected in the experiment showed that the dolphin’s matching accuracy was significantly
different across the cases. To gain insight into the underlying mechanism in the experiments, we used
finite element methods to construct two-dimensional target detection models of an echolocating
dolphin in the vertical plane, based on computed tomography scan data. The acoustic processes of the
click’s interaction with the objects and the surrounding media in the four cases were simulated and
compared. The simulation results provide some possible explanations for why the dolphin performed
differently when discriminating the objects that only differed in material composition in the previous
matching experiments.
Dolphins use their biological sonar (biosonar) system to detect objects of interest in their environment. Their
ability to detect objects within a certain range is unique, even if or when the size of the objects is a couple of
centimetres. For instance, Atlantic bottlenose dolphins (Tursiops truncatus) can detect a stainless-steel sphere
of size 7.62 cm suspended in the water at distances further than 100 m1. They are also able to detect a 2.54 cm
diameter solid steel sphere at a distance further than 70 m2. In addition to detection, dolphins can discriminate
the features of objects, including structure, shape, material composition, and size by processing the returning
echoes. Early experimental work showed that dolphins are able to discriminate disks differing in diameter by
0.9 cm at a distance of 0.7 m3 and aluminium cylinders differing in wall thickness by 0.23 mm at a distance
of 8 m4. Dolphins can discriminate objects with various shapes such as cylinders, cubes, and s pheres5,6. Their
biosonar system can recognize the shapes of various objects based on the acoustic cues from the echoes, such
as amplitude, spectral content, highlight structure, etc. To investigate how dolphins perceive object properties
through echolocation, DeLong et al.7 conducted echoic-to-echoic (E–E) matching-to-sample (MTS) experiments
to demonstrate that dolphins use multiple features and integrate information across the reflected echoes from a
range of object orientations to identify the targets that varied in size, shape, material, and texture.
In addition to target detection and discrimination only by echolocation, Pack, Herman, and their colleagues8–11
conducted a series of cross-modal MTS experiments and presented a theory that dolphins can “see” through
1
Centre for Marine Science and Technology, Curtin University, Kent Street, Bentley, WA 6102, Australia. 2Acoustic
Research Laboratory, Tropical Marine Science Institute, National University of Singapore, 18 Kent Ridge Road,
Singapore 119227, Singapore. 3Hawaii Institute of Marine Biology, University of Hawaii, 46‑007 Lilipuna Road,
Kaneohe, HI 96744, USA. 4Research Department, Ocean Park Hong Kong, Hong Kong (SAR), China. 5School
of Information Engineering, Jimei University, Xiamen 361021, People’s Republic of China. 6Department of
Biomedical Engineering, Boston University, Boston, MA 02215, USA. 7Department of Otology and Laryngology,
Harvard Medical School, Biology Department, Woods Hole Oceanographic Institution, Woods Hole, MA,
USA. 8Key Laboratory of Underwater Acoustic Communication and Marine Information Technology of the Ministry
of Education, Xiamen University, Xiangan South Road, Xiamen 361100, People’s Republic of China. 9College of
Oceanography and Environmental Science, Xiamen University, Xiangan South Road, Xiamen 361100, People’s
Republic of China. 10Whitlow W.L. Au is deceased. *email: weichong3310@foxmail.com; mahoku@nus.edu.sg
Scientific Reports | (2021) 11:6689 | https://doi.org/10.1038/s41598-021-85063-2 1
Vol.:(0123456789)
www.nature.com/scientificreports/
sound. They suggested that dolphins could perceive shape through echoic detection, and that the representa-
tion of the object echolocated on was then also accessible to their visual sense (echoic-to-visual matching-to-
sample), then vice-versa. A variety of shapes built with polyvinyl chloride (PVC) pipes and fittings were used
in the experiments. Several bottlenose dolphins were trained to perform echoic-visual (E-V) and visual-echoic
(V-E) cross-modal MTS experiments. In the experiments, Pack and Herman’s group showed that dolphins were
able to use their echolocation sense alone to inspect a complex shaped sample object, and subsequently find
the match between several alternative objects through visual sense alone without any prior exposure to these
objects. With a variety of sample shapes the dolphins performance was significantly above chance. However,
no acoustic data (such as the dolphin’s echolocation signals, echoes reflected from the objects and the sample
box) was present in the studies by Pack and Herman’s group, making it hard to examine what information was
carried by the acoustic cues from the echoes. Furthermore, in Pack and Herman’s experiments, the PVC pipes
were all filled with dry sand to achieve negative buoyancy for immersion in water and to reduce the internal
reflections. Little is known about whether the accuracy of the successive match would be influenced when the
material composition of the objects is changed (e.g., filling different materials inside the pipes or using pipes
made by different materials). Therefore, to further investigate how the shape information might be accessible to
both the dolphins’ visual and echolocation senses, it is important for us to gain an understanding of what is the
nature of the echoes the dolphins receive from the interrogated objects, how do they utilize the features from
these echoes that provide them information about the shape, as well as whether different material compositions
would interfere with their cross-modal matching ability.
In this study, we conducted E–V cross-modal matching experiments by only varying the material composi-
tion of the objects (while the shape, size, and position of the objects remained the same). The dolphin’s matching
accuracy was found to be significantly different when he had to discriminate the objects constructed from four
different types of material compositions. The dolphin was allowed to choose his position freely in the underwa-
ter object inspection in the previous training, therefore in this study, we did not restrict his movement during
the underwater inspection, otherwise, we would not know the different matching accuracy was caused by the
restriction of his movement or by the changes of the objects’ material composition. Due to the slightly varied
position in each trial, it was extremely difficult to determine the detailed acoustic scatter field received by the
dolphin experimentally to gain insight into the experiments, a finite element analysis (FEA) was performed to
provide the visualization of the underlying physical mechanisms involved in the processes of click emission and
reception for cross-modal target discrimination.
Finite element (FE) modelling is a well-established technique that has recently become an important comple-
mentary tool for traditional experimental methods in studying the mechanism involved in sound propagation
and reception in a number of odontocete species12–16. The technique has been validated by finding the agree-
ment between the simulation results and the acoustic measurement results collected on several live odontocete
species16–18. As approximations, the models have significant advantages to provide a non-invasive way for us to
study the complex internal acoustic processes resulting from the interaction of the animals and the surrounding
media. Based on these numerical models, we have gained a deeper and more accurate understanding of the roles
of the various forehead structures in the biosonar beam formation of some odontocete s pecies13,15,17–19. With the
models at hand, we can attempt to estimate the sound propagation and reception for those species which are inac-
cessible or untrainable for experimental work, such as for neonate a nimals20. The models also enable us to obtain
the physical field information in both high temporal and spatial resolution to predict the physical processes of
acoustic interaction between the animal and the detecting targets21,22. This type of work is hard if not impossible
to investigate in experimental measurements. In this study, two-dimensional (2D) FE models were constructed
to simulate the acoustic processes of a single echolocation click emission from the phonic lips in the head of an
echolocating bottlenose dolphin, propagation through the complex internal forehead structures, transmission
via the surrounding seawater to the targets, reflection at the target, and transmission back to the animal. The
modelling data presented in this study provided insights into the reasons why the dolphin exhibited significant
differences in performances when discriminating different targets in the previous experiments.
Results
Experiment results. An adult male bottlenose dolphin named Ginsan was trained to perform E-V cross-
modal matching. Figure 1 shows the results from the experiments with Ginsan in discriminating four types of
objects where the overall shape of the object remained consistent and only the material used to create the shapes
varied: air-filled PVC pipes (AF); water-filled PVC pipes (WF); foam ball arrays (FB); soft closed-cell foam-
wrapped PVC pipes (SF). The red lines represent chance values (25% for matching with four alternatives and
50% for matching with two alternatives). Binomial tests verified that the animal performed well above chance
when the targets were air-filled PVC pipes (p < 0.01, matching accuracy at 92.7%). However, when the air-filled
PVC objects were replaced by the water-filled PVC objects, the matching accuracy dropped off significantly
(62.5% from 2 objects, p = 0.026). When foam ball arrays reconstructing the same shapes and placed in the
same positions were used, the dolphin’s performance was not significantly better than chance (p = 0.059, pure
matching accuracy at 58.3% from 2 objects). However, when the soft closed-cell foam-wrapped PVC pipes were
used as targets, the dolphin’s performance was again significantly better than chance (p < 0.01) and the matching
accuracy also rose (88.5% from 4 objects) as compared to the FB and WF cases.
Simulation results. To understand the backscatter mechanisms involved in the discrimination task for dif-
ferent type of objects, a 2D FE vertical model was used to examine the acoustic reflections from simple cylindri-
cal targets composed of different materials. A time history of the click wavefront travelling through the dolphin’s
head and the outside media was determined for each case. The wavefront at three instances (T1, T2, T3) were
Scientific Reports | (2021) 11:6689 | https://doi.org/10.1038/s41598-021-85063-2 2
Vol:.(1234567890)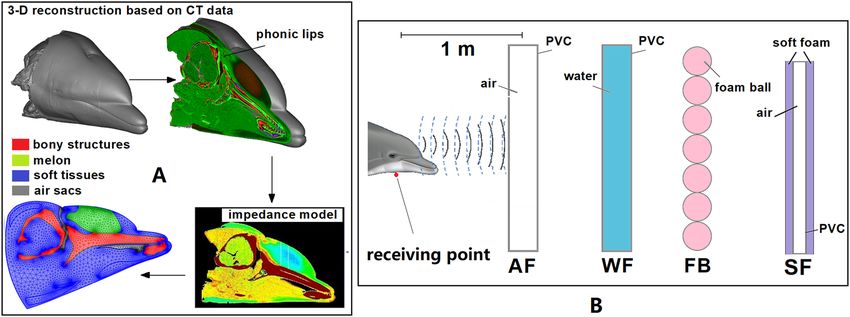
www.nature.com/scientificreports/
Figure 1. The results of E–V cross-modal matching experiments performed by the dolphin Ginsan. AF
represents the air-filled PVC pipes, WF represents the water-filled PVC pipes, FB represents the foam ball arrays,
and SF represents the soft closed-cell foam-wrapped PVC pipes. The experiment data for each case is provided
in Supplementary Table S1.
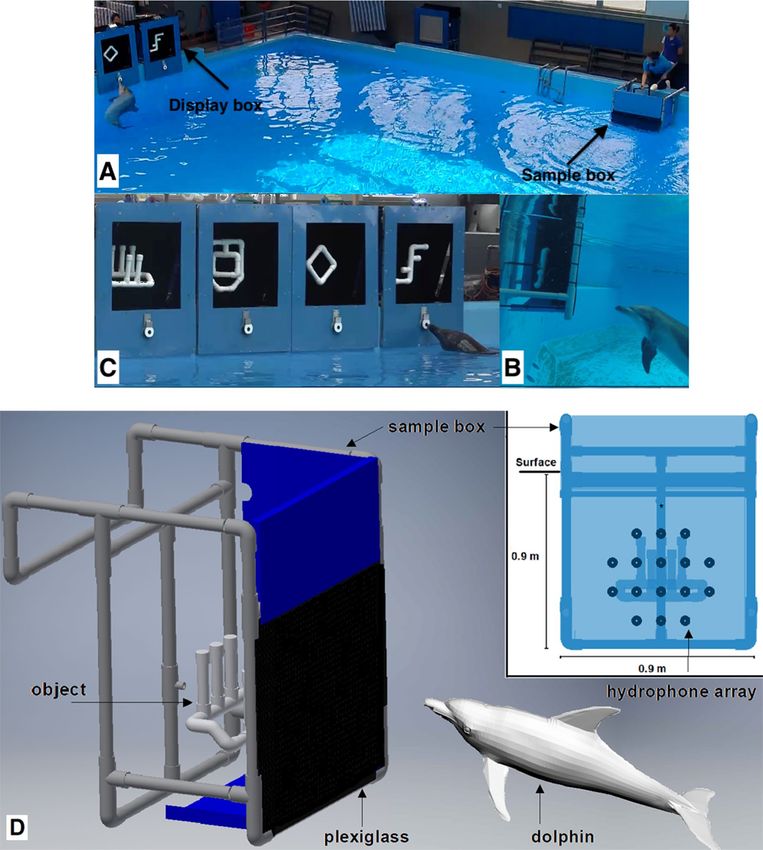
captured from the data and are shown in Fig. 2. They depict the changes in the wavefront as the clicks travelled
through the four objects and the echoes were formed.
T1 shows the instant that an echolocation click being emitted from the animal’s head and propagating towards
the objects. The wavefront at the moment before the signals hit the objects in all the cases were exactly the same.
The directivity index (DI) and 3-dB beamwidth of the simulated beam in the far-field was 24.4 dB and 11.1°,
respectively. T2 shows the instant the click arrived at the interfaces of the objects with the adjacent media. In the
AF case, due to the large acoustic impedance mismatch between water and air, the click was completely reflected
by the air inside the PVC pipe. In the WF case, the click travelled through the PVC pipe and most of the click
energy was transmitted through the PVC pipe, whereas very little energy was reflected by the back face (away
from the dolphin) of the PVC pipe. Overall, this resulted in a weak echo (see Fig. 2C) returning to the dolphin in
the WF case. The ratio between echo level and emitted click level at 0.5 m from the dolphin’s sound source was
only − 23.1 dB in this case. In the FB case, a clear pattern of interference was observed due to both the acoustic
properties and the shape of the foam balls. The sound waves were reflected and scattered in all directions by the
FB structure. In the SF case, some of the sound wave energy was reflected by the outer closed-cell foam mate-
rial (water-closed-cell foam interface), while the remaining portion of the click went through the closed-cell
foam material and was reflected by the air inside the PVC pipe. T3 shows the instant in which the echoes were
transmitted back to the animal in each case. In the AF case, there was an echo (− 9.1 dB between echo level and
emitted click level at 0.5 m from the dolphin’s sound source) formed mostly due to reflection at the PVC-air
interface (due to presence of air inside the PVC pipe). The returning echo had only one main beam with a 3-dB
beamwidth of approximately 16.2°. In the WF case, the echo was reflected as it travelled through two layers of
the PVC pipes, resulting in the main beam with a 3-dB beamwidth of approximately 14.4°. The intensity of the
echo was low (− 23.1 dB) since most of the energy was radiated into the water when the sound waves travelled
through the pipe. In the FB case, multiple sidelobes were clearly observed in the beam pattern of the resultant
echo as each part of the object scattered and reflected sound energy into different directions. In the SF case, the
echo was significantly stronger than that of the WF case (− 10.2 dB between echo level and emitted click level
at 0.5 m from the dolphin’s sound source) and had a beam pattern very close to that of the AF case, albeit with
a slightly larger echo duration (118.4 μs) than the echo in the AF case (77.6 μs), suggesting a close resemblance
to the AF case.
The peak-to-peak amplitudes of the transmitted clicks were normalized according to the highest peak-to-peak
amplitude to obtain relative amplitudes. Figure 3A shows one of the transmitted clicks recorded in the AF case
with a centroid frequency as approximately 80 kHz. Note that Fig. 3A only shows an example of the recorded
transmitted signal emitted by Ginsan in one of the AF trials, characteristics of the clicks emitted by Ginsan
varied slightly from trial to trial. Figure 3B displays the waveform and corresponding spectra of the transmitted
click at the instant of T1 in Fig. 2A. The centroid frequency of the click is approximately 68 kHz. The waveform
and frequency spectra of echoes received by the dolphin closest to the lower jaw in four cases were compared,
as shown in Fig. 3C,D. The amplitude of the waveforms was relative to the highest absolute amplitude in the AF
case. The amplitude of the spectra was relative to the highest absolute amplitude (0 dB) in the AF case. The overall
amplitudes of the WF and FB cases were significantly lower than that of the AF and SF cases. The waveform of
the SF case had two clear highlight peaks, separated by ~ 30 μs (Fig. 3C). The first peak was formed due to the
reflection when the click reached the water-closed-cell foam interface. The rest of energy was transmitted through
Scientific Reports | (2021) 11:6689 | https://doi.org/10.1038/s41598-021-85063-2 3
Vol.:(0123456789)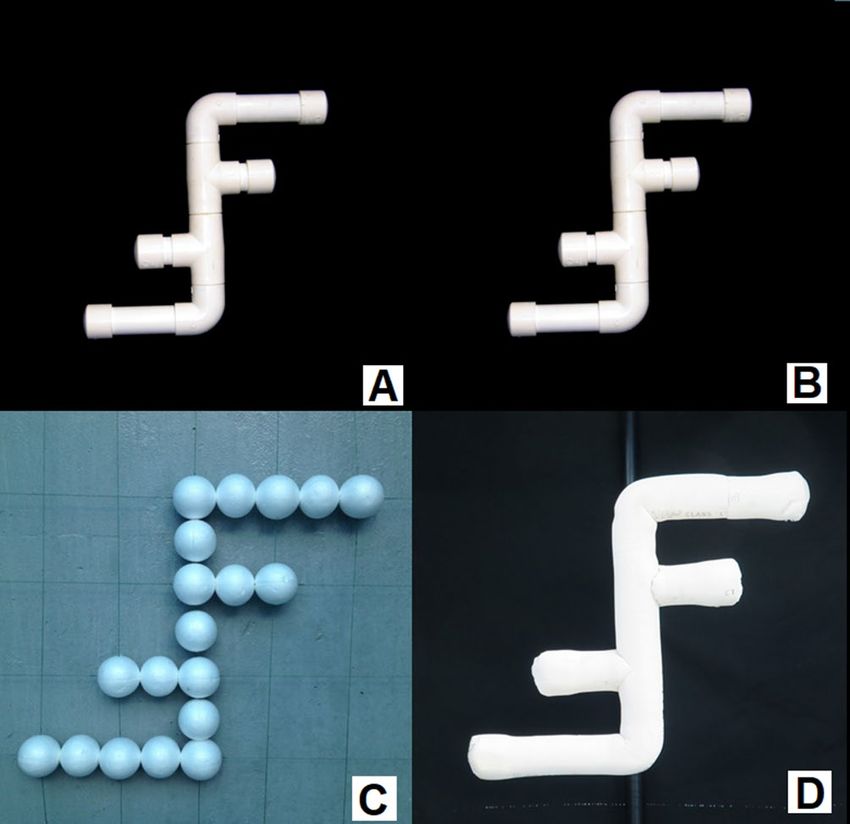
www.nature.com/scientificreports/

                                           Figure 2.  The time history of the click wavefront interacting with the object in each case. Colour bars display
                                           the relative sound pressure values which were normalized according to the maximum sound pressure value of
                                           the AF case. (A) T1 shows the instant where the clicks were travelling through seawater before interacting with
                                           the objects. (B) T2 shows the instant when the clicks were reflected and refracted by the four objects. (C) T3
                                           shows the instant when the echoes were formed by the objects, transmitting back to the dolphin at a distance
                                           of 0.5 m from the dolphin’s sound source in the four cases. The corresponding beam pattern of the echo in each
                                           case is plotted in the bottom panel. The detailed acoustic processes from T2 to T3 for each case are provided in
                                           Supplementary Video S1.

          Scientific Reports |   (2021) 11:6689 |              https://doi.org/10.1038/s41598-021-85063-2                                                     4

Vol:.(1234567890)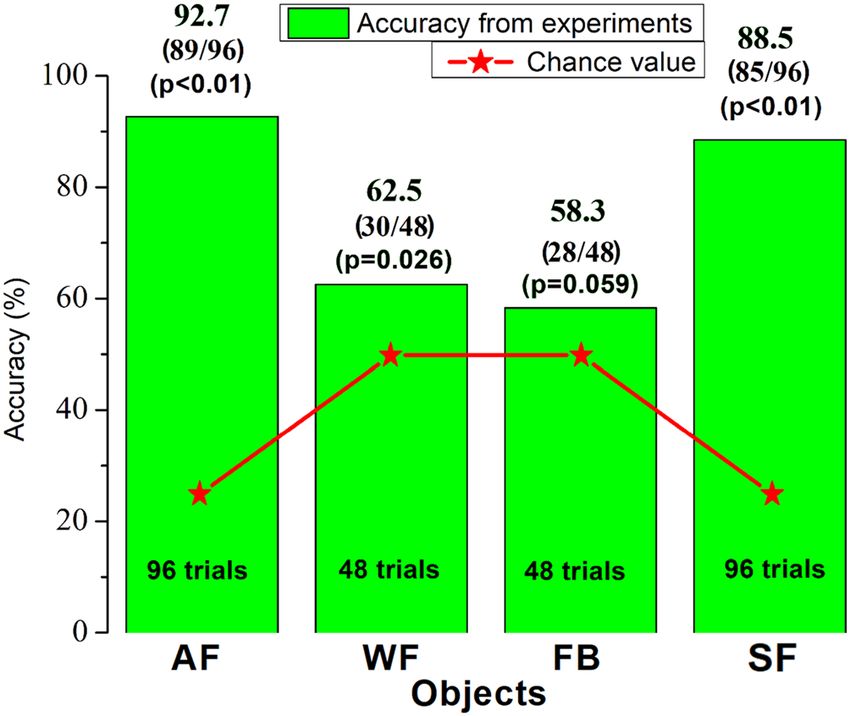
www.nature.com/scientificreports/

                                 Figure 3.  The recorded signals and simulated signals. (A) The waveform and corresponding spectra of a
                                 single transmitted click from a click train recorded in the AF trial. (B) The waveform and corresponding
                                 transmitted click at the instant of T1 from the model. Comparisons of simulated receiving echo waveforms (C)
                                 and frequency spectra (D) of four cases. The simulated signal data for each case is provided in Supplementary
                                 Table S2.

Scientific Reports |   (2021) 11:6689 |              https://doi.org/10.1038/s41598-021-85063-2                                                  5

                                                                                                                                         Vol.:(0123456789)
www.nature.com/scientificreports/
Figure 3. (continued)
Energy flux density (dB re 3-dB beamwidth
1 μPa2 s) Duration (μs) Centroid frequency (kHz) RMS bandwidth (kHz) (degree)
AF 170.0 77.6 61.2 20.4 16.2
WF 144.6 206.4 74.8 20.0 14.4
FB 164.6 114.4 67.4 24.0 1.9
SF 170.0 118.4 61.5 20.5 18
EC 174.3 65.6 59.9 19.8 11.1
Table 1. Energy flux density, duration, centroid frequency, RMS bandwidth, and 3-dB beamwidth of the
simulated receiving echoes in each case, as well as the five parameters of the emitted click (EC) at 1 m away
from the phonic lips in the model.
the closed-cell foam, it then reached closed-cell foam-PVC interface and PVC-air interface, creating the second
peak. Figure 3D shows that the frequency spectra of the receiving echoes in the AF and SF cases were close, most
energy were in the range between 40–125 kHz. The two highlight peaks in the waveform of SF case appeared in
the spectra as an interference effect at frequencies around 70 to 80 kHz. By contrast, some interference patterns
can be clearly observed in the spectra of the WF and FB cases. In the WF case, a small amount of the incident
signals was reflected by the two boundaries of the PVC pipes, showing a distinct multipath effect. In the FB case,
due to the geometry of the foam balls, the boundary of each foam ball reflected the incident signals and caused
superposition in the echoes. To quantify the feature of the waveforms, we calculated the energy flux density,
duration, centroid frequency, RMS bandwidth, and 3-dB beamwidth of the simulated receiving echo (Fig. 3C,D)
for each case. The comparison is shown in Table 1.
When receiving echoes, the dolphin’s ears act as an energy detector by integrating sound energy over a short
time window (approximately 264 μs)23. To obtain the energy within this short time window, we calculated the
energy flux density of the receiving echoes for the four cases, as shown in Table 1. In addition, to make our simu-
lation results comparable to most previous studies in odontocetes, the echo duration was estimated as − 10 dB
criterion relative to the amplitude envelope24. From Table 1, compared to the AF and SF cases where the dolphin
had better matching performances, the echoes in the WF and FB cases (where the dolphin had lower matching
accuracies) had higher centroid frequencies but lower energy flux densities. The echo in the WF case had the
lowest energy flux density (144.6 dB re 1 μPa2 s) among all cases, while the energy flux densities of the echoes in
the AF and SF cases were essentially the same (~ 170.0 dB re 1 μPa2 s). The durations of the AF (77.6 μs) and FB
(114.4 μs) cases were shorter than those of the WF (206.4 μs) and SF (118.4 μs) cases since there was only one
Scientific Reports | (2021) 11:6689 | https://doi.org/10.1038/s41598-021-85063-2 6
Vol:.(1234567890)www.nature.com/scientificreports/
major reflection from the air in the PVC pipe (AF) and the interface of foam balls (FB). The two main reflections
created superposition in the receiving echoes of the WF and SF cases, resulting in longer durations. The centroid
frequency and RMS bandwidth of the echoes in the AF case were close to those in the SF case.
Discussion
The FE modelling technique used in this study suggests a way to account for the difference in the dolphin’s ability
(Fig. 1) to match objects with different material compositions in the E-V cross-modal matching experiments. The
dolphin was able to correctly perform the E-V matching when the received echoes had higher intensity (Table 1)
and less sidelobes (Fig. 2C), such as the ones in the AF and SF cases. Additionally, the AF and SF cases indicate
that the sound waves were mostly reflected at the interfaces between two media where a high acoustic impedance
mismatch was present, such as the PVC-air interface and water-closed-cell foam interface, then directly reflected
back to the animal. The thickness of the PVC pipe is only 3 mm, plus the acoustic impedance mismatch of water
vs. PVC is significantly lower than that of PVC vs. air, therefore the reflection at the water-PVC interface is rela-
tively limited in the AF case. The sound field received by the dolphin after reflection off the object, arises due to
the combined effect of the backscatter from the length of the pipes rather than due to a specular reflection from
a single point alone. When the object was filled with water (WF case), most of the energy of the incident sound
waves was transmitted through the object due to better impedance match, therefore less was reflected (approxi-
mately 10 dB re 1 µPa lower than the AF case in Fig. 3D), and the reflecting sound waves were mainly coming
from two water-PVC interfaces, probably causing the dolphin to not be able to match water-filled objects in an
E-V cross-modal matching-to-sample setup. In the FB case, a complex acoustic scattered field was formed due
to the acoustic properties and the shape of the foam balls. This then in turn means that spurious aliases would
probably appear to the dolphin making the detection of the “real” reflective points at least very difficult if not
impossible. This would suggest an explanation of the dolphin’s inability to match the foam ball version of the
objects. Therefore, the complex acoustic scattered field formed by weak echoes with multiple reflections could
interfere with the dolphin’s ability to perceive the shape. The animal probably was not able to fully interpret the
information and may not have been able to match the shape between his echolocation sense and his visual sense.
In other words, the dolphin could not find the relationship between what he “saw” in the water via its echoloca-
tion sense and what he saw via visual sense in the air.
Regarding the cross-modal experiments in our research, we have trained two bottlenose dolphins (Ginsan
and Angelo) for the cross-modal matching task, but most of the data were collected from Ginsan due to limited
research availability to Angelo. Both of them were able to perform cross-modal matching using the air-filled
PVC targets with high matching accuracy, but only Ginsan was trained for matching using targets with different
material compositions. High-frequency hearing loss may be common in older d olphins25 but Ginsan was about
10 years old at the time. He would also have shifted his centre frequency in sound production if he had high-
frequency hearing loss26. However, the peak frequencies produced by Ginsan from most of our recording data
were between 50–130 kHz. Therefore, Ginsan was unlikely to have high-frequency hearing loss and it was not a
potential factor causing him to display a low matching accuracy in discriminating the WF and FB objects. Com-
plex psychophysiological studies such as cross-modal matching-to-sample are often limited to the involvement
of a single subject due to its training cost. Given the complexity of the task the learning process could take years
depending on the subject’s training experience, research experience, etc. Training and testing more individuals
will help us get a deeper understanding of dolphin cross-modal matching ablility. However, the point of this study
was to show the capability of the dolphin in cross-modal matching, not to investigate the average performance
of dolphins. This would only be feasible with a large number of dolphins available for training and testing, that
was not the case here (and rarely is at any facility).
For most dolphin species, the beam pattern of the projected biosonar beam is significantly narrower than
their vision. For example, the 3-dB beamwidth of the bottlenose dolphins is around 10°3. It would not allow the
dolphins to have an entire target inspection within a short distance, the dolphins may have to scan sideways and
up and down to build up the complete shape information. From the videos we recorded in the experiments, the
top view camera captured that the dolphin slightly and quickly scanned sideways in front of the sample box in
some trials. In addition, a bottlenose dolphin is able to steer its biosonar beam up to 18 degrees in the horizon-
tal plane by altering the forehead s hape27. Therefore, the head movement and beam steering ability could have
helped Ginsan increase the scanning range to get more information about the object. However, from the side
view cameras, we did not observe significant up and down head movement when the dolphins were scanning
in the experiments. The potential reason could be the experiment setup, specifically the scanning position of
the dolphin in the water. During the training for E-V cross modal experiments, Ginsan was allowed to choose
any position in front of the sample box to echolocate on the sample object. We observed that most of the time
he chose to stay at the bottom left side of the sample box during the underwater inspection. The reason is most
likely related to dolphin’s adaptation to the experiment setup. The sample box was fixed at one side of the pool
and a thin piece of opaque plexiglass was mounted between the animal and the sample object. With this projec-
tion angle (from the bottom left side of the box), Ginsan could effectively reduce the noise reflected from the
plexiglass and the wall of the pool behind the sample box, as well as increase the scanning area.
We used a piece of opaque plexiglass instead of using eyecups to block the dolphin’s vision in the experi-
ments. This was done to avoid the dolphin seeing the object when the eyecups accidentally drop under water
and especially to eliminate the potential external interference caused by taking off the eyecups between the
echolocation inspection and visual matching. With respect to the different numbers of alternative objects used
in the experiments, we used a set of four alternative objects for the WF and FB cases in the initial trials, the
same as for the AF and SF cases. When two alternative objects were used for Ginsan, he could match the sample
based on “If it is not this one then it must be the other one” strategy. This strategy would not work if the number
Scientific Reports | (2021) 11:6689 | https://doi.org/10.1038/s41598-021-85063-2 7
Vol.:(0123456789)www.nature.com/scientificreports/
of the alternative objects was more than two. However, the matching accuracies of the WF and FB cases were
both very low when either two or four alternative objects were used. In addition, the number of trials of the AF
and SF cases (n = 96) is higher than that of the WF and FB cases (n = 48). Ginsan was at the testing facility only
for limited time at Ocean Park, plus the major task of our major project was to study how the dolphins success-
fully performing cross-modal matching, therefore, we spent most of our efforts on the E-V and V-E tasks using
“air-filled” objects. During his years of working with us, Ginsan’s cross-modal matching ability was tested under
multiple conditions focusing on his cognitive processes. These experiments were carried out independently,
i.e., the water filled targets were tested in a course of a different sub-project than the foam targets. While the
projects were planned with a consideration of the overall understanding of the underlying mechanism of the
dolphin biosonar, each experiment were designed to each task separately, which explains the overall difference
in the use of the four targets.
The four cases were conducted in the different periods of our project (see Table S1). The recording setups
varied during the years, for instance, we started with using a single hydrophone on the front side of the sample
box and the number of hydrophones had been increasing to 16 during the years, as well as the biteplate hydro-
phone was only used in several testing trials. Therefore, it is difficult to directly use the recording data from the
experiment to acoustically localize the dolphin or compare the differences in the signals among cases. Further-
more, due to the fact that the dolphin’s inspection position was not fixed, the angles and distances of the echoes
reflected by both the sample object and the frame of the sample box changed from trial to trial, making it not
straightforward to directly infer the hydrophone recorded signals as the dolphin’s perspective of the scattered
field. A separate study is ongoing investigating the beamforming using recorded signals (only using data from
the AF trials). This paper only focuses on using numerical models to study the backscattered field caused by
the interaction between the dolphin clicks and the targets. Collecting more acoustic data for other three cases
will be an important future work to further study this topic. In addition, the major objective of our research
was shape discrimination through echolocation. The objects we used all consisted of complex shapes and were
not limited to a sphere or single cylinder, therefore, target strength did not provide all the information required
to differentiate various shapes. The dolphin’s biosonar beam is highly directional16,28 and Ginsan was allowed
to choose the inspection location freely in the trials, thus the target strength varied across different angles and
distances of signal emission. Moreover, our object shape were designed to have equal reflective surface area with
the intention of having pairs of objects with similar target strength for the dolphin to discriminate. For example,
the left two objects in Fig. 4C were designed to have a similar target strength while the other two objects in the
right were designed as another pair. This was implemented to deter the dolphin from using only target strength
to discriminate between objects and required the dolphin to have more information regarding the actual shape
in order to distinguish the different objects.
It should be noted that the four 2D cylindrical shapes used in the simulations only represent the simple
version of the actual objects used in the cross-modal experiment. The reflection from the actual objects in the
experiment would certainly be more complex because features of the shape extend in the third dimension and
echo returns from different locations on the object could return to the dolphin at the same point in time. Addi-
tionally, the models focus only on the target discrimination process in the vertical plane. However, despite the
limitations, it is noteworthy that the 2D simulations presented in this study can provide crucial information with
high temporal and spatial resolution to illustrate fundamental acoustic behaviours. Even though this study used
currently available limited computational resources, it still leads to a better understanding of why the dolphins
perceive differently when they discriminate targets with different material compositions. Scaling this analysis
into a three-dimensional (3D) model would incur a massive computational cost, and it was not feasible with the
available resources. However, optimizing our models to perform a 3D analysis is a very important work to be con-
sidered in the future, it would provide a more complete understanding of the entire acoustic processes and obtain
a closer representation of the information dolphin receives when echolocating on a stimulus concealed in a box.
Methods
E–V cross‑modal matching experiments. An adult male Indo-Pacific bottlenose dolphin named Gin-
san was trained to perform an echoic-to-visual cross-modal MTS experiment in this study. Ginsan was born at
Ocean Park Hong Kong (OPHK) and had been involved in acoustic and cognitive studies since 2005. Ginsan
was housed with 14 other dolphins in the Marine Mammal Breeding and Research Centre (MMBRC) of OPHK.
The experiment was conducted in one of the six interconnected pools of MMBRC (L 17 m, W 20 m and D 4 m),
as shown in Fig. 4A–C. Research sessions were conducted three times daily, coinciding with the dolphin’s feed-
ing time. The research with the dolphin was approved by the Institutional Animal Care and Use Committee
(IACUC) of both the National University of Singapore and OPHK, all experiments were performed in accord-
ance with relevant guidelines and regulations. Furthermore, the study was carried out in compliance with the
ARRIVE guidelines29.
An object with a complex shape was used as the sample stimulus and concealed in a sample box (0.9 m × 0.9 m)
under water. The box and the objects were constructed using PVC pipes and fittings. Schedule 40 pipes with a
thinner wall thickness were used to construct all the objects and Schedule 80 pipes with a thicker wall were used
to build the sample box. To block the dolphin’s vision of the objects, a 3 mm opaque black plexiglass sheet, which
was acoustically transparent in water, was placed on the front side of the box between the sample object and
dolphin. A hydrophone array with 16 Teledyne Reson TC-4013 hydrophones was mounted directly behind the
plexiglass to record the acoustic signals (the black dots in Fig. 4D). The TC-4013 hydrophone is an omnidirec-
tional hydrophone with a frequency range from 1 Hz ~ 170 kHz, and the receiving sensitivity is − 211 dB ± 3 dB
re 1 V/µPa. The recorded signals were also used to identify whether Ginsan sent echolocation clicks or not when
he was inspecting the sample object in the water. After the dolphin had inspected the sample object echoically
Scientific Reports | (2021) 11:6689 | https://doi.org/10.1038/s41598-021-85063-2 8
Vol:.(1234567890)www.nature.com/scientificreports/
Figure 4. The echoic-to-visual cross-modal matching-to-sample experiment setup. (A) The positions of
the sample box and display boxes. In the experiments, the resident dolphin used echolocation sense alone to
inspect the sample object in the water on the right side of the pool, then swam up to the air and only used visual
sense to match the sample on the left side of the pool. (B) Underwater echolocation inspection. The dolphin
was echolocating on the object in front of the sample box under the water. (C) Visual matching in air. The
dolphin was selecting the alternative object. (D) A 3D illustration of the experiment setup under the water. An
acoustically transparent thin plexiglass (indicated in black colour in the 3D figure) was mounted on the front
side of the sample box to ensure that dolphin cannot see the object inside the box. A planar hydrophone array
with 16 hydrophones was placed right behind the plexiglass. A sample object was concealed in the sample box.
The distance from the sample object to the dolphin was about 1 m. The recorded experiment processes are
provided in Supplementary Video S2.
(Fig. 4B), the alternatives (up to four) that had been mounted in display boxes prior to each trial were revealed
to the visual sense of the dolphin in air (Fig. 4C). Only one alternative physically matched the sample object. The
sample object and the alternative objects were changed for each trial. Four cameras including two underwater
cameras were used to record the entire process of each trial. The matching accuracy was also logged and saved
for further analysis.
To test the ability of the dolphin to recognize the objects constructed of different materials in the cross-modal
experiments, four types of objects (air-filled PVC pipe, water-filled PVC pipe, foam ball array, soft closed-cell
foam-wrapped PVC pipe) were used respectively for both sample object and alternative objects in the trials. An
example of the objects using the FF-shape is shown in Fig. 5. For the air-filled PVC pipe (AF object, see Fig. 5A),
the diameter of the pipes was 4.8 cm, the thickness of the pipes was around 3 mm, and the air was sealed inside
Scientific Reports | (2021) 11:6689 | https://doi.org/10.1038/s41598-021-85063-2 9
Vol.:(0123456789)www.nature.com/scientificreports/
Figure 5. Examples of sample objects, FF-shape, with different material compositions. (A) The air-filled PVC
pipe object. (B) The water-filled PVC pipe object. (C) The foam ball array object. (D) The soft closed-cell foam-
wrapped PVC pipe object. The objects used in the experiments were constructed in four types of shape and
made of four materials. They are all shown in Fig. 4C, from left to right: OP-shape, DL-shape, SQ-shape, and
FF-shape. More details about objects’ shapes and names for each case are provided in Supplementary Figure S1.
the PVC pipes. For the water-filled PVC pipes (WF object, see Fig. 5B), the same PVC pipes were filled with water.
The exterior appearance of the WF objects and the AF objects were exactly the same. For the foam ball arrays
(FB object, see Fig. 5C), multiple foam balls of 4.8 cm diameter were arranged on 1 mm mono-filament lines to
form the same overall shapes as the AF objects. For the soft closed-cell foam-wrapped PVC pipe (SF object, see
Fig. 5D), an air-filled PVC pipe was wrapped by a thin layer of material (closed-cell foam). The SF objects were
constructed in the same overall shape and size as the AF objects but with a smaller diameter PVC pipe (16 mm).
In the experiment, the alternative objects were also made of the different materials, so they were consistent
with the sample object in each case. A binomial test was used to statistically analyse the experimental results
and determine whether Ginsan’s matching performance was significant or not. A significance level of 5% was
adopted for hypothesis testing (p = 0.05).
Numerical modelling and data analysis. The numerical model was constructed based on high-reso-
lution computed tomography (CT) scan data of the head of a bottlenose dolphin which was provided by the
Biology Department of Woods Hole Oceanographic Institution (WHOI). After reviewing the research protocol,
approval from IACUC for handling and examining the cadaveric specimens was granted by the Animal Use
Committee of the WHOI, all experiments were performed in accordance with relevant guidelines and regula-
tions. The Mimics 10.1 (Materialise, Belgium) software was used for the (CT) data analysis and 3D geometrical
model reconstruction, as shown in Fig. 6A. The details of the reconstruction method can be found in the previ-
ous work from Wei et al.18, in which CT data was combined with physical measurements of animal tissues to
reconstruct an acoustic impedance model for a bottlenose dolphin’s head. A slice which was closest to the mid-
line of the head that cut through the right side of the phonic lips was selected to create a 2D numerical model in
the vertical plane, as shown in Fig. 6A.
The 2D impedance models were imported to COMSOL Multiphysics modelling software (Stockholm, Swe-
den) for FEA and corresponding data analysis. The simulation data was exported from the COMSOL and the
figures were plotted by Origin Lab-OriginPro software (Wellesley, MA). The FE model simulated the processes
of the click emission and propagation from the internal biological structures to the external media, as well as the
transmitted click’s interaction with the test objects in the vertical plane. There were three main parts included
in the FE models: the head of an echolocating bottlenose dolphin, the surrounding seawater, and the object.
In the vertical FE model, the head of the dolphin contained the structures such as the right side of phonic lips,
melon, blubber, brain, musculature, mandibular fat, connective tissue, maxilla, mandible, vestibular sac, nasal
passage, and premaxillary sac. The four cylindrical shaped targets depicted in Fig. 6B were considered in the
FE models, as simplified versions of the actual objects used in the MTS trials. The objects were simulated at a
distance of 1.1 m from the dolphin’s sound source in each case. The sizes of the objects set in all the four cases
matched those used in the experiments. For the blubber, muscle, mandibular fat, melon, connective tissue, and
bony structures, the sound velocity and density values were referenced from previous work 18. For the media
outside the dolphin’s head, the average values of salinity and temperature of the seawater measured in the pool
Scientific Reports | (2021) 11:6689 | https://doi.org/10.1038/s41598-021-85063-2 10
Vol:.(1234567890)www.nature.com/scientificreports/
Figure 6. The reconstruction of four FE models. (A) The impedance model was reconstructed based on a
slice cut through the phonic lips in the vertical plane from high-resolution CT data. The impedance model
was imported into the FE software for meshing. (B) The FE models were used to simulate a bottlenose dolphin
discriminating four 2D representation of cylindrical-shaped targets. The red dot is the receiving point close to
the lower jaw of the dolphin.
Seawater PVC material Foam ball material Soft closed-cell foam material
Sound velocity (m/s) 1527 2218 500 1700
Density (kg/m3) 1022 1350 300 330
Table 2. The material properties of the seawater, PVC material, foam ball material, and soft closed-cell foam
material used in the simulation.
during the experiment were 33.3 ppt and 22.8 ℃, respectively. Therefore, the sound velocity and density values
of seawater in the model were set accordingly to obtain results as close as possible to the actual experiments. The
sound velocity and density values of the seawater, PVC material, foam ball material, and soft closed-cell foam
material were shown in Table 2 30,31. A receiving point was added in the FE models close to the lower jaw of the
dolphin3 in each case to monitor the simulated reflected echo from the objects, as shown in Fig. 6B.
In the simulation, the model was meshed into second-order triangular elements using COMSOL’s free mesher.
The meshing layouts are displayed in Fig. 6A. We performed a mesh refinement analysis for the models to find
the optimal element size that can obtain the solution with sufficient numeric precision. Finally, the element size
for the model was set as at least ten elements per wavelength of the peak frequency of the excitation signal at
source ( = cwater /fp ), where cwater is the sound speed of the seawater (1527 m/s). fp is the peak frequency of
the source signal. According to the previous measurements3,32,33, bottlenose dolphins emit signals with lower
peak frequencies (30–60 kHz) for target detection in the tanks, therefore the peak frequency was set as 60 kHz,
then the wavelength is 0.02545 m. The low-reflecting boundary condition34 was applied to simulate the trans-
mission of a single echolocation click and its backscattering from the objects, without considering the effect of
reverberation from the boundaries.
In the previous studies by Wei et al.16,18, the FEA was used to simulate a single click emitted in the head of a
bottlenose dolphin which then transmitted from the near acoustic field to the far acoustic field in both the vertical
and horizontal plane. The models were confirmed and validated with actual biosonar signal measurements in
signal characteristics and beam patterns on and around the heads of the live bottlenose d olphins16,18. The cur-
rent work employed the same methods by performing the transient time domain finite element computation.
The time steps were set as 0.8 μs to obtain a very detailed sound transmission and reception process. Madsen
et al.35,36 found that the right phonic lip is the site at which the echolocation clicks are generated. Consequently,
the sound source was placed at the right phonic lips in the models. In the sagittal section of the CT data, the
size of the right phonic lips was approximately 3–4.5 mm, which was significantly smaller than the wavelength
(25.5 mm) in the model. Thus, we decided to use a point source to model the source region for the vertical FE
models. A short-duration broadband pulse with an RMS bandwidth of 37.7 kHz was generated at the source
location of the FE model as sound source excitation. The equation of the pulse can be written as:
2 f 2 (t−t )2
Qm = −Ae−2π 0 p sin(2πf0 t) (1)
Scientific Reports | (2021) 11:6689 | https://doi.org/10.1038/s41598-021-85063-2 11
Vol.:(0123456789)www.nature.com/scientificreports/
1 1
tp − < t < tp + (2)
f0 f0
where A is the pulse amplitude (Pa), f0 is the centre frequency (Hz), tp is the time from the onset of the signal to
its peak amplitude (s), and t is the time (s). The time of this pulse has to satisfy Eq. (2).
Since the sound pressure of the backscatter from the four objects were different, to better display the directiv-
ity in Fig. 2, the sound pressure values were normalized with respect to the highest values in each respective case.
The sound pressure values were then converted into dB scale (SPL = A + 20log10P), where P is the normalized
peak-to-peak sound pressure of the signal at each point, and A is a constant. The beam patterns of the returning
echoes were plotted by determining the SPL of an echo reflecting from the centre of each object over a circle
with a radius of 0.5 m in each case.
Conclusions
Early work has shown that dolphins can perceive the shape of objects composed by dry sand-filled PVC pipes
through echolocation and match that information through the visual s ense8–11. However, whether changing the
material composition of the objects would still provide enough information for the animal to discriminate the
objects in a cross-modal matching setup had not been studied to date. To address this question, we trained a
bottlenose dolphin to perform E–V cross-modal match-to-sample experiments using four types of objects dif-
fering only in material composition, but not in shape. The results showed that the dolphin was unable to match
the water-filled PVC and foam ball array versions of the objects. To visualize the complex acoustic process and
study the underlying physical mechanism, simplified CT based FE models were developed. The simulation results
indicate that the excessive scattering of the incident acoustic field on the object, or formation of the low intensity
acoustic field from multiple weak reflections, was most likely the reason for the dolphin’s inability to perceive
and match the shape for these trials.
The study also speculates the possible reason for dolphins mistakenly swallowing plastic objects in the water,
which could provide important information for studying ocean plastic pollution impacts on cetaceans in the
future. Plastic pollution is posing threats to marine animals including cetaceans. A recent study has examined
the stranded cetaceans including different species of whales, dolphins, and porpoises in I reland37. Their post-
mortem examinations reported that 8.5% of these animals had plastics, which are unable for them to digest
or excrete, in the digestive tracts. Plastic bags and other non-degradable objects could trap or choke dolphins,
especially young animals. Dolphins can generally discriminate between plastic and food, but plastics can be
swallowed accidentally38. The WF case studied in our study may shed some light on why the dolphins could
mistakenly swallow plastics (e.g., plastic bags filled with water, small plastic bottles filled with water) even they
have echolocation. Dolphins are likely to use both visual and echolocation sense simultaneously, to recognize
objects with a relatively higher a ccuracy39, when there is enough light in the water. Acoustic cues (e.g., amplitude,
highlight structure, frequency content, etc.) play important roles in their cross-modal target discrimination. As
those plastics filled with water, it may interfere with dolphin’s ability to target discrimination, especially for the
younger dolphins40 whose acoustic structures are not fully formed. For example, the lipid components in the
animal’s melons change with growth, a previous study showed that no significant gradient of sound velocity or
density was found in the heads of a neonate and a one-year-old juvenile finless p orpoises41. More evidence needs
to be collected to provide conclusive results.
Data availability
All data generated or analysed during this study are included in this published article (and its Supplementary
Information files).
Received: 27 May 2020; Accepted: 22 February 2021
References
1. Au, W. W. L. & Snyder, K. J. Long-range target detection in open waters by an echolocating Atlantic Bottlenose dolphin (Tursiops
truncatus). J. Acoust. Soc. Am. 68, 1077–1084 (1980).
2. Murchison, A. E. Detection range and range resolution in echolocating Bottlenose porpoise (Tursiops truncatus). In Animal Sonar
Systems (eds Busnel, R. G. & Fish, J. F.) 43–70 (Plenum, 1980).
3. Au, W. W. L. The Sonar of Dolphins (Springer, 1993).
4. Au, W. W. L. & Pawloski, D. A. Cylinder wall thickness difference discrimination by an echolocating Atlantic bottlenose dolphin.
J. Compar. Physiol. 170, 41–47 (1992).
5. Nachtigall, P. E., Murchison, A. E. & Au, W. W. L. Cylinder and cube discrimination by an echolocating blindfolded bottlenose
dolphin. In Animal Sonar Systems (eds Busnel, R. G. & Fish, J. F.) 945–947 (Plenum, 1980).
6. Au, W. W. L., Schusterman, R. D. & Kersting, A. Sphere-cylinder discrimination via echolocation by (Tursiops truncates). In Animal
Sonar Systems (eds Busnel, R. G. & Fish, J. F.) (Plenum, New Tork, 1980).
7. Delong, C. M., Au, W. W. L., Lemonds, D. W., Harley, H. E. & Roitblat, H. L. Acoustic features of objects matched by an echolocat-
ing bottlenose dolphin. J. Acoust. Soc. Am. 119, 1867–1879 (2006).
8. Herman, L. M. & Pack, A. A. Echoic-visual cross-modal recognition by a dolphin. In Marine Mammal Sensory Systems (eds Thomas,
J. A. et al.) 709–726 (Plenum Press, 1992).
9. Herman, L. M., Pack, A. A. & Hoffmann-Kuhnt, M. Seeing through sound: Dolphins (Tursiops truncatus) perceive the spatial
structure of objects through echolocation. J. Compar. Physiol. 112, 292–305 (1998).
10. Pack, A. A. & Herman, L. M. Sensory integration the bottlenosed dolphin: immediate recognition of complex shapes across the
senses of echolocation and vision. J. Acoust. Soc. Am. 98, 722–733 (1995).
Scientific Reports | (2021) 11:6689 | https://doi.org/10.1038/s41598-021-85063-2 12
Vol:.(1234567890)www.nature.com/scientificreports/
11. Pack, A. A., Herman, L. M., Hoffmann-Kuhnt, M. & Branstetter, B. K. The object behind the echo: Dolphins (Tursiops truncatus)
perceive object shape globally through echolocation. Behav. Proc. 58, 1–26 (2002).
12. Aroyan, J. L. Three-dimensional modeling of hearing in Delphinus delphis. J. Acoust. Soc. Am. 110, 3305–3318 (2001).
13. Aroyan, J. L., Cranford, T. W., Kent, J. & Norris, K. S. Computer modeling of acoustic beam formation in Delphinus delphis. J.
Acoust. Soc. Am. 92, 2539–2545 (1992).
14. Krysl, P., Cranford, T. W., Wiggins, S. M. & Hildebrand, J. A. Simulating the effect of high-intensity sound on cetaceans: Modeling
approach and a case study for Cuvier’s beaked whale (Ziphius cavirostris). J. Acoust. Soc. Am. 120, 2328–2339 (2006).
15. Cranford, T. W., Trijoulet, V., Smith, C. R. & Krysl, P. Validation of a vibroacoustic finite element model using bottlenose dolphin
simulations: The dolphin biosonar beam is focused in stages. Bioacoustics 23, 161–194 (2014).
16. Wei, C., Au, W. W. L. & Ketten, R. D. Modeling of the near to far acoustic fields of an echolocating bottlenose dolphin and harbor
porpoise. J. Acoust. Soc. Am. 147, 1790–1801 (2020).
17. Wei, C., Au, W. W. L., Ketten, R. D., Song, Z. & Zhang, Y. Biosonar signal propagation in the harbor porpoise’s (Phocoena phocoena)
head: The role of various structures in the formation of the vertical beam. J. Acoust. Soc. Am. 141, 4179–4187 (2017).
18. Wei, C., Au, W. W. L., Ketten, R. D. & Zhang, Y. Finite element simulation of broadband biosonar signal propagation in the near-
and far-field of an echolocating Atlantic bottlenose dolphin (Tursiops truncatus). J. Acoust. Soc. Am. 143, 2611–2620 (2018).
19. Wei, C., Au, W. W. L., Song, Z. & Zhang, Y. The role of various structures in the head on the formation of the biosonar beam of the
baiji (Lipotes vexillifer). J. Acoust. Soc. Am. 139, 875–880 (2016).
20. Wei, C., Song, Z., Au, W. W. L., Zhang, Y. & Wang, D. A numerical evidence of biosonar beam forming of a neonate Yangtze finless
porpoise (Neophocaena asiaeorientalis). J. Comput. Acoust. 26, 1850009 (2018).
21. Feng, W., Zhang, Y. & Wei, C. A study on the asymmetric cylinder wall thickness difference discrimination by dolphins. J. Acoust.
Soc. Am. 144, 1018–1027 (2018).
22. Feng, W., Zhang, Y. & Wei, C. A biosonar model of finless porpoise (Neophocaena phocaenoides) for material composition dis-
crimination of cylinders. J. Acoust. Soc. Am. 146, 1362–1370 (2019).
23. Au, W. W. L., Moore, P. W. & Pawloski, D. A. Detection of complex echoes in noise by an echolocating dolphin. J. Acoust. Soc. Am.
83, 662–668 (1988).
24. Wahlberg, M. et al. Source parameters of echolocation clicks from wild bottlenose dolphins (Tursiops aduncus and Tursiops
truncatus). J. Acoust. Soc. Am. 130, 2263–2274 (2011).
25. Houser, D. S. & Finneran, J. J. Variation in the hearing sensitivity of a dolphin population obtained through the use of evoked
potential audiometry. J. Acoust. Soc. Am. 120, 4090–4099 (2006).
26. Ibsen, S. D., Au, W. W. L., Nachtigall, P. E., Delong, C. M. & Breese, M. Changes in signal parameters over time for an echolocating
Atlantic bottlenose dolphin performing the same target discrimination task. J. Acoust. Soc. Am. 122, 2446–2450 (2007).
27. Moore, P. W., Dankiewicz, L. A. & Houser, D. S. Beamwidth control and angular target detection in an echolocating bottlenose
dolphin (Tursiops truncatus). J. Acoust. Soc. Am. 124, 3324–3332 (2008).
28. Finneran, J. J., Mulsow, J., Branstetter, B. K., Moore, P. W. & Houser, D. S. Nearfield and farfield measurements of dolphin echoloca-
tion beam patterns: No evidence of focusing. J. Acoust. Soc. Am. 140, 1346–1360 (2016).
29. Percie Sert, N. et al. The ARRIVE guidelines 2.0: UPDATED guidelines for reporting animal research. PLoS Biol. 2, 2 (2020).
30. Winterwerp, J. C. & Kranenburg, C. Fine Sediment Dynamics in the Marine Environment (Elsevier, 2002).
31. Patrick, S. G. Practical Guide to Polyvinyl Chloride (Rapa Technology, 2005).
32. Evans, W. E. Echolocation by marine delphinids and one species of fresh-water dolphin. J. Acoust. Soc. Am. 54, 191–199 (1973).
33. Hol, W. A. & Kamminga, C. Investigations on cetacean sonar I. Some results on the threshold detection of hollow and solid spheres
per- formed by the Atlantic bottlenose dolphin, Tursiops truncatus. Aq. Mamm. 72, 41–64 (1979).
34. Bérenger, J. P. A perfectly matched layer for the absorption of electromagnetic waves. J. Compar. Physiol. 114, 185–200 (1994).
35. Madsen, P. T., Wisniewska, D. & Beedholm, K. Single source sound production and dynamic beam formation in echolocating
harbour porpoises (Phocoena phocoena). J. Exp. Biol. 213, 3105–3110 (2010).
36. Madsen, P. T., Lammers, M., Wisniewska, D. & Beedholm, K. Nasal sound production in echolocating delphinids (Tursiops trun-
catus and Pseudorca crassidens) is dynamic, but unilateral: Clicking on the right side and whistling on the left side. J. Exp. Biol.
216, 4091–4102 (2013).
37. Lusher, A. L., Hernandez-Milian, G., Berrow, S., Rogan, E. & O’Connor, I. Incidence of marine debris in cetaceans stranded and
bycaught in Ireland: Recent findings and a review of historical knowledge. Environ. Pollut. 232, 467–476 (2018).
38. Walker, W. A. & Coe, J. M. Survey of marine debris ingestion by odontocete cetaceans In Proceedings of the Second International
Conference on Marine Debris 2–7 April 1989, Honolulu, Hawaii (eds. Shomura, R. S. & Godfrey, M. L.) 747–774 (U.S. Dept. of
Commer. NOAA Tech. Memo. NMFS, NOAA-TMNMFS-SWFSC-154,1990)
39. Harley, H. E., Roitblat, H. L. & Nachtigall, P. E. Object representation in the bottlenose dolphin (Tursiops truncatus): Integration
of visual and echoic information. J. Exp. Psychol. Anim. Behav. Proc. 22, 164–174 (1996).
40. Baird, R. W. & Hooker, S. K. Ingestion of plastic and unusual prey by a juvenile harbour porpoise. Mar. Pollut. Bull. 40, 719–720
(2000).
41. Wei, C. et al. Acoustic property reconstruction of a neonate Yangtze finless porpoise’s (Neophocaena asiaeorientalis) head based
on CT Imaging. PLoS ONE 10, e0121442 (2015).
Acknowledgements
The authors would like to thank the trainers at the OPHK, for training the dolphins and data collection. One
of the authors, Wei. C is supported by a Forrest Research Foundation Fellowship. Support for D. Ketten for this
effort was provided by the Joint Industry Programme and by the Helmholtz Foundation. This work was also sup-
ported by the Hawaii Institute of Marine Biology (HIMB) contribution No. 1630 and School of Ocean and Earth
Science and Technology (SOEST) contribution No. 9452. We thank Hari Vishnu from the National University
of Singapore for the valuable discussion. We are also grateful to Shuai Yang from Xiamen University, China, for
the support of data analysis.
Author contributions
C.W., M.H.–K., and W.W.L.A. conceived this research; M.H.–K. and E. M. conducted experiments and prepared
the associated experiment data and Figs. 4,5; C.W. performed numerical simulation; C.W., A.H.Z.H., and W.F.
analysed data; D.K. provided CT scan data; M.H.–K. revised the writing; M.H.–K. and Y.Z. provided numerical
modelling software; and C.W. drafted the manuscript. All authors contributed to reviewing and revising the
manuscript.
Scientific Reports | (2021) 11:6689 | https://doi.org/10.1038/s41598-021-85063-2 13
Vol.:(0123456789)You can also read