INVESTOR PRESENTATION - First Quarter 2015 - WPT Industrial REIT
←
→
Page content transcription
If your browser does not render page correctly, please read the page content below
INVESTOR PRESENTATION
First Quarter 2015

                        1
Forward-Looking Statements
Certain statements in this presentation may constitute "forward-looking" statements which involve known and unknown risks, uncertainties and other factors which may cause the actual
results, performance or achievements of WPT Industrial Real Estate Investment Trust (“WPT REIT” or the “REIT"), or industry results, to be materially different from any future results,
performance or achievements expressed or implied by such forward-looking statements. When used in this presentation, such statements use such words as "may", "would", "could",
"will", "intend", "expect", "believe", "plan", "anticipate", "estimate" and other similar terminology. These statements reflect the REIT's current expectations regarding future events and
operating performance including the REIT’s future growth potential, results of operations, future prospects and opportunities, demographic and industry trends and future legislative and
regulatory approaches with respect to matters affecting the REIT and speak only as of the date of this presentation. Forward-looking statements involve significant risks and
uncertainties, which include, but are not limited to the factors discussed under “Forward-Looking Statements” and "Risk Factors" in the REIT’s annual information form for the year
ended December 31, 2014, the “AIF” and should not be read as guarantees of future performance or results, and will not necessarily be accurate indications of whether or not such
results will be achieved. Forward looking statements are necessarily broad on a number of estimates and assumptions that, while considered reasonable by management of the REIT
as of the date of this presentation, are inherently subject to significant business, economic and competitive uncertainties and contingencies; therefore, the REIT cannot assure investors
that actual results will be consistent with these forward-looking statements. These forward-looking statements are made as of the date of this presentation and are expressly qualified in
their entirety by this cautionary statement. Subject to applicable securities laws, the REIT assumes no obligation to update or revise them to reflect new events or circumstances.

This presentation does not constitute or form part of any offer for sale or solicitation of any offer to buy or subscribe for any securities nor shall it or any part of it form the basis of or be
relied on in connection with, or act as any inducement to enter into, any contract or commitment whatsoever. The information contained in this presentation concerning the REIT and its
affiliates does not purport to be all-inclusive or to contain all the information that a prospective purchaser or investor may desire to have in evaluating whether or not to make an
investment in the REIT. The information is qualified entirely by reference to the AIF.

This presentation includes certain financial measures such as funds from operations (“FFO”), adjusted funds from operations (“AFFO”) and net operating income (“NOI”) that are not
measures recognized under International Financial Reporting Standards (“IFRS”) and do not have standardized meanings prescribed by IFRS. FFO, AFFO and NOI are supplemental
measures of a Canadian real estate investment trust’s performance and the REIT believes they are relevant measures of the ability of the REIT to earn and distribute cash returns to
investors in the Units and to evaluate the REIT’s performance. The IFRS measurement most directly comparable to FFO, AFFO and NOI is net income. Tables reconciling such non-
IFRS financial measures are available in this presentation and in the AIF.

All currency in U.S. dollars

                                                                                                                                                                                                      2
48 institutional-quality properties
                                        benefiting from US economic
                                        recovery

                                        Listed on TSX (WIR.U) and
                                        OTCQX (WPTIF)
ONLY Canadian REIT                      • 18.5 million Units outstanding
focused exclusively on
U.S. industrial real estate
                                        Distributions in US funds
                                        • Current $0.70/Unit annualized
                                        • Strong yield as US$ strengthens

               Targeting Disciplined but Aggressive Growth                    3
Investment Highlights
1 Focused on distribution sub-segment of U.S. industrial
real estate market
2 High-quality, stabilized and geographically diverse
portfolio in major distribution markets
3 Aligned and experienced management and
majority-independent board of trustees
4 Platform for accretive growth in a fragmented market
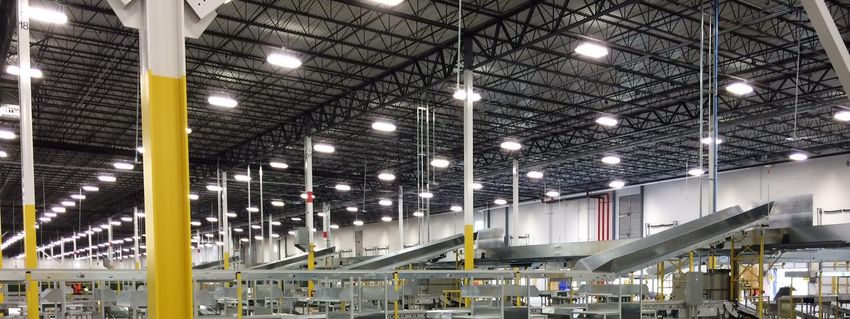
3003 Reeves Road
Indianapolis, Indiana
GLA: 741,100 sq. ft.
Ceiling height: 36 feet
4 4
Well-Aligned Manager

Retained Interest

 47.3 %
Path to internalization
  §   Automatic at $750 million in equity
      market capitalization

                                                               1105 Northfield Drive
                                                                 Indianapolis, Indiana
                                                                      GLA: 526,200 sq. ft.
                                                                     Ceiling height: 32 feet

                          Proven Experienced Management Team                          5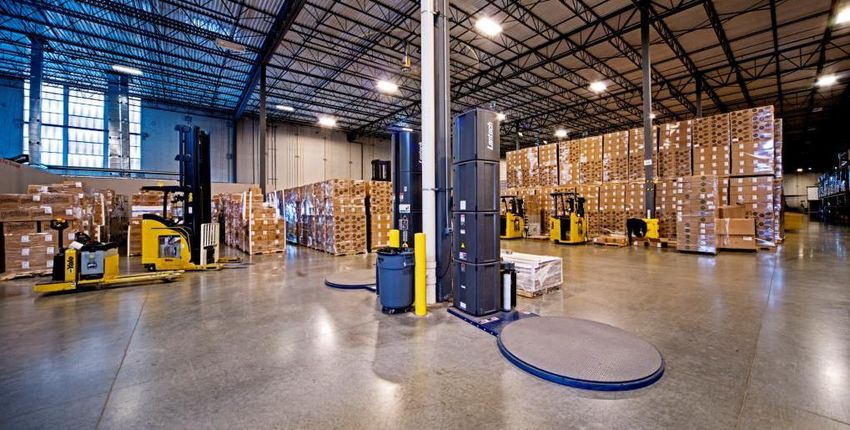
Strong and Stable
United States
Industrial Market

                        600 Hartman Industrial Crt.
                                 Atlanta, Georgia
                                    GLA: 525,600 sq. ft.
                                   Ceiling height: 32 feet

                    6                               6
Strong Market Fundamentals

1   Substantial E-commerce supply chain growth is driving
    significant demand for state-of-the-art distribution buildings

2   Non-discretionary household goods

3   Sector is benefiting from US economic recovery

4   Build-to-suit & speculative development activity is occurring

5   Significant tenant investment in properties
                                                                                              100 West
                                                                                  Thomas P Echols Drive
                                                                                            Louisville, KY
                                                                                           GLA: 936,000 sq. ft.
                                                                                          Ceiling height: 32 feet

                         Increasing Demand for Warehouse and Distribution Space                           7
Current Portfolio

48
Properties

15.1M
sq. ft. of GLA

                 Strategically Located in Key Distribution Markets             8
1
Institutional-Quality Portfolio

 Average Clear Ceiling Heights
                                          2
                                                  31           feet

 Average Asset Age
                                                  13           Years

     Average Building Size
                                      2

                                                  321,000                         Sq.Ft.

1.
     Average Tenant Size

      As of March 31, 2015
                                  2

                                                  195,000                         Sq.Ft.
2.    Industrial assets only

                               State-of-the-Art Warehouse and Distribution Properties      9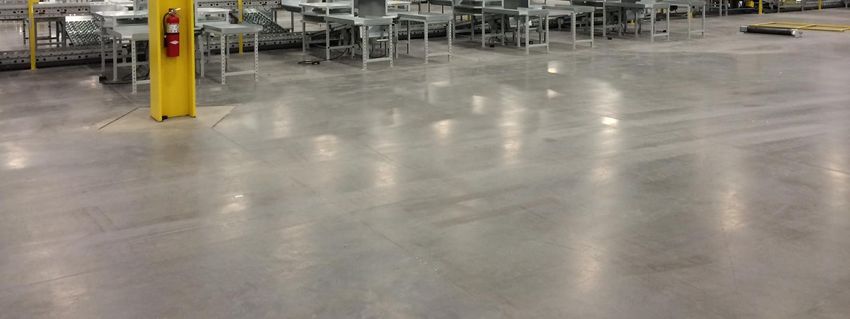
High-Quality Tenant Base
Top 10 Industrial Tenants*

                                         (%) of Total   Remaining Lease
Tenant                   GLA Occupied   Portfolio GLA    Term (Years)                Sector

General Mills              1,512,552       10.02%            5.17         Consumer Products

Unilever                   1,262,648       8.36%             8.25         Consumer Products

Honeywell                  754,000         4.99%             3.76         Consumer Products

OSP Group                  741,092         4.91%             1.42            Online Retailer

Zulily                     737,471         4.88%             2.17            Online Retailer

United Stationers          654,080         4.33%             2.34         Consumer Products

CEVA Logistics             648,750         4.30%             1.17                  Logistics

Amazon.com                 572,000         3.79%             4.34            Online Retailer

Ebay                       543,512         3.60%             2.08            Online Retailer

Life Science Logistics     394,200         2.61%             5.25                Healthcare

                           7,820,305       51.80%            4.05
*As of March 31, 2015

                                            Stable and Diversified Tenant Mix                  10
Financial Overview
6766 Pontius Rd.
Cincinnati, Ohio
GLA: 754,000 sq. ft.
Ceiling height: 35 feet
11Consistent Growth Since IPO
Q1 2014 Q2 2014 Q3 2014 Q4 2014 Q1 2015
(US$,000 except per Unit amounts)
Investment properties 12,847 13,846 15,227 15,431 16,386
revenue
NOI 9,432 10,480 11,610 11,796 12,452
FFO 5,928 6,541 7,431 7,623 7,990
AFFO 4,816 5,155 6,234 6,363 6,697
AFFO per Unit $ 0.202 $ 0.188 $0.212 $0.216 $0.207
Property acquisitions make significant contribution 12Strong Balance Sheet & Liquidity Position
As of March 31, 2015
Total Debt to GBV 50.8%
Weighted Average Effective Interest Rate 3.8%
Weighted Average Mortgage Term-to-Maturity 5.7 yrs
Interest Coverage Ratio 3.3 times
Fixed Charge Coverage Ratio 2.9 times
AFFO Payout Ratio – Q1 2015* 88.1%
* AFFO Payout Ratio would have been 81.3% if Memphis acquisition was included as of January 1, 2015
$46.6 Million bought deal equity offering in Q1 2015 13Well-Balanced Mortgage Portfolio
Mortgage Maturities by Year
100,000
87,111
90,000
Weighted Average Maturities ($ in thousands)
80,000
Mortgage Term-to-Maturity 70,000
5.7 years
60,000 52,498
50,011
50,000
33,295
40,000
23,161 31,481 25,762
30,000
20,000 1,590 1,913 8,863
10,000
-
2015 2016 2017 2018 2019 2020 2021 2022 2023 2024
Capitalizing on Low Interest Rate Environment 14Staggered Lease Maturity Profile
Lease Expiration (% of GLA) by Year
25.0%
20.3%
20.0%
17.8%
17.2%
Weighted Average 16.3%
Remaining Lease Term 15.0% 13.6%
4.2 years 10.0%
5.0%
2.2%
6.7%
3.5%
2.4%
0.0%
2015 2016 2017 2018 2019 2020 2021 2022 2023 +
Leases
expiring 5 19 14 16 10 11 6 3 7
Limited Near-Term Tenant Turnover 15Growth Strategies
6579 West 350 North
Indianapolis, Indiana
GLA: 629,200 sq. ft.
Ceiling height: 32 feet
16Proven Growth Strategies
Internal Growth: External Growth:
• Contractual rent increases • Strong acquisition pipeline
• Rolling rents to market upon renewals • Institutional relationships
• Increased occupancies • Proven track record of sourcing,
completing and integrating acquisitions
• Effective asset & property management
• Strategic debt placement & refinancing
17Summary
1 Focused on distribution sub-segment of U.S. industrial
real estate market
2 High-quality, stabilized and geographically diverse
portfolio in major distribution markets
3 Aligned and experienced management and
majority-independent board of trustees
4 Platform for accretive growth in a fragmented market
3003 Reeves Road
Indianapolis, Indiana
GLA: 741,100 sq. ft.
Ceiling height: 36 feet
18 18APPENDIX
19Board of Trustees
Independent Audit CG&N1
Trustee Real Estate/Board Experience
Trustee Committee Committee
Robert Wolf § Principal, RTW Capital Corporation (CHAIR)
Lead Trustee § Former CFO, RioCan REIT Ÿ Ÿ
§ Independent Consultant
Milo Arkema
§ Former Accountant, Baker Tilly Virchow Krause, LLP Ÿ Ÿ
§ Commissioner, Ontario Securities Commission
Sarah Kavanagh § Former Vice Chair, Co-Head, Diversified Industry Group,
Scotia Capital
Ÿ Ÿ
§ Former VP, Real Estate, bcIMC (CHAIR)
Charles Swanson
§ Former Director, SilverBirch Hotels & Resorts Ÿ Ÿ
§ Founding Principal, Great Gulf Group of Companies
Harry Rosenbaum
§ Partner, Ashton Wood Homes Ÿ Ÿ
§ Partner, Almanac Realty Investors LLC
Andrew Silberstein
§ Former CIO and COO of Stoltz Real Estate Ÿ
Scott Frederiksen § CEO, Welsh Property Trust LLC
Chair of the Board § 26 years with Welsh organization
1.Compensation, Governance and Nominating
Majority-Independent Board with Extensive Real Estate & Financial Experience 20Asset and Property Management
Asset Management Property Management (% of revenue)
§ 0.25% of GBV § 2% on single-tenant industrial
§ 3% on multi-tenant industrial
Acquisition
§ 4% on office
§ 1.0% on first $100M
§ 0.75% on next $100M Construction Management
§ 0.5% over $200M § 5% on non-maintenance capital projects >$100,000
No Performance Incentives Term
§ No AFFO hurdle § Initial term of 5 years plus 5 year renewal option
§ Automatic internalization at $750 million equity
market capitalization
No disposition, financing, leasing or development fees
No employees directly billed to REIT
Aligned Fee Structure 21You can also read