Investor Overview
    October 2020
←
→
Page content transcription
If your browser does not render page correctly, please read the page content below

Investor Overview
October 2020
SAFE HARBOR DISCLOSURE

This presentation contains forward-looking statements within the meaning of the U.S. Private Securities Litigation Reform Act of 1995. The words “anticipate,” “expect,” “believe,” “will,” “may,”
“should,” “estimate,” “project,” “outlook,” “forecast” or other similar words are used to identify such forward-looking statements. However, the absence of these words does not mean that the statements
are not forward-looking. The forward-looking statements represent NETGEAR, Inc.’s expectations or beliefs concerning future events based on information available at the time such statements were made
and include statements regarding: NETGEAR’s future operating performance and financial condition, including expectations regarding continued profitability and cash generation; expectations regarding
continuing market demand for the Company’s products and the Company’s ability to respond to this demand; the timing, distribution, sales momentum and market acceptance of recent and anticipated
new product introductions that position the Company for growth and market share gain; and expectations regarding NETGEAR's paid subscriber base growth. These statements are based on management's
current expectations and are subject to certain risks and uncertainties, including the following: uncertainty surrounding the duration and impact of the global COVID-19 pandemic; future demand for the
Company's products may be lower than anticipated; the Company may be unsuccessful, or experience delays, in manufacturing and distributing its new and existing products; consumers may choose not to
adopt the Company's new product offerings or adopt competing products; the Company may be unable to continue to grow its number of registered users, its number of registered app users and/or its paid
subscriber base; product performance may be adversely affected by real world operating conditions; the Company may fail to manage costs, including the cost of developing new products and
manufacturing and distribution of its existing offerings; the Company may fail to successfully continue to effect operating expense savings; changes in the level of NETGEAR's cash resources and the
Company's planned usage of such resources, including potential repurchases of the Company’s common stock; changes in the Company's stock price and developments in the business that could increase
the Company's cash needs; fluctuations in foreign exchange rates; and the actions and financial health of the Company's customers, including the Company’s ability to collect receivables as they become
due. Further, certain forward-looking statements are based on assumptions as to future events that may not prove to be accurate. Therefore, actual outcomes and results may differ materially from what is
expressed or forecast in such forward-looking statements. Further information on potential risk factors that could affect NETGEAR and its business are detailed in the Company's periodic filings with the
Securities and Exchange Commission, including, but not limited to, those risks and uncertainties listed in the section entitled “Part II - Item 1A. Risk Factors” in the Company's quarterly report on Form 10-Q
for the fiscal quarter ended June 28, 2020, filed with the Securities and Exchange Commission on July 31, 2020. Given these circumstances, you should not place undue reliance on these forward-looking
statements. NETGEAR undertakes no obligation to release publicly any revisions to any forward-looking statements contained herein to reflect events or circumstances after the date hereof or to reflect the
occurrence of unanticipated events, except as required by law.
All product and company names herein are or may be trademarks of their respective owners.

Q3’20 HIGHLIGHTS

Quarterly Revenue Of $378.1 Million

44% Share in U.S. Retail WiFi Market1

49% Share in U.S. Retail Switch Market2

16 Million Registered Users Worldwide

7.7 Million Registered App Users Worldwide

369,000 Service Subscribers

1 TheNPD Group, Inc., U.S. Weekly Retail Tracking Service, Networking Devices: Gateways, Range Extenders and Routers; Cellular ready technology: exclude 3G, 4G,
5G, Dual Band 3G/4G, LTE; Network Connectivity: exclude DSL and Powerline; Wireless; based on dollar sales, June 28, 2020 - Sept. 26, 2020.
2The NPD Group, Inc., U.S. Weekly Retail Tracking Service, Networking Devices, Switches, based on dollar sales, June 28, 2020 - Sept. 26, 2020.

O U R   M I S S I O N

    Be the innovative leader in
connecting the world to the internet.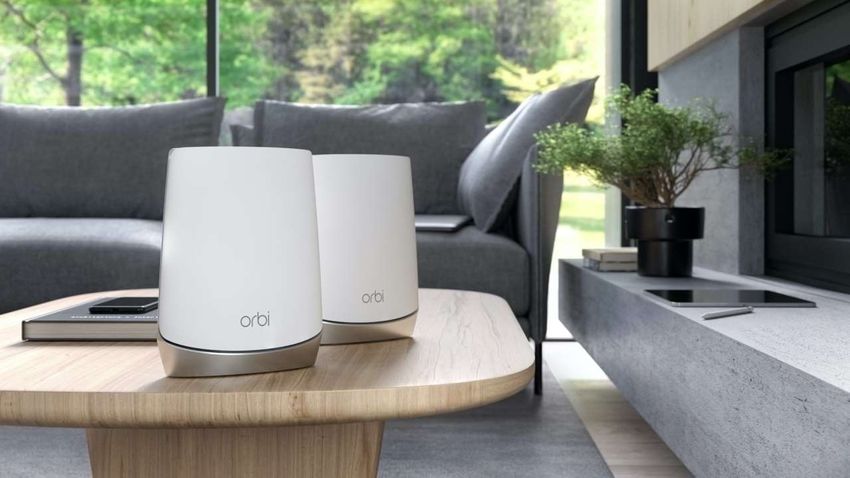
Life revolves
                                    around the
                                      Internet
                                                                         10 Gig

Tri-band Mesh                         Virtual                     10/100Gig/MultiGig
                                   experiences
                                     displace
                Sharing Moments                      Pro AV
                                     physical
                                   experiences
                                                                     WiFi 6 Mesh APs
5G - mmWave
                                  All enabled by
                                   leading edge
                Lag-free Gaming      WiFi and      Home Offices

                                     Ethernet
   WiFi 6                          technologies                        PoE+/u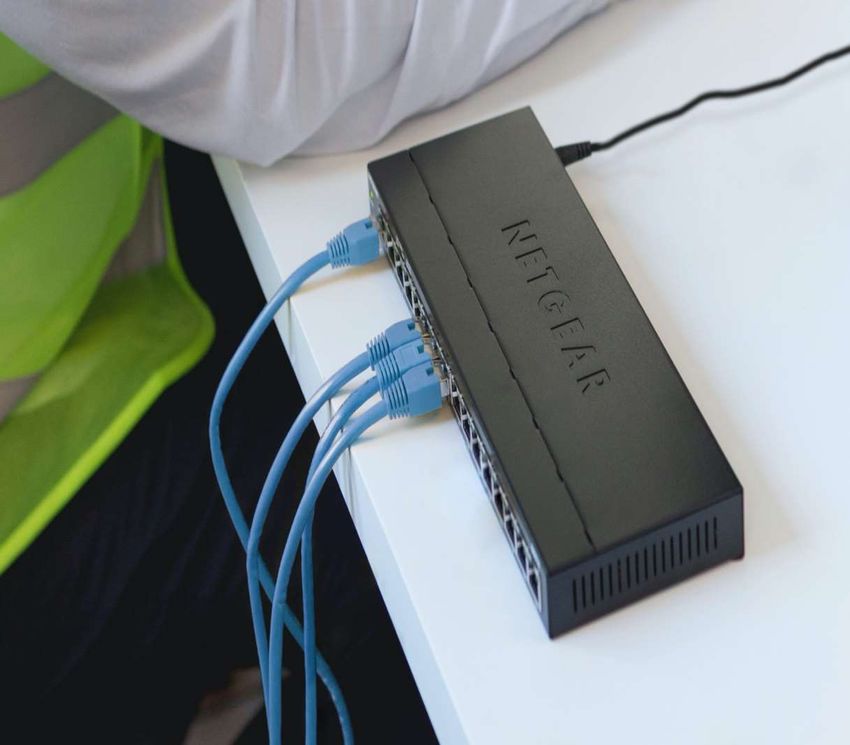
Connected Home
  PRODUCTS AND TECHNOLOGY

UNCOMPROMISED WIFI THROUGHOUT THE HOME

         WORK                              LEARN                   STREAM

         GAME                             EXERCISE                  SHOP

S TAY C O N N E C T E D                   SOCIALIZE           VIDEO CONFERENCING
ORBI MESH WIFI

 NETGEAR Orbi WiFi 6 AX6000 Review: The Best Mesh Router
 Performance - You Get What You Pay For
 “Quite simply, the Orbi 6 was streets ahead and it’s the fastest mesh system I’ve
 ever used. It also has the widest and highest quality coverage I’ve seen”

Unparalleled performance for every size home
W I F I 6 L E A D E R S H I P I N E V E R Y S I N G L E C AT E G O R Y

MESH                                                RANGE
                     ROUTER                                                     CABLE
                                                   EXTENDER
S U P P L E M E N T E D W I T H N E TG E A R VA LU E A D D E D S E R V I C E S
S M A R T PA R E N TA L C O N T R O L S

•   Subscription $69.99/year

•   Managing the family’s Internet time has never been easier

•   Create healthy internet habits

•   Schedule off time and give positive rewards

•   Manage profiles, devices and content

•   Monitor online activity at home or away (WiFi or LTE)

•   Notifications to Orbi App
NE TGEAR ARMOR

•   Subscription $69.99/year

•   Advanced security on your NETGEAR router

•   Detect and block cyber threats

•   Such as phishing, malicious URLs and privacy attacks

•   Unlimited device protection

•   BitDefender VPN for secure internet browsing

•   Notifications to Orbi or Nighthawk App
4G/5G WIFI HOTSPOT
                           CONNECTIVITY ANYWHERE, ANYTIME

ONLINE LEARNING                       FIRST RESPONDERS              M O B I L E H E A LT H C A R E

MOBILE SERVICE                             RV USERS                 CONSTRUCTION SITE

R U R A L L O C AT I O N         BUSINESS TRAVEL – SECURE CONNECT       U LT R A - FA S T 5 G
MOBILE & FIXED WIRELESS
Better WiFi.
Anywhere.
Extending High Speed Internet Anywhere, Anytime
• Areas underserved by wired Internet • Nighthawk M5 5G mmWave/Sub6 Mobile Router
• Temporary or on-demand internet solution • Orbi 4G LTE Advanced WiFi Mesh
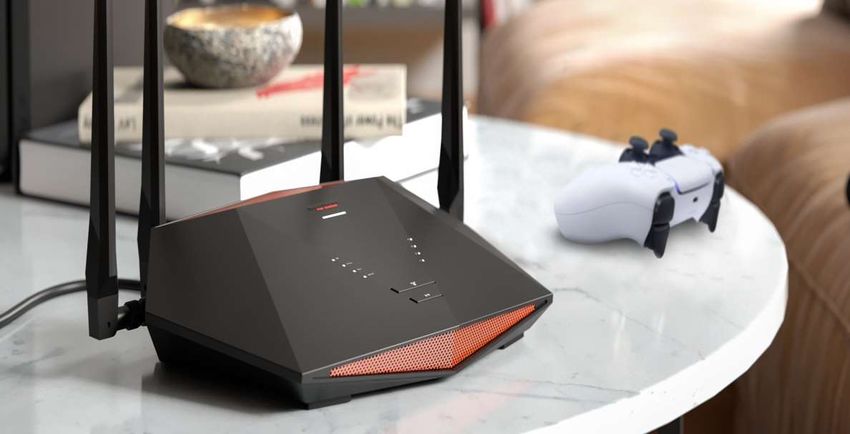
• 5G, LTE Advanced & WiFi 6 • Nighthawk LTE WiFi RouterENHANCED ONLINE GAMING EXPERIENCE
NETGEAR Differentiation Cloud gaming needs low latency WiFi
Gaming server selection $4.5B
Game specific QoS Cloud Gaming WiFi 6 is key to success in gaming
Spending by 2024*
Real time ping monitoring
*“5G and New Services Will Push Cloud Gaming Market to US$4.5 Billion and 42 Million Active Cloud Gaming Users By 2024,” ABI Research, 11/13/2019MEURAL WIFI PHOTO FRAME
STAY CONNECTED WITH FAMILY, EVEN WHEN APART
Share life’s moments, instantly.
SHARE PHOTOS WITH FAMILY & FRIENDS ON CONNECTED MEURAL FRAMES AROUND THE WORLD
New 15” Frame Available online and in Best Buy Auto sync from phone to frameCHP STRATEGY Up ASP To Expand TAM Capitalize On New Virtual World Sell Subscription To Expand OM%
SMB Segment
PRODUCTS AND TECHNOLOGY
H I S T O R Y O F I N N O V AT I O N I N S M B

                                                                                                                        Switches Fully Designed
                                                                                                 Half Width 16-port          for AV over IP
                                                                       First DIY WiFi Mesh       PoE+ ProAV Switch
                                                                      Solution for Business                                                   2020
                                               First App Managed
                                                                                                                                  2020
                      First 10G Smart              Access Point                                                       2019
                                                                                                        2019
First Smart                Switch                                                             2018
  Switch                                                                      2017
                                                                   2017                                                                  High-Performance
                                                      2017
                                        2014                                                                                                WiFi 6 Mesh
                           2011                                                                                100G Core Switch            Access Points
               2010
   2003                                                                               ProAV 48/96
                                                        First Fully Autonomous         10G Switch
                                  Flexible Mounting       Cloud Management
       First Lightly Managed         Click Switch                 Switch
             Plus Switch
SMALL BUSINESS & HOME OFFICE SOLUTIONS – BOOMING DEMAND High performance, secure WiFi Simple to set up Easy network management
NETGEAR SOHO SOLUTIONS

                                                                                     SCREENSHOT

WiFi 6 Mesh & Mesh Access Points    Business Routers & VLAN PoE switches   Insight Remote Management
INSIGHT & INSIGHT PRO
EASY NETWORK MANAGEMENT, LOCAL & REMOTE
SCREENSHOT
DIY Managed Service Providers
$5 per year per device $15 per year per deviceP R O A V A P P L I C AT I O N S VIDEO CONFERENCING E D U C AT I O N LUXURY RESIDENTIAL D I S TA N T M E D I C A L S U R G E R I E S SMALL & MOBILE EVENTS COMMAND & CONTROL CENTERS GREEN SCREEN REPLACEMENT S TA G E S B A C K D R O P S TRANSPORT TERMINALS
SMB STRATEGY

Capitalize Home Office Demand   Catch The Pro AV Revolution   Grow Insight Subscription
Financials

25
Quarterly Net Revenue
                         (Net Revenue, $ Millions)
$400

                                                                   $378
$350

$300
       $289
                                                            $280
$250                            $266
              $249                         $253
                       $231                          $230
$200
                                       *
$150

$100

$50

 $0
       4Q18   1Q19     2Q19     3Q19       4Q19      1Q20   2Q20   3Q20
Segment Performance
(Net Revenue, $ Millions)
CONNECTED HOME SMB
350 100
90
300
80
250 70
60
200
50
150
40
100 30
20
50
10
0 0
4Q18 1Q19 2Q19 3Q19 4Q19 1Q20 2Q20 3Q20 4Q18 1Q19 2Q19 3Q19 4Q19 1Q20 2Q20 3Q20
Retail Service ProviderRegional Performance
(Net Revenue, $ Millions)
AMERICAS EMEA A PA C
300 70 80
60 70
250
60
50
200
50
40
150 40
30
30
100
20
20
50 10 10
0 0 0
4Q181Q192Q193Q194Q191Q202Q203Q20 4Q181Q192Q193Q194Q191Q202Q203Q20 4Q181Q192Q193Q194Q191Q202Q203Q20Operating Margin
(Non-GAAP, % of Revenue)
12%
10.9%
10%
9.4%
9.1%
8%
7.8%
7.5%
6%
4% 4.4% 4.4%
3.6%
2%
0%
4Q18 1Q19 2Q19 3Q19 4Q19 1Q20 2Q20 3Q20Earnings Per Share
(Non-GAAP, $ per Share)
$1.20
$1.13
$1.00
$0.80
$0.60 $0.68
$0.65
$0.60
$0.54
$0.40
$0.34
$0.20 $0.28
$0.21
$0.00
4Q18 1Q19 2Q19 3Q19 4Q19 1Q20 2Q20 3Q20Cash Balance
(Cash, Cash Equivalents and Short-Term Investments, $ Millions)
$350
$300
$307
$274
$250 $259
$200 $213 $218 * $210
$196
$150 $172
$100
$50
$0
4Q18 1Q19 2Q19 3Q19 4Q19 1Q20 2Q20 3Q20
31You can also read