INVESTOR PRESENTATION - Fourth Quarter & FY 2018 - Drive Shack Inc.
←
→
Page content transcription
If your browser does not render page correctly, please read the page content below
INVESTOR PRESENTATION
Fourth Quarter & FY 2018
Disclaimers
IN GENERAL. This disclaimer applies to this document and the verbal or written comments of any person presenting it. This document, taken together with any such
verbal or written comments, is referred to herein as the “Presentation.”

FORWARD-LOOKING STATEMENTS. Certain items in this Presentation may constitute forward looking statements within the meaning of the Private Securities
Litigation Reform Act of 1995, including, but not limited to, statements regarding Drive Shack Inc.’s (NYSE: DS; “DS Inc.” or the “Company” and “we,” “us” and “our,” as
applicable) (a) statements relating to returns on our investments, (b) anticipated future sales of selected owned golf courses, including without limitation statements
relating to the timing and amount of anticipated proceeds, (c) our plans and expectations to optimize the operation of, and grow, our existing leased and managed golf
courses, (d) redeployment of cash from our generated liquidity, (e) targeted multiples, yields and returns, (f) our ability to terminate or restructure leases and (g) the
Company’s current business plan and expectations relating to our Drive Shack sites, including (i) the number of venues that we may be able to develop, (ii) timing and
frequency for opening venues, (iii) financial performance of these venues and capital expenditure costs, (iv) the growth of the golf, golf entertainment, and eatertainment
industry and business, and (v) our ability to enhance technology. These statements are based on management's current expectations and beliefs and are subject to a
number of risks, trends and uncertainties that could cause actual results to differ materially from those described in the forward-looking statements, many of which are
beyond our control. We cannot give any assurances that management’s current expectations will be attained. For a discussion of some of the risks and important
factors that could cause actual results to differ materially from such forward-looking statements, see the sections entitled “Risk Factors” and “Management’s Discussion
and Analysis of Financial Condition and Results of Operations” in the Company’s periodic reports filed with the Securities and Exchange Commission (“SEC”), which
are available on the Company’s website (www.http://ir.driveshack.com). In addition, new risks and uncertainties emerge from time to time, and it is not possible to
predict or assess the impact of every factor that may cause actual results to differ from those contained in any forward-looking statements. Accordingly, you should not
place undue reliance on any forward-looking statements contained in this Presentation. Forward-looking statements speak only as of the date of this Presentation. We
expressly disclaim any obligation to release publicly any updates or revisions to any forward-looking statements contained herein to reflect any change in expectations
with regard thereto or change in events, conditions or circumstances on which any statement is based.

PAST PERFORMANCE; NO OFFER; NO RELIANCE. Past performance is not a reliable indicator of future results and should not be relied upon as the basis for
making an investment decision. This Presentation does not constitute an offer to sell, or a solicitation of an offer to buy, any security. Any such offer would only be made
by means of formal offering documents, the terms of which would govern in all respects. You should not rely on this Presentation as the basis upon which to make any
investment decision.

The Company has not reconciled its EBITDA expectations set forth in this presentation to net income (loss), as items that impact such measures are out of the
Company’s control and/or cannot be reasonably predicted. Accordingly, a reconciliation is not available without unreasonable effort.

NON-GAAP FINANCIAL INFORMATION. This Presentation may include information based on financial measures that are not recognized under generally accepted
accounting principles (“GAAP”). You should use non-GAAP information in addition to, and not as an alternative to, financial information prepared in accordance with
GAAP, which is included in the Company’s filings with the SEC.

CAUTIONARY NOTE REGARDING ESTIMATED / TARGETED RETURNS AND GROWTH. Targeted returns and growth represent management’s view and are
estimated based on current and projected future operating performance of our location in Orlando and other targeted locations, comparable companies in our industry
and a variety of other assumptions, many of which are beyond our control, that could prove incorrect. As a result, actual results may vary materially with changes in our
liquidity or ability to obtain financing, changes in market conditions and additional factors described in our reports filed with the SEC, which we encourage you to review.
We undertake no obligation to update these estimates. See above for more information on forward-looking statements.

                                                                                                                                                                               1
Drive Shack (NYSE: DS)
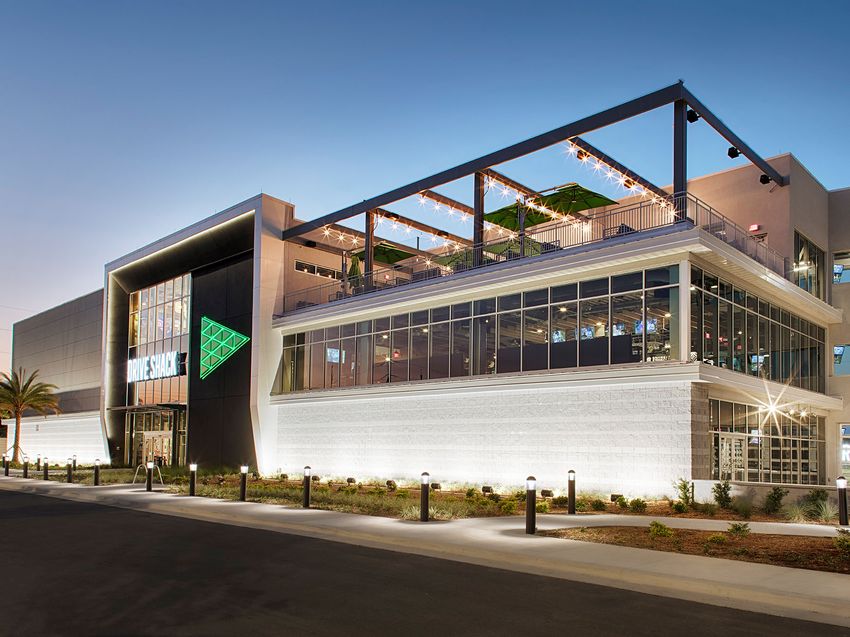
Drive Shack is a leisure company evolving from a traditional golf to an entertainment business
BEFORE AFTER
Traditional Golf Focus Entertainment Focus
Higher growth trajectory
Lower cyclicality
Higher margins
Higher capital efficiency
Superior shareholder value creation
Based on management’s current views and estimates. See “Disclaimers” at the beginning of this Presentation for more information on forward-looking statements.
2
Why Invest in Drive Shack?

       1
                            Differentiated Concept in Growing Industry

       2
                                                 Platform for Significant Growth

       3
                                               Optimized Golf Course Portfolio

       4
                                            High Quality Locations in Pipeline

       5

                                     Attractive Unit and Overall Economics

       6

                                    Experienced Management Capabilities

           Based on management’s current views and estimates. See “Disclaimers” at the beginning of this Presentation for more information on forward-looking statements.
                                                                                                                                                                            3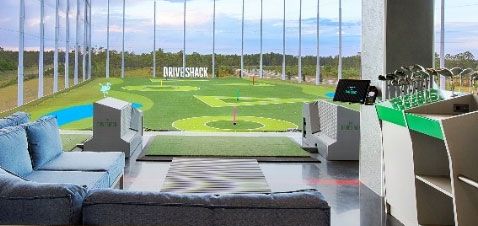
1 Differentiated Concept in Growing Industry – Drive Shack
Consumer trends point towards a rapidly changing, experience-focused shift in spending
Millennials, the largest portion of this buying segment, are the driving force(1)
78% of millennials would choose to spend money on an experience versus buying something(2)
Result is the mashup of 3 industries: Food & Beverage + Entertainment + Sports = “Eatertainment”
U.S. “Eatertainment” Industry Drive Shack Entertainment
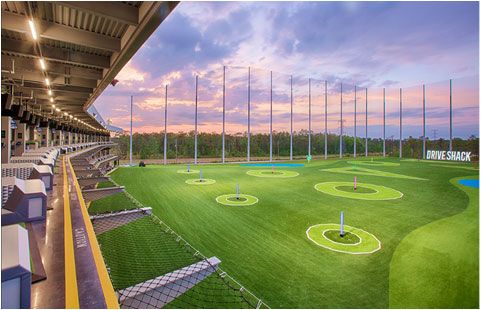
$1.6+ Trillion in Revenue(3) Golf meets games, entertainment, & dining
Entertainment
$700+ bn
Sports(4) Guests interact, play and socialize
$100+ bn in a sophisticated, fun setting
Anchored on driving range featuring
robust gaming platform
Elevated Food & Beverage with focus
Restaurant on “sharable” options
$800+ bn
1) Source: Pew Research Center (April 2018); Forbes (June 2014).
2) Source: USA Today (June 2017).
3) Sources: National Restaurant Association (2017), PwC (2017), Golf Digest (2018), Select USA (2017).
4) Sports revenue estimate includes media rights, gate revenues, sponsorship, merchandising, and golf facility revenue.
4
2 Platform for Significant Growth – American Golf Corporation (AGC)
Grow Drive Shack with $180 to $200M of liquidity from net course sales proceeds + cash on hand
To date, 15 courses sold for gross proceeds of ~$115M; expect additional ~$60M from 9 courses by year end(1,2)
Additional long term course sales with estimated value of ~$45M to $65M(3)
Combine sales proceeds, net of $100M course debt, with cash on hand of $60M to fund Drive Shack’s growth(4)
Owned Course Sales Liquidity
$220 - $240
$180 - $200
Short Term Proceeds of ~$175M $45 - $65
~$60
~$100
~$20
~$40
$115
Sold
Sold In Contract / LOI
In Contract Marketed
Marketed Long Term Sales
Long Term Sales Total Value
Total Value Debt
Cash On Hand Cash on Hand
Debt Liquidity
Liquidity
# Courses: (16)
15 (5)
6 (3)
3 (2)
2 (26)
26
Based on management’s current views and estimates. See “Disclaimers” at the beginning of this Presentation for more information on forward-looking statements.
1) To date as of March 8, 2019.
2) Management estimates as informed by offers received by the Company and broker opinion valuations provided by a national real estate brokerage company.
3) Estimated proceeds of ~$45M to $65M represent (a) ~$45M to $50M of sale proceeds plus (b) additional potential redevelopment upside of up to ~$15M; long term sales are those expected to close in 2H 2019 or later.
4) Cash on hand represents $80 million of total cash less ~$20 million of working capital at American Golf, equaling ~$60 million as of December 31, 2018.
5
3 Optimized Golf Course Portfolio – American Golf Corporation
Once AGC portfolio is optimized, traditional golf business
is expected to generate ~$175M annual revenues & $10M+ annual operating cash flow
Successfully added 8 new management contracts in 2018 for +$1M of annual cash flow
Expect to add 5+ new contracts in 2019
Opportunities to leverage capabilities across broader Drive Shack platform
Grow AGC’s leased & managed portfolio incorporating DS gaming platform
Only company to offer a truly integrated traditional and entertainment golf proposition
Leverage AGC’s operational & municipal experience to unlock DS sites, often requiring excellent course mgmt. skills
American Golf Portfolio Mix by 2019
Expected by
YE 2018
YE 2019
# of Properties # of Properties
Owned 13 2
Leased 36 37
Managed 17 22+
Total 66 61+
Based on management’s current views and estimates. See “Disclaimers” at the beginning of this Presentation for more information on forward-looking statements.
6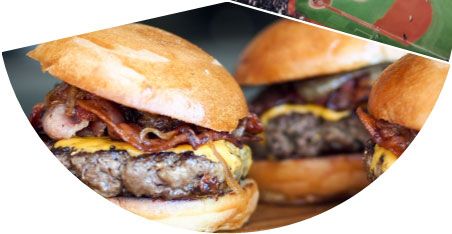
4 High Quality Locations in Pipeline
New Site Announcements – Chicago, Houston, Newport Beach, Portland
Currently in development – 3 sites planned for opening this year; 6 additional sites signed for future open
Active pipeline of 30+ potential sites identified, currently analyzing economics or negotiating initial terms
PORTLAND, OR
CHICAGO, IL
MANHATTAN, NY
RICHMOND, VA
RALEIGH, NC
NEWPORT BEACH, CA
ORLANDO, FL
Open or In Development NEW ORLEANS, LA
WEST PALM BEACH, FL
HOUSTON, TX
Based on management’s current views and estimates. See “Disclaimers” at the beginning of this Presentation for more information on forward-looking statements.
7
5 Attractive Unit and Overall Economics
Targeting EBITDA margins of ~25-30% with 20+ venues open by 2022
Rollout of new 72-bay venue – targets untapped smaller markets, reduces average build cost & build time
Expands total addressable markets by 50+ markets
Retains key elements of 90-bay venue but with faster build time
Average build cost for portfolio will be ~$25M per site over time, as highest portion of sites will be the 72-bay
format(1)
Target Unit Economics
$ in millions 72 BAY 90+ BAY
Addressable US Markets 100+ 50+
Target Site Additions
Avg. Cost to Build(1) $20 - $25 $30 - $35
2019 2020 2021 2022
Total Revenue $15 - $20 $20 - $25
New Sites 3 3–5 5 – 10 5 – 10
EBITDA Margin(2) ~25% ~30%
20+ sites
Plus additional revenue upside from international by 2022
expansion, sponsorships & other product extensions
Based on management’s current views and estimates. See “Disclaimers” at the beginning of this Presentation for more information on forward-looking statements.
1) Targeted development cost per site includes construction costs, soft costs, start-up and expenses, if applicable.
2) There can be no assurance that we will achieve Target Site EBITDA margin and actual results may differ materially.
8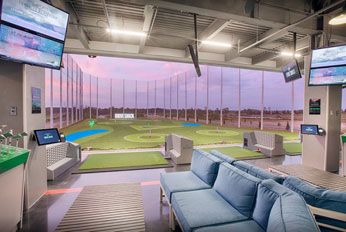
6 Experienced Managment Capabilities
Operational Capabilities Orlando Update
Hired experienced leaders across almost every function: New senior leadership team & culture in place
New Head of IT Have applied platform-wide changes at
New VP of Store Openings the site-level in Orlando
New VP of Operations
New General Manager
New VP of Event Sales
Tech. team on-site improving check-in/bay
New Corporate Chef experiences, POS, and systems integration
Implemented operational processes to fix food
execution
New processes for efficient & accurate execution
Implemented employee engagement surveys
Enhanced and upgraded food & beverage menu
Reengaged hourly associates, redesigned staff uniforms
Orlando 4Q Performance
Applying new training and hiring processes
Revenue: $1.6M (+1% vs. $1.5M in Q3)
Spend per Visitor: $41 (+8% vs. $38 in Q3)
New brand strategy emphasizing entertainment
2018 Revenue(1)
Shift focus from golf to entertainment; emphasis on being
the top social entertainment experience
F&B BayPlay
New strategies such as enhanced digital targeting and
38% 28%
event-style programming put in place November
Other
Events 6%
28%
Based on management’s current views and estimates. See “Disclaimers” at the beginning of this Presentation for more information on forward-looking statements.
1) Sales from: 1) Events include food & beverage related to the event; 2) BayPlay represent non-event sales from hourly golf in the bays; 3) Other include membership, instructions, and merchandise.
9Drive Shack Investment Opportunity
1
10%+ revenue growth across select “Eatertainment” industries over the past 5
Differentiated Concept in
years(1)
Growing Industry Drive Shack combines golf/games, entertainment, and dining under 1 roof
2
Platform for
Use liquidity from monetizing 26 owned courses with est. value of ~$220M+(2)
Significant Growth
3
Optimized
Expect ~$175M annual revenue from remaining American Golf portfolio by 2020
Golf Course Portfolio
4
High Quality
1 site open, 3 opening this year, 6 in development; target 20+ sites by 2022
Locations in Pipeline
5
Attractive Unit and Target averages of
Overall Economics Revenue: ~$20M, Build cost: $25 to $30M, EBITDA margin: ~25%(3)
6
Experienced Ken May, CEO, and David Hammarley, CFO began in November 2018
Mgmt. Capabilities New hires across Operations, Opening, Technology, and Event Sales
Based on management’s current views and estimates. See “Disclaimers” at the beginning of this Presentation for more information on forward-looking statements.
1) Based on third party estimates (unweighted).
2) Management estimates as informed by offers received by the Company and broker opinion valuations provided by a national real estate brokerage company.
3) There can be no assurance that we will achieve Target Site EBITDA margin and actual results may differ materially.
102019 Key Priorities
2019 is a key year in our evolution into an entertainment company as we execute our strategy to
deliver sustainable, profitable growth over the long term
Monetize Close all short term courses for ~$175M estimated gross proceeds(1)
Owned Courses Finalize strategy to monetize long term courses & grow remaining portfolio
Redeploy liquidity and cash on hand into Drive Shack
Build Out & Open 3 new venues with strong toplines and bottom line performance
Aggressively Expand Open 3-5 venues in 2020 and 5-10 in 2021 onwards for 20+ total venues by 2022
Implement operational & strategic updates made in Orlando across all new
Strengthen Operational venues and continue platform-wide brand development
Capabilities
Continue building team with key hires to support our aggressive growth
Based on management’s current views and estimates. See “Disclaimers” at the beginning of this Presentation for more information on forward-looking statements.
1) Management estimates as informed by offers received by the Company and broker opinion valuations provided by a national real estate brokerage company.
11You can also read