EUROPEAN COMMUNICATION MONITOR 2018
←
→
Page content transcription
If your browser does not render page correctly, please read the page content below
EUROPEAN
COMMUNICATION
MONITOR 2018
HOW INFORMATION PROVISION CREATES CORPORATE VALUE
INSIGHTS FROM THE EUROPEAN COMMUNICATION MONITOR 2018
STRATEGIC COMMUNICATION AND THE CHALLENGES OF FAKE NEWS,
TRUST, LEADERSHIP, WORK STRESS AND JOB SATISFACTION.
RESULTS OF A SURVEY IN 48 COUNTRIES.

Prof. dr. Dejan Verčič, Prof. dr. Ángeles Moreno, Dr. Piet Verhoeven
European Communication Summit
June 13, 2018

Program

Introduction and context

The European Communication Monitor 2018

Information provision for decision makers by communication professionals

Responding to reality: Fake news and trust

Questions and discussion

                                                                           2
Introduction and context

Dr. Piet Verhoeven
University of Amsterdam
The Netherlands

European Communication Monitor (ECM)

www.communicationmonitor.eu

                                       4
Globalization of ECM

                       5
Importance for the profession
Core knowledge is the main
driver for professionalization

Transfering scientific
knowledge to practitioners

Monitoring

Benchmarking

Providing models for
leadership and excellence

                                 6
Research team, model and book

                                7

Topics 2018
Responding to reality: Fake news and trust
Information provision for decision-makers
Strategic issues for communication management
Leadership and organisational culture
Work engagement and trust in the organisation
Stress at work and factors driving it
Job satisfaction and willingness to change
Work environment and leadership index for communications
Salaries
Characteristics of excellent communication departments

                                                           9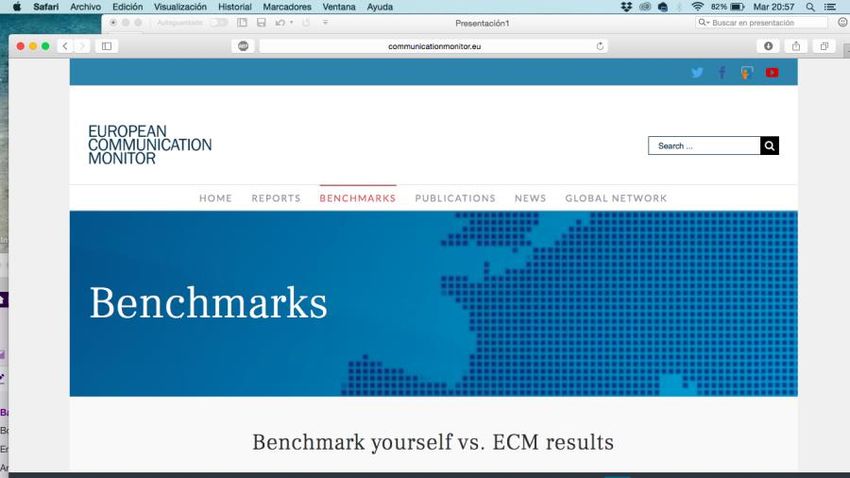
Demographic background of participants
Position Organisation
Head of Communication, 36.8% Communication department in a
Agency CEO joint stock company 20.9%
Responsible for single 30.4% private company 22.7%
communication discipline, government-owned, public sector, 73.4%
Unit leader political organisation 19.0%
non-profit organisation, association 10.8%
Team member, Consultant 27.7%
Other 5.1% Communication consultancy, 26.6%
PR agency, freelance consultant
Job experience Alignment of the communication function
More than 10 years 65.3% Strongly aligned communication department 29.9%
6 to 10 years 17.0% Aligned communication department 56.7%
Up to 5 years 17.7% Weakly aligned communication department 13.5%
www.communicationmonitor.eu / Zerfass et al. 2018 / n = 3,096 communication professionals. Q 19: Where do you work? Q 20: What is your position?
Q 33: How many years of experience do you have in communication management/PR? Alignment: n = 2,271 communication professionals working in
communication departments. Q 22: Within your organisation, the top communication manager or chief communication officer is a member of the executive 10
board / reports directly to the CEO or highest decision-maker on the executive board / does not report directly to the CEO or highest decision-maker.Personal background of respondents
Gender / Age
Overall Head of communication, Team leader, Team member,
Agency CEO Unit leader Consultant
Female 58.1% 50.8% 58.1% 64.6%
Male 41.9% 49.2% 41.9% 35.4%
Age (on average) 41.3 yrs 45.6 yrs 41.5 yrs 37.4 yrs
Membership in a professional association Highest academic educational qualification
European Association of Communication 12.0% Doctorate (Ph.D., Dr.) 6.4%
Directors (EACD)
Master (M.A., M.Sc., Mag., M.B.A.), Diploma 63.1%
Other international communication
11.4%
association Bachelor (B.A., B.Sc.) 25.3%
National PR or communication association 43.9% No academic degree 5.2%
www.communicationmonitor.eu / Zerfass et al. 2018 / n = 3,096 communication professionals. Q 20: What is your position? Q 28: How old are you? Q 29:
What is your gender? Q 34: Please state the highest academic/educational qualifications you hold. Q 35: Are you a member of a professional organisation? 11
Highly significant correlations between gender (Q 29) and position (Q 20) (chi-square test, p ≤ 0.01, Cramér's V = 0.162).Countries and regions represented in the study
Respondents are based in 48 European countries and four regions
Western Europe Northern Europe Southern Europe Eastern Europe
29.7% (n = 919) 24.2% (n = 748) 30.2% (n = 934) 16.0% (n = 495)
Belgium United Kingdom Italy Romania
Germany Sweden Spain Czech Republic
Netherlands Finland Portugal Poland
Switzerland Norway Slovenia Russia
France Ireland Croatia Ukraine
Austria Denmark Serbia Bulgaria
Luxembourg Latvia Turkey Hungary
Liechtenstein Lithuania Greece Slovakia
Monaco Estonia Bosnia and Herzegovina Georgia
Iceland Macedonia Armenia
Cyprus Belarus
Malta
Montenegro
Albania
Andorra
Kosovo
San Marino
Vatican City
www.communicationmonitor.eu / Zerfass et al. 2018 / n = 3,096 communication professionals. Q 36: In which European state are you normally based? 12
In this survey, the universe of 50 European countries is based on the official country list by the European Union (2018) and the Columbia Encyclopedia (2018).Most important strategic issues for communication management until 2021
Building and maintaining trust 39.5%
Linking business strategy and communication 37.7%
Coping with the digital evolution and the social web 36.8%
Matching the need to address more audiences and channels with
limited resources
32.1%
Dealing with the speed and volume of information flow 32.0%
Strengthening the role of the communication function in supporting
top-management decision making
29.2%
Dealing with the demand for more transparency and active audiences 23.2%
Using big data and/or algorithms for communication 22.8%
Dealing with sustainable development and social responsibility 18.2%
Implementing advanced measurement and evaluation routines 16.1%
Dealing with fake news and false information 12.3%
www.communicationmonitor.eu / Zerfass et al. 2018 / n = 3,096 communication professionals. Q 6: Which issues will be most important for communication 13
management / PR within the next three years from your point of view? Please pick exactly 3 items. Percentages: Frequency based on selection as Top-3 issue.Information provision for decision-makers Prof. Dr. Dejan Verčič University of Ljubljana Slovenia
Providing information to decision-makers is a common practice in communication
departments/agencies, but only two thirds consider it a core task

                    Information is delivered to top                                               Information providing is a core
                  management and/or (internal) clients                                           task for the department/agency

                                      89.1% Yes                                                                64.7% Agree

                                                                                                             17.4% Neutral

                                                                                                             17.9% Disagree
                                     10.9% No

www.communicationmonitor.eu / Zerfass et al. 2018 / n ≥ 3,048 communication professionals. Q 8: Does your department/agency deliver information like news
briefings, media monitoring, survey results, brand/reputation reports, benchmarking or background reports . Q 7: Many communication departments/agencies provide
insights to top management and (internal) clients by delivering information through daily news briefings, media monitoring, survey results, and other reports like scenarios
or benchmarks. Please rate the following statements based on your experience. Item: Providing information for decision-makers is not a core task for our department/           15
agency. Scale 1 (Strongly disagree) – 5 (Strongly agree). Reverse coded. Disagreement: scale points 4-5; Neutral: scale point 3; Agreement: scale points 1-2.
The majority of professionals agree that information providing helps to gain
recognition and position communications – it will thus become more important
Providing information for decision-makers …
offers great opportunities to gain recognition offers great opportunities to position is gaining in relevance for
from top management and (internal) clients ourselves against other departments/agencies our department/agency
8.0% 15.9% 9.8%
24.0%
29.7%
27.4% 56.8%
60.6%
68.0%
Agree Neutral Disagree
www.communicationmonitor.eu / Zerfass et al. 2018 / n ≥ 3,048 communication professionals. Q 7: Many communication departments/agencies provide insights
to top management and (internal) clients by delivering information through daily news briefings, media monitoring, survey results, and other reports like scenarios or
benchmarks. Please rate the following statements based on your experience. Scale 1 (Strongly disagree) – 5 (Strongly agree). Disagreement: scale points 1-2; Neutral: 16
scale point 3; Agreement: scale points 4-5.Various reports provided to decision-makers:
Key ones are for monitoring social and mass media (and these are outsourced)
Information provided to top management and/or (internal) clients Frequency Outsourced
Media monitoring reports 74.6% 20.5% 4.9% 56.0%
News briefings 59.6% 34.0% 6.4% 22.4%
Survey results 30.5% 54.7% 14.8% 39.7%
Background reports on topics 29.9% 55.2% 15.0% 12.6%
Reputation/brand reports 26.4% 52.8% 20.8% 35.2%
Background reports on stakeholders 23.8% 53.2% 23.0% 13.0%
Benchmarking reports 20.1% 56.4% 23.5% 25.1%
Regularly Sometimes Not at all
www.communicationmonitor.eu / Zerfass et al. 2018 / n = 2,740 communication professionals. Q 9a: How frequently does your department or agency provide the
following information to top management and/or (internal) clients? Media monitoring reports (e.g., clippings and evaluation of mass media or social media news); News
briefings (e.g., edited or curated overviews of news and discussions in mass media, social media, etc.); Survey results (e.g., employee or customer surveys); Background
reports on topics (e.g., strategic issues, scenarios); Reputation/brand reports (e.g., based on image or brand evaluation); Background reports on stakeholders (e.g., potential 17
opponents, influencers, collaborators); Benchmarking reports (e.g., internal/external comparisons). Q 9b: And which reports are mainly prepared by external service providers?Up-to-date information is mostly restricted to the discourse in print media;
social media monitoring and curated news briefings are less common
Frequency of monitoring reports and news briefings
Print media monitoring (clippings/evaluation) 54.8% 16.8% 22.0% 6.4%
Social media monitoring
36.6% 23.9% 34.1% 5.5%
(clippings/evaluation)
TV monitoring (clippings/evaluation) 36.3% 13.0% 32.7% 18.0%
News briefings (edited/curated content) 28.4% 25.6% 39.4% 6.5%
Daily Weekly Less often Never
www.communicationmonitor.eu / Zerfass et al. 2018 / n ≥ 2,598 communication professionals. Q 10: How frequently does your department/agency provide the 18
following information to internal or external clients?PRIME Insights
Editorial Management
Summaries
Supporting all Mobil
Devices
Multimedia, Including TV clips, etc.
PRIME Research International 04.07.2017 19Communication departments in governmental organisations are ahead in terms
of media monitoring and news briefings
Weekly or daily provision of …
70.7%
Print media monitoring 62.8%
(clippings/evaluation) ** 81.8%
58.5%
58.8%
Social media monitoring 58.2% Joint stock
(clippings/evaluation) ** 58.8% companies
51.1% Private
companies
48.6% Governmental
organisations
TV monitoring 40.7%
Non-profit
(clippings/evaluation) ** 60.6% organisations
37.0%
50.3%
News briefings 44.6%
(edited/curated content) ** 59.2%
46.7%
www.communicationmonitor.eu / Zerfass et al. 2018 / n ≥ 2,598 communication professionals. Q 10: How frequently does your department provide the following 20
information to internal or external clients? Percentages show combined agreement for “daily” and “weekly”. ** Highly significant differences (chi-square test, p ≤ 0.01).Excellent communication departments are delivering value by providing
information to top management
Providing information for decision-makers …
70.3% is practised by the department
is a core task for our department
63.3%
offers great opportunities to gain 73.1%
recognition from top management
and internal clients 65.5%
offers great opportunities to position 55.9% 92.9% 87.4%
ourselves against other departments 54.0%
is gaining in relevance for our 68.1%
department 59.1%
1
Excellent communication departments Other communication departments
www.communicationmonitor.eu / Zerfass et al. 2018 / n = 2,271 communication professionals in communication departments across Europe. Q 7: Many
communication departments provide insights to top management and (internal) clients by delivering information through daily news briefings, media
monitoring, survey results, and other reports like scenarios or benchmarks. Please rate the following statements based on your experience. ** Highly
significant differences (chi-square test, p ≤ 0.01). Q 8 (n = 2,241): Does your department deliver information like news briefings, media monitoring, survey
results, brand/reputation reports, benchmarking or background reports to top management and/or internal clients? Percentages based on “agreement”. 21
** Highly significant differences (chi-square test, p ≤ 0.01, Phi = 0.065).Excellent communication departments offer all kinds of management reports
more frequently
Information frequently provided to top management and/or internal clients
79.8%
Media monitoring reports **
72.0%
68.2%
News briefings **
56.2%
43.7%
Survey results **
31.5%
37.5%
Reputation/brand reports **
23.7%
33.4%
Background reports on topics **
24.6%
28.6%
Benchmarking reports **
17.0%
27.8% Excellent communication departments
Background reports on stakeholders **
17.0% Other communication departments
www.communicationmonitor.eu / Zerfass et al. 2018 / n = 1,997 communication professionals in communication departments across Europe. Q 9a: How
frequently does your department provide the following information to top management and/or (internal) clients? Percentages based on “regularly”. 22
** Highly significant differences (Kendall rank correlation, p ≤ 0.01).Excellent communication departments are better at providing up-to-date news
briefings and media monitoring to decision-makers
Weekly or daily provision of …
Print media monitoring 77.7%
(clippings/evaluation) **
67.6%
Social media monitoring 67.2%
(clippings/evaluation) **
55.2%
News briefings 55.8%
(edited/curated content) **
45.9%
TV monitoring 59.6%
(clippings/evaluation) **
48.3%
Excellent communication departments Other communication departments
www.communicationmonitor.eu / Zerfass et al. 2018 / n ≥ 1,888 communication professionals in communication departments across Europe. Q 10: How
frequently does your department provide the following information to internal or external clients? Percentages show combined agreement for “daily” and 23
“weekly”. ** Highly significant differences for all items (Kendall rank correlation, p ≤ 0.01).Responding to reality: Fake news and trust Prof. dr. Angeles Moreno University Rey Juan Carlos, Madrid, Spain
Even though the public sphere seems to be influenced by fake news,
it seems to be less relevant in day to day work in communications

 How communication professionals assess fake news

                           46.4%

                                                                                             24.4%
                                                                                                                                           Only    12.3%      rate
                                                                                                                                        “Dealing with fake news and
                                                                                                                                            false information” as
                                                                                                                                         important future issue for
                                                                                                                                       communication management

 The public sphere in my country is influenced by Fake news is relevant for the daily work of my
                    fake news                         communication department/agency

www.communicationmonitor.eu / Zerfass et al. 2018 / n = 3,096 communication professionals. Q 1: Fake news has become a buzzword, especially in the political
field (US presidential elections, Brexit debate, etc.), but also related to reports about celebrities, brands and organisations. We define ‘fake news’ as news in mass or social
media that is intentionally and verifiably false or with low facticity, intended to mislead recipients. Please rate these statements based on your experience. Scale 1 (Not at
all) – 5 (To a great extent). Percentages: Frequency based on scale points 4-5. Q 6: Which issues will be most important for communication management / PR within the              25
next three years from your point of view? Please pick exactly 3 items. Percentages: Frequency based on selection as Top-3 issue.
Impact of fake news on organisations: one quarter has already been affected
Has your organisation and its reputation been affected by
fake news, and if so, how often in 2017/2018?
Organisations
affected once
12.5%
Organisations Organisations
not affected affected
77.5% 22.5%
Organisations
affected multiple
times
10.0%
www.communicationmonitor.eu / Zerfass et al. 2018 / n = 2,817 communication professionals. Q 2: Has your organisation and its reputation been affected by
fake news, and if so, how often in 2017/2018? We were not affected / We were affected once / We were affected multiple times / I don’t know. Percentages show 26
proportion among respondents who were able to assess this for their organisation.Social media are the main source for fake news – although misleading content is
also distributed through mass media and internal communication channels
Source of fake news that has affected organisations
81.3%
59.6%
14.3%
Internal media Mass media Social media
(e.g., Intranet, internal social media) (e.g., newspapers, TV, radio) (e.g., Facebook, Twitter, Blogs, YouTube)
www.communicationmonitor.eu / Zerfass et al. 2018 / n = 816 communication professionals in organisations that were affected by fake news. Q 3: How has your
organisation been affected by fake news? Please keep in mind that fake news is commonly understood as ‘news in mass or social media that is intentionally and verifiably 27
false or with low facticity, intended to mislead recipients’. Where has fake news been published? Multiple answers possible.False and misleading news mostly impacts organisations and brands at large –
but products, services and people are frequently targeted as well
Content and focus of fake news that has affected organisations
Organisations and/or Brands 55.1%
Products and/or Services 43.8%
Persons 41.5%
Communication
Industrial relations
Others 9.5% Public Affairs
Responsibility Governance &
Ethics Research &
Strategy Development
Industry/Sector
www.communicationmonitor.eu / Zerfass et al. 2018 / n = 813 communication professionals in organisations that were affected by fake news. Q 4: How has your
organisation been affected by fake news? Please keep in mind that fake news is commonly understood as ‘news in mass or social media that is intentionally and verifiably
false or with low facticity, intended to mislead recipients’. What was the fake news about? Multiple answers possible. Qualitative content analysis by two human 28
coders has been applied to analyse open answers in the category “Others”.Cluster analysis reveals three different approaches to identify fake news:
Only 12 per cent of affected organisations have established advanced routines
Advanced
Prepared 12.0%
Passive 80.7%
7.3%
Advanced Prepared Passive Total
We rely on individual competences/experience of our communication staff 54.9% 80.4% 0.0% 71.5%
We have implemented formal guidelines and routines 54.1% 22.0% 0.0% 24.2%
We are currently working on plans to deal with the issue 14.8% 25.3% 0.0% 22.2%
We have installed specific technologies/systems 100.0% 0.0% 0.0% 12.0%
This is not necessary for us 0.0% 0.0% 100.0% 7.3%
n 122 823 74 1,019
www.communicationmonitor.eu / Zerfass et al. 2018 / n = 1,019 communication professionals in organisations that were affected by fake news. Q 5: How is your
communication department/agency prepared to identify (potential) fake news? Multiple answers possible. Cluster solution based on Q 5 (hierarchical cluster analysis; 29
Z-scores).Excellent departments are better prepared to deal with fake news
Attention given to the debate about fake news
Excellent communication departments Other communication departments
More or less More or less
18.0% 21.7%
attention given attention given
Attention 69.1% 13.0% No attention Attention 62.5% No attention
given given given given
15.8%
Organisational approach to identify fake news
Excellent communication departments 19.5% 73.2% 7.4%
Advanced Prepared Passive
Other communication departments 9.7% 83.9% 6.4%
www.communicationmonitor.eu / Zerfass et al. 2018 / n = 868 communication professionals in communication departments across Europe. Q 1: Please rate
these statements based on your experience. Item: I have given attention to the debate about fake news. Scale 1 (Not at all) – 5 (To a great extent). Highly significant
differences (chi-square test, p ≤ 0.01, Cramér's V = 0.077). Q 5: How is your communication department/agency prepared to identify (potential) fake news? Multiple 30
answers possible. Cluster solution based on Q 5 (hierarchical cluster analysis; Z-scores). Highly significant differences (chi-square test, p ≤ 0.01, Cramér's V = 0.118).Questions and discussion
More information and online benchmarks
Visit our new website www.communicationmonitor.eu to assess full reports for all previous European
Communication Monitor studies and a large selection of web videos and publications based on this
research series. Related surveys are conducted in North America, Latin America and Asia-Pacific –
find out more online about the largest and only truly global study of public relations and communication
management with sound empirical standards.
Starting in autumn 2018, the web ECM website will feature online benchmarks. You are invited to
benchmark yourself and your organisation against comprehensive data from the monitor studies with
new topics every three months.

The book based on a decade of research data and case studies
                          Communication Excellence:
                          How to Develop, Manage and Lead Exceptional Communications
                          by R. Tench, D. Verčič, A. Zerfass, A. Moreno & P. Verhoeven
                          London: Palgrave Macmillan 2017, 247 pp., ISBN 978-3-319-48859-2
                          Read this book written for communication leaders interested in a big picture of corporate
                          communications and the future of the field. The authors explore the implications of 10 years of
                          European Communication Monitor data. Combined with case studies and interviews with chief
                          communication officers from top European companies like Santander, DP DHL, Electrolux,
                          Porsche and KMPG, the book provides an insight into how to build, develop and lead excellent
                          communication departments. It shows readers how communication can effectively influence
                          and support the organisation and positively fit within the business strategy of today’s global and
                          changing markets.
 “This powerful, practical and highly relevant book is a must read for both communication scholars and practitioners.”
 (Donald K. Wright, Ph.D., Harold Burson Professor of Public Relations, Boston University, USA)
 “Straight forward! An insightful read for every communicator who wants to better understand what ‚professional’
 actually means.” (Nicole Gorfer, Global Head Public & Employee Communications, Roche Group, Basel, Switzerland)
                                                                                                                               32
EUROPEAN COMMUNICATION MONITOR 2018 THANK YOU FOR YOUR ATTENTION AND PARTICIPATION Prof. dr. Dejan Verčič, Prof. dr. Ángeles Moreno, Dr. Piet Verhoeven European Communication Summit June 13, 2018
You can also read