Investor Presentation March 2018 - NASDAQ: ATOM - Atomera Incorporated
←
→
Page content transcription
If your browser does not render page correctly, please read the page content below
Investor Presentation
     March 2018

    NASDAQ: ATOM
                        1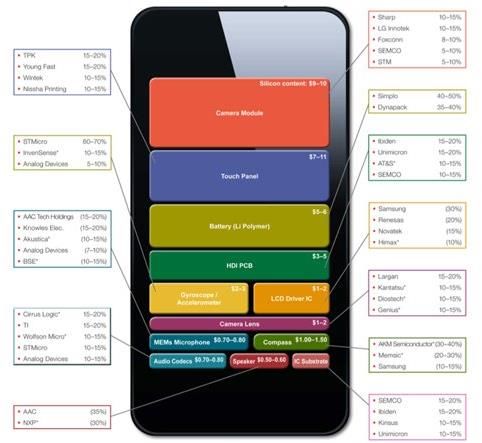
Note Regarding Forward-Looking Statements

This presentation contains forward-looking statements concerning Atomera Incorporated (““Atomera,” the
“Company,” “we,” “us,” and “our”). The words “believe,” “may,” “will,” “potentially,” “estimate,” “continue,”
“anticipate,” “intend,” “could,” “would,” “project,” “plan,” “expect” and similar expressions that convey
uncertainty of future events or outcomes are intended to identify forward-looking statements. These
forward-looking statements are subject to a number of risks, uncertainties and assumptions, including those
described in the “Risk Factors” section of our Annual Report on Form 10-K for the year ended December 31,
2017 filed with the SEC on March 6, 2018 (the “2017 Annual Report”). In light of these risks, uncertainties
and assumptions, the forward-looking events and circumstances discussed in this presentation may not occur
and actual results could differ materially and adversely from those anticipated or implied in our forward-
looking statements. You should not rely upon forward-looking statements as predictions of future events.
Although we believe that the expectations reflected in our forward-looking statements are reasonable, we
cannot guarantee that the future results, levels of activity, performance or events and circumstances
described in the forward-looking statements will be achieved or occur.
This presentation contains only basic information concerning Atomera. The Company’s filings with the
Securities Exchange Commission, including the 2017 Annual Report, include more information about factors
that could affect the Company’s operating and financial results. We assume no obligation to update
information contained in this presentation. Although this presentation may remain available on the
Company's website or elsewhere, its continued availability does not indicate that we are reaffirming or
confirming any of the information contained herein.

                                                                                                           2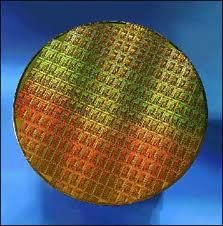
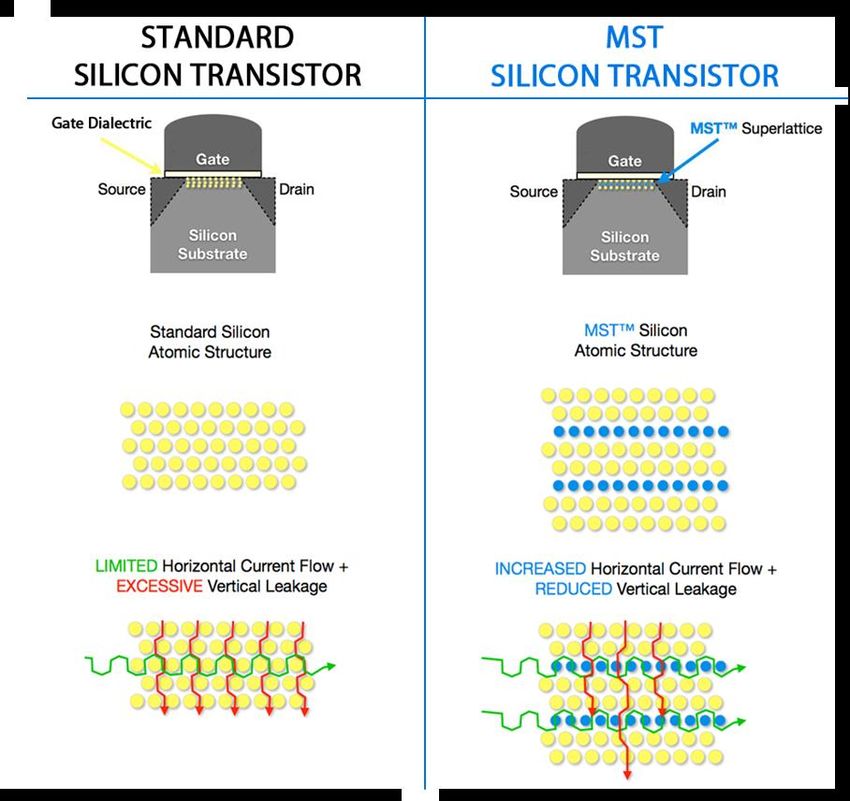
Investment Overview
Mears Silicon Technology (MST®) is a semiconductor enhancement technology
Improves electron mobility resulting in higher performance, lower power, and lower costs
Capital-light IP licensing business
Highly leverageable business model with strong cash position
Robust and growing patent portfolio to support licensing activities
Core R&D complete after $80M and 15 years
Currently engaged with 50% of world’s top semiconductor makers
Total available market: $4.0 B
Strong team to commercialize technology
CEO ran $1B+ divisions at Broadcom and Altera
Founder/CTO co-invented the erbium-doped fiber amplifier
NASDAQ Ticker: “ATOM” – IPO in August 2016
3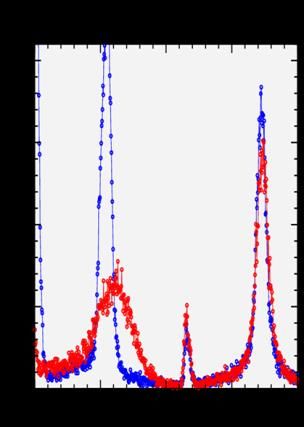
Extending Moore’s Law
The skyrocketing cost of new nodes MST: A way out
FinFET MST can deliver a half to a full node of benefits
8 8
Extends life of depreciated fabs
7 7 Continues reducing the cost per transistor
Cost per Million Gates (cents)
6 6
May solve problems in geometries smaller than 28 nm
5 5 MST cost is tiny in comparison to developing a new node
Cost ($B)
4 4
Process development/licensing is ~$10M
Foundry equipment upgrades cost is ~$30-50M
3 3
A foundry for a new node costs billions
2 2
1 1
0 0
“From an economic standpoint, Moore’s law is over.”
90nm 65nm 40nm 28nm 20nm
2004 2006 2008 2010 2012
Fab Investment Process Development Cost Per Transistor Silicon Valley analyst Lynley Gwynnap, quoted in
“After Moore’s Law,” The Economist, 12 March 2016
Source: McKinsey & Co, “On Semiconductors”
4
MST Technology

                                      Potential Benefits

                 •   Improved Efficiency
                       •   Improved performance
                       •   Lower power consumption
                       •   Some combination of the two

                 •   Reduced Die Size
                       •   Lower power needs
                       •   Lower bottom line cost

                 •   Improved Yield
                       •   Less waste
                       •   Easier design parameters

                                                           5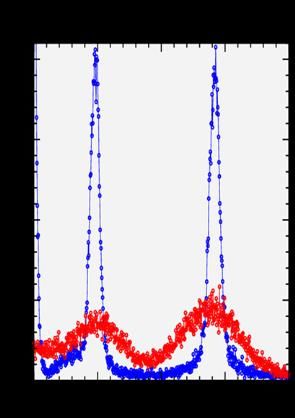
Potential Benefits

•   Overall Improved Efficiency: Smartphone
       •    45%-52% added battery life (depending on usage)
       •    Increased cost to add MST expected to be insignificant to total phone cost
       •    Opportunity to increase performance instead of saving power

•   Reduced Die Size: Power Management Integrated Circuit (IC)
       •    Die size reduction of 15-21%
       •    Would result in lower power draw
       •    Would also reduce total cost per device

•   Product Enablement: Mobile Double Data Rate (DDR) Memory
       •    Could create a whole new class of memory for mobile devices
       •    Would enable low-power wearables and Internet-of-Things devices
       •    May provide significant improvements to standby power

Sources: Smartphone power consumption papers (Carrol & Geisser)
         3rd party consultant simulations
         Atomera analysis
                                                                                         6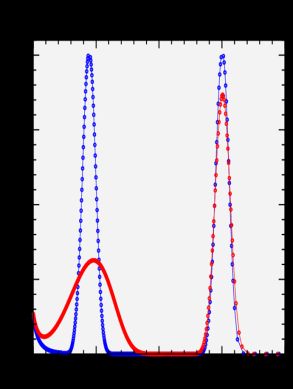
Semiconductor Ecosystem

         Process                                                                             Equipment
                                     Wafer Fabrication            Chip Makers / Sellers
       Development                                                                          Manufacturers

Foundries

Integrated Device Manufacturers (IDM)

                                                              Fabless

                                                              Vertically Integrated Firms

                                                   Supporting Ecosystem
                 Semiconductor Equipment Manufacturers

                    Electronic Design Automation Tools
                                                                                                        7
Accelerating time to license
Customer Wafer Manufacturing
Atomera MST® Deposition Customer MST® Deposition
Phase 1 Phase 2 Phase3 Phase4 Phase 5 Phase 6
Planning Setup Integration Installation Qualification Production
1
Simulation
2
Faster
3
Readily EPI tool availability
Reduces time and Results
Confidence Available allows for
cost for customer uninterrupted
process integration customer progress
20+ learning cycles per year 8Largest Companies with fabs
Market Total Capacity -
Company Type
1 Samsung Semiconductor IDM
Segment
Memory
Wf/mon. (200mm equ)
2,598,750
Total industry capacity 17.8M
2 TSMC
Micron Technology
Foundry
IDM
Logic
Memory
2,012,317
1,540,500
wafers/month
3
SK Hynix Foundry Memory 1,530,000
Top 25 wafer capacity leaders
4
5 Toshiba Semiconductor IDM Memory 1,158,750
GlobalFoundries Foundry Logic 810,000
89% of total industry capacity at
6
7 Intel IDM MCU 681,750
8
9
Texas Instruments (TI)
UMC (United Microelectronics)
IDM
Foundry
Analog
Logic
620,879
614,863
end of 2016
10 STMicroelectronics IDM Analog 461,006
11 SMIC Foundry Logic 432,750
12 Infineon Technologies IDM Analog 375,809
13 ON Semiconductor IDM Analog 374,492
14 Powerchip Technology Foundry Logic 313,000
15 TowerJazz Foundry Analog 297,735
16 NXP Semiconductors IDM Analog 250,000
17 Renesas Electronics IDM Other 236,124
18 Japan Semiconductor Corp. (Toshiba) Foundry Analog 229,944
19 Huahong Grace Semiconductor (HHGrace) Foundry Analog 213,000
20 IM Flash IDM Memory 180,000
21 Vanguard International Semiconductor (VIS) Foundry Analog 175,000
22 MagnaChip Semiconductor Foundry Analog 155,000
23 Nanya Technology IDM Memory 135,000
24 Fujitsu Semiconductor IDM Logic 131,728
25 China Resources Microelectronics (CR Micro) IDM Analog 130,846
Source: IC Insights Global Wafer Capacity 2017-2021 report 9Atomera Business Opportunity
License Fees Engineering Service Fees
Royalties
Example 1. Worldwide Average Fab1 Example 2. Leading Foundry, 40nm Fab
Monthly Fab Capacity Monthly Fab Capacity
40,000 80,000
(wafers/month) (wafers/month)
Wafer ASP $1,637 Wafer ASP $3,000
Annual Revenue Potential2 $7.9M Annual Revenue Potential2 $28.8M
1. 2016: 375 fabs worldwide with a total of 15.2M wafers per month
2. Assumes 50% penetration 10
Sources: IC InsightsMarket Segment Strategy
Leading Analog Mainstream Leading Planar 3D
Analog, PMIC, RF IoT, RF, Automotive DRAM; Digital Processors FinFET, Nanowire
Big Players: TSMC, TI, NXP, ST Big Players: TSMC, UMC, Big Players: TSMC, GF, Big Players: Intel, TSMC,
Micro SMIC, Global Foundries Samsung, Hynix, Micron Samsung, GF
Challenges Challenges Challenges Challenges
Difficult to find new options for Many fully depreciated factories Alternatives to planar transistors FinFET cost, variability,
cost, performance, power need a performance boost to are both expensive and can affect manufacturability. Looking at
improvements remain competitive product performance exotic material solutions
Atomera solutions Atomera solutions Atomera solutions Atomera solutions
MST can lower die cost while MST allows fab life extension by MST provides a low cost MST is a low risk, silicon based
improving other parameters upping performance within node alternative to extend planar life technology with multiple benefits
180nm 130nm 90nm 65nm 40nm 28nm 16nm 14nm 10nm 7nm 5nm
Now engaged with customers in all four segments
11Patent Portfolio
22 New US Patents Applications Filed in 2017
• Strong Patent Portfolio
61 Issued US Patents
• Covers core elements of MST
• Constantly adding new patents
MST CMOS Devices
5 • Discoverable and enforceable
7 • Infringement can be easily discovered
MST Core Method and
Devices using electron microscopy
29
MST Optics
20 • International Strategy
Other • Including foreign counterparts, portfolio
has over 110 granted patents
12Financials
2017 2016
FY 2017 FY 2016 Q4 2017 Q3 2017 Q2 2017 Q1 2017 Q2 2016
GAAP Results
Revenue $0.1M - $0.1M - - - -
Gross Profit $0.1M - $0.1M - - - -
Operating Expense ($13.3M) ($10.0M) ($2.7M) ($3.3M) ($3.7M) ($3.6M) ($1.9M)
Net Loss ($13.1M) ($12.6M) ($2.6M) ($3.3M) ($3.6M) ($3.5M) ($2.6M)
Loss Per Share ($1.08) ($2.22) ($0.21) ($0.27) ($0.30) ($0.29) ($1.61)
Reconciliation between GAAP & Non-GAAP*
Net Loss (GAAP) ($13.1M) ($12.6M) ($2.6M) ($3.3M) ($3.6M) ($3.5M) ($2.6M)
Interest Expense - $2.6M
Stock-Based Compensation $4.0M $2.5M ($0.5M) ($0.9M) ($1.4M) ($1.2M) ($0.1M)
Adjusted EBITDA (Non-GAAP)* ($9.1M) ($7.5M) ($2.1M) ($2.4M) ($2.2M) ($2.4M) ($1.8M)
Cash at December 31, 2017 $17.4M
Shares Outstanding at December 31, 2017 12.2M
* For a full reconciliation of GAAP and non-GAAP results, please see our press release issued February 13, 2018.
13Summary
High margin, recurring revenue financial model
Well funded with strong cash position
Solid progress with initial customers in pipeline
Strong technology and patent position
Experienced management team to execute business plan
14What’s New
March 2018
15What’s new – March 2018
Achieved first engineering service revenue of $110K in Q4
Now engaged with 14 customers, 6/2/6 in the three phases
Working with customers in unexpected ways
Skipping directly into phase 3
Considering licensing after phase one
Installation prior to license execution
Installation of MST in a factory has commenced with one customer
Under evaluation license terms
TCAD modeling revolutionizing customer evaluations/integration
16Customer Pipeline
Quarterly Customer Pipeline Growth
Q417
3Q17
2Q17
1Q 17
4Q 16
3Q 16
IPO
0 2 4 6 8 10 12 14
Phase 1 Phase 2 Phase 3
Now engaged with 50% of the world’s top semiconductor makers*
* 10 of the top 20 (IC Insights, McClean Report 2017)
17Customer Engagement Changes
Customer Wafer Manufacturing
Atomera MST® Deposition Customer MST® Deposition
Phase 1 Phase 2 Phase3 Phase4 Phase 5 Phase 6
Planning Setup Integration Installation Qualification Production
License Royalties
License?
18Early Installation Advantages
Customer Wafer Manufacturing
Atomera MST® Deposition Customer MST® Deposition
Phase 1 Phase 2 Phase 3 Phase 4 Phase 5
Planning Setup Integration Qualification Production
Phase 3+
Installation
Significantly lowers cost of processing test wafers
Speeds throughput by avoiding shipping/contamination/calibration time
Improves capacity – both for Epi tools and our engineers
Raises our stature within Epi OEMs
Customer Epi engineers become an internal advocate for multiple process nodes
7 19TCAD Modelling Advantage
TCAD allows customers simulate MST quickly and
inexpensively Measured Simulated
Results Results
Engages customers earlier to understand how to use
MST
Benefits
Without
Best integration techniques MST
Frequently causes more ownership on customer side
Builds early credibility and desire to experiment
Early license discussions
Horizontal buy-in at customer With
MST
20Financials
2017 2016
FY 2017 FY 2016 Q4 2017 Q3 2017 Q2 2017 Q1 2017 Q2 2016
GAAP Results
Revenue $0.1M - $0.1M - - - -
Gross Profit $0.1M - $0.1M - - - -
Operating Expense ($13.3M) ($10.0M) ($2.7M) ($3.3M) ($3.7M) ($3.6M) ($1.9M)
Net Loss ($13.1M) ($12.6M) ($2.6M) ($3.3M) ($3.6M) ($3.5M) ($2.6M)
Loss Per Share ($1.08) ($2.22) ($0.21) ($0.27) ($0.30) ($0.29) ($1.61)
Reconciliation between GAAP & Non-GAAP*
Net Loss (GAAP) ($13.1M) ($12.6M) ($2.6M) ($3.3M) ($3.6M) ($3.5M) ($2.6M)
Interest Expense - $2.6M
Stock-Based Compensation $4.0M $2.5M ($0.5M) ($0.9M) ($1.4M) ($1.2M) ($0.1M)
Adjusted EBITDA (Non-GAAP)* ($9.1M) ($7.5M) ($2.1M) ($2.4M) ($2.2M) ($2.4M) ($1.8M)
Cash at December 31, 2017 $17.4M
Shares Outstanding at December 31, 2017 12.2M
* For a full reconciliation of GAAP and non-GAAP results, please see our press release issued February 13, 2018.
21NASDAQ: ATOM
22You can also read