Investor Presentation - May 2020 - BILI's Investor ...
←
→
Page content transcription
If your browser does not render page correctly, please read the page content below

Investor
Presentation
May 2020

               1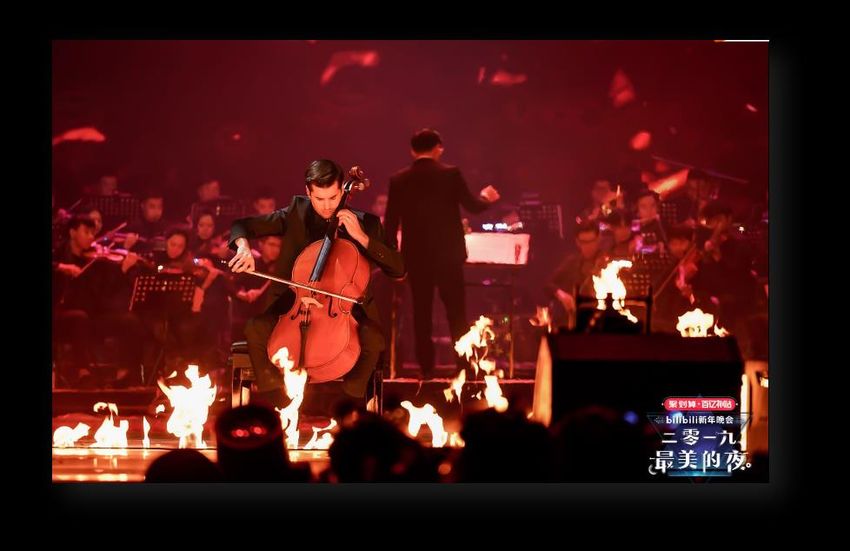
Safe Harbor Statement
This announcement contains forward-looking statements. These statements are made under the “safe harbor” provisions of the U.S. Private
Securities Litigation Reform Act of 1995. These forward-looking statements can be identified by terminology such as “will,” “expects,” “anticipates,”
“aims,” “future,” “intends,” “plans,” “believes,” “estimates,” “confident,” “potential,” “continue,” or other similar expressions. Among other things, the
Effects of COVID-19, Outlook and quotations from management in this announcement, as well as Bilibili’s strategic and operational plans, contain
forward-looking statements. Bilibili may also make written or oral forward-looking statements in its periodic reports to the U.S. Securities and
Exchange Commission, in its annual report to shareholders, in press releases and other written materials and in oral statements made by its officers,
directors or employees to third parties. Statements that are not historical facts, including but not limited to statements about Bilibili’s beliefs and
expectations, are forward-looking statements. Forward-looking statements involve inherent risks and uncertainties. A number of factors could cause
actual results to differ materially from those contained in any forward-looking statement, including but not limited to the following: the effect of the
COVID-19 pandemic on the Bilibili’s business, results of operations, financial condition, and stock price; Bilibili’s strategies; Bilibili’s future business
development, financial condition and results of operations; Bilibili’s ability to retain and increase the number of users, members and advertising
customers, provide quality content, products and services, and expand its product and service offerings; competition in the online entertainment
industry; Bilibili’s ability to maintain its culture and brand image within its addressable user communities; Bilibili’s ability to manage its costs and
expenses; PRC governmental policies and regulations relating to the online entertainment industry, general economic and business conditions
globally and in China and assumptions underlying or related to any of the foregoing. Further information regarding these and other risks is included in
the Company’s filings with the Securities and Exchange Commission. All information provided in this presentation is as of the date of the presentation,
and the Company undertakes no duty to update such information, except as required under applicable law.

                                                                                                                                                               2
Enrich the everyday life of young generations in China

    172mn             156mn                  51mn        13.4mn              87mins
     70% YOY           77% YOY               69% YOY      134% YOY
                                                                            Avg. daily time spent (1) (4)
            (1) (2)                (1) (2)
      MAU             Mobile MAU               DAU (1)      MPU   (1) (3)

:

                                                                                                            3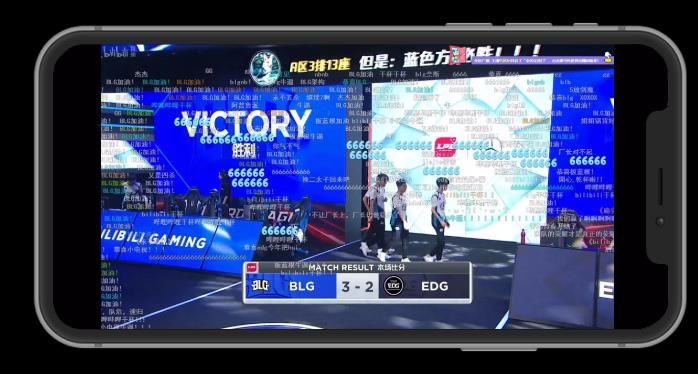
Our rapid growth
Rapid user base expansion lays a solid foundation for fast revenue growth
                            MAU (mn)                                                   Net revenue (RMB mn)

                                                          172                                                                  2,316

                                                                                                                       2,008
                                                                                                               1,859
                                            128    130

                                                                                                       1,538
                                     110
                              101                                                              1,374
               93      93
        85                                                                             1,156
 77                                                                            1,079
                                                                       1,027
                                                                 868

18Q1   18Q2   18Q3   18Q4   19Q1    19Q2   19Q3   19Q4   20Q1   18Q1   18Q2    18Q3    18Q4    19Q1    19Q2    19Q3    19Q4    20Q1

                                                                                                                                       4
We have captured the golden cohort in a golden industry
                      Massive room for growth | Gen Z: future of the entertainment market

                                    5G adaption will revolutionize                                                                                                 Gen Z outgrows overall
                               how people produce and consume content                                                                                         China’s online entertainment market (2)
                                              Online video users in China (mn)           (1)
                                                                                                                                                           Market size (RMB bn)         Gen Z’s contribution

                                                                                                   850                                                                       Gen Z CAGR
                                              Deep user penetration
                                                               759                                                                                                                                 1,332
                                                                               725
                                                                                                                                                                                  24%
                                                                    579
                                                          545
                                                 504
                             428       433
                                                                                                                                                                571

                                                                                                                                                                                                  66%
                                                                                                                                                             59%
                           2013      2014      2015      2016      2017      2018     Jun-19 Mar-20                                                         2019                               2023E

                                                                                                                                                                                                               5
Notes:
 (1)     The 45th China Statistical Report on internet development by China Internet Network Information Center (CNNIC) for the period ended March 2020.
 (2)     According to iResearch report issued in May 2020.
The           story

                                                           Efficient with
                                                        tremendous upside

                                    Commercialization

Ever-growing supply of                                              Highly engaged
user generated content                   Users                         and sticky

                         Content                        Community

                                                                                     6
Content   Community   Commercialization

                         We have become the welcoming home of diverse interests...
                                                                    Vlog                         Fashion

                                                                             Lifestyle
                                             Science                                     (1)                           E-Sports
                                                                               No.1
                                                      Tech &
                                                    Knowledge                                               Game
                                                              (1)                                                        (1)
                                                     No.5                                                     No.2
                                      Electronics
                                                                             ACG                                               Mobile Games
                                                                              Anime, Comic
                                                                                and Game

                                                            Anime                              Entertainment
                                          Cosplay                                                             (1)         Pop Culture
                                                                       (1)
                                                              No.4                                  No.3

                                                       Chinese Anime                                       Celebrity
Notes:
(1)   Ranked by video views in 20Q1                                                                                                                                          7
Content    Community     Commercialization

                         …And ever-growing supply of creative PUG videos
                                                            Talented Content Creators
                                                        Number of Monthly Average Active Content Creators

                                                                             146%
                                                                                              1.8mn
                                                              0.7mn
                              Create
                              reate                                                                                       Encourage

                                                              19Q1                            20Q1

                                                                                        (1)

                High-quality Content Creation
                                                                        91%                                                Loyal Fan Base
                  Number of Monthly Video Submissions
                                                                 total video views                          Number of Content Creators with more than 10,000 Fans
                                                            contributed by PUG videos
                                               4.9mn
                                138%
                                                                                                                                    82%
                  2.1mn

                  19Q1                         20Q1                                                            Mar 31,2019                     Mar 31,2020

Notes:                                                                    Engage
(1)   In 20Q1                                                                                                                                                               8
Content   Community   Commercialization

                Continuous support to content creators in all layers

                                              VIP Service               Maximize influence
                                                Power Alliances         Unlock commercial value
                                               Top 100 UP Award

                                                  Reward                Better incentive
                                             Cash Incentive Program
                                              (250,000+ enrolled) (1)
                                                                        Better recognition

                                                    Tutor                Higher quality
                                                New Star Project         production
                                                 UP Academy

                                                     Tools
                                               Mobile Content            Easier to create
                                                Submission

Notes:
(1)   In 20Q1                                                                                               9
Content   Community    Commercialization

Our OGV strategy: form IP assets and fuel the growth of premium members

                                                  10.9mn and growing premium members

                                               (mn)                                                  Up 127%
                                                                                                        YOY

                                                                                                         10.9

Launching 40 Bilibili produced Chinese Anime
        titles throughout 2020 and 2021
                                                                                               7.6

                                                                                      6.1
                                                                             5.3
                                                                      4.8
                                                               3.6
                                                        2.7
                                                 2.1

             More offerings in
   documentary, tv, movie and variety show     Jun-18 Sep-18 Dec-18 Mar-19 Jun-19 Sep-19 Dec-19 Mar-20

                                                                                                                       10
Content Community Commercialization
New Year’s Eve Gala | The Most Beautiful Night of 2019
90mn+ Video playbacks (1)
3mn+ Bullet-chats (1)
5bn+ Media exposure (2)
9.1 9.3 9.9
Voted by 130+k audiences
‘This is the voice of young people. This is the voice of the generations!’ ---People’s Daily
‘Bilibili’s value is about deeply understanding and fully respecting young people’s interests, and tailor-making its product to cater to their needs. The
gala itself is a clear testimony!’ --- Yicai
“Bilibili allowed all – the old and the young, the world-class, the internet culture and mass culture, as well as gaming and animation – to participate
in harmony and happiness."---Social media
Notes:
(1) As of Mar 31, 2020
(2) Media exposure is measured by the number of views in related articles and videos by Feb 2020
11Content Community Commercialization
We foster highly engaged and sticky communities
Highly engaged users:
1.1bn avg. daily video views in Q1 113% YoY growth
4.9bn interactions (1)
generated monthly in Q1 260% YoY growth
Notes:
(1) Interactive features such as bullet-chats, commentaries, following, favorites, sharing, bilibili moment posts, virtual gifting and like etc. 12Content Community Commercialization
We foster highly engaged and sticky communities
82mn official members (1) 80%+ 12th-month retention rate (1)
(mn)
100%
82
90%
68
80%
62
54 70%
49
45
42 60%
38
35
50%
0 3 6 9 12
Mar-18 Apr-18 May-18 Jun-18 Jul-18
Aug-18 Sep-18 Oct-18 Nov-18 Dec-18
18Q1 18Q2 18Q3 18Q4 19Q1 19Q2 19Q3 19Q4 20Q1 Jan-19 Feb-19 Mar-19
Notes:
(1) To become an official member, user needs to take and pass a community entrance exam consists of 100 questions covering community etiquette and various topics 13Content Community Commercialization
Commercialization comes naturally:
massive user demand intersects with high quality supply
Demand Efficient match
Supply
Large and engaged driven by
big data insights Mobile Games
user base
of user interests and Advertising
with
behaviors Live Broadcasting
strong willingness to pay
Value Added Services
….
We understand users’ demand… …and we offer the right content
and services
14Content Community Commercialization
Compelling core competency of our mobile game business
We have massive gamers We know what they want Ability to pick and operate
User interest & behavior 1 Self developed
Game is the 2nd most popular
quality user data
video genre on our platform
32 Exclusively
distributed
Game-themed live broadcasting
is also well received 740+ Jointly
Customized game recommendation operated
2020 Launched
Strong pipeline
Majority of our gamers are directly converted from our platform 15Content Community Commercialization
Robust game revenue growth
Up 32%
(RMB mn)
YOY
1,151
920 933
873 871
791
744
688 713
18Q1 18Q2 18Q3 18Q4 19Q1 19Q2 19Q3 19Q4 20Q1
16Content Community Commercialization
Value-Added Services: multi-faceted commercialization
Bilibili Comic
Pay to view
comic platform
Premium membership Live broadcasting Maoer
Enjoy exclusive or advanced Natural extension of our Premium
high quality content diversified content platform audio drama platform
17Content Community Commercialization
VAS revenue: strong growth with great potential
(RMB mn)
Up 172%
YOY
794
571
453
326
292
202
169
96 119
18Q1 18Q2 18Q3 18Q4 19Q1 19Q2 19Q3 19Q4 20Q1
18Content Community Commercialization
Brand & Performance-based advertising: two growth engines
Gen Z is the golden cohort Customized and innovative performance-based ads
well chased by brand advertisers help advertisers reach and convert target audiences
19Content Community Commercialization
Advertising revenue: strong growth with great potential
(RMB mn)
Up 90%
YOY
290
247
214
168
160
137
112
96
70
18Q1 18Q2 18Q3 18Q4 19Q1 19Q2 19Q3 19Q4 20Q1
20OUR
FINANCIALS
21Expanding user base drives revenue growth
Total MAUs Diversified Revenue Mix
(mn) (RMB mn)
Y-o-Y Growth % 70% Y-o-Y Growth % 69%
172 2,316
2,008
1,859
128 130
110 1,538
101 1,374
93 93
85 1,156
77 1,079
1,027
868
18Q1 18Q2 18Q3 18Q4 19Q1 19Q2 19Q3 19Q4 20Q1 18Q1 18Q2 18Q3 18Q4 19Q1 19Q2 19Q3 19Q4 20Q1
Mobile games VAS Advertising E-commerce and Others
22Rapid growth of paying users and paying ratio
Impressive growth of paying users MPU / MAU
MPUs (mn)
Y-o-Y Growth %
134%
7.8%
13.4
6.8%
6.2%
5.7% 5.7%
8.8 4.8%
7.9
3.8%
6.3 3.5%
5.7 3.2%
4.4
3.5
3.0
2.5
18Q1 18Q2 18Q3 18Q4 19Q1 19Q2 19Q3 19Q4 20Q1 18Q1 18Q2 18Q3 18Q4 19Q1 19Q2 19Q3 19Q4 20Q1
23Cost of revenue and operating expenses
Cost of Revenue (1) Operating Expenses (1)
(Non-GAAP, RMB mn; as a percentage of revenue %) (Non-GAAP, RMB mn; as a percentage of revenue %)
Gross margin % Operating expense as percentage of revenue %
14.2% 16.8% 19.2% 20.1% 23.2% 33.9% 36.3% 39.2% 38.9% 44.3%
1,778
1,026
1,604
1,501
13%
6%
1,280 782
1,179 19% 729
18% 12%
15% 7% 12%
15% 13% 11% 14% 559 8%
16% 466
16% 14% 8% 11%
14% 12%
15% 16% 8%
13%
38% 13% 26%
36% 35% 19% 20%
40% 37%
13% 15%
19Q1 19Q2 19Q3 19Q4 20Q1 19Q1 19Q2 19Q3 19Q4 20Q1
(2) (3) (4) (5) Sales and marketing expenses Research and development expenses
Revenue-sharing costs Content costs Server and bandwidth costs E-commerce and others
Notes: General and administrative expenses
(1) Excluding Share-based compensation
(2) Revenue-sharing costs consist of fees paid to game developers, distribution channels (app stores) and payment processors, as well as fees we pay to hosts of our live broadcasting program and content creators in accordance with our revenue-sharing arrangements.
(3) Content costs consist of amortized costs of purchased licensed content from copyright owners or content distributors.
(4) Server and bandwidth costs are the fees we pay to telecommunication carriers and other service providers for telecommunication services, hosting our servers at their internet data centers, and providing content and application delivery services.
(5) E-commerce and others include cost of goods sold associated with our E-commerce business, staff cost, depreciation and others. 24Consolidated balance sheets
(RMB MM)
Dec 31, 2019 Mar 31, 2020
Assets
Cash and cash equivalents 4,963 4,445
Time deposits 1,845 1,313
Accounts receivable, net 745 585
Prepayments and other current assets 1,511 1,701
Short-term investments 1,261 2,189
Total current assets 10,324 10,233
Property and equipment, net 516 481
Production cost, net 444 496
Intangible assets, net 1,657 1,815
Deferred tax assets 10 12
Goodwill 1,012 1,012
Long-term Investments, net 1,251 1,446
Other long-term assets 302 276
Total non-current assets 5,193 5,538
Total Assets 15,517 15,771
Liabilities
Accounts payable 1,904 2,132
Salary and welfare payables 356 263
Taxes payable 68 55
Short-term loans - 100
Deferred revenue 1,369 1,491
Accrued liabilities and other payables 576 761
Total current liabilities 4,273 4,802
Long-term debt 3,415 3,471
Other long-term liabilities 193 173
Total non-current liabilities 3,608 3,644
Total Liabilities 7,880 8,446
Redeemable non-controlling interests - 126
Total Bilibili Inc.’s shareholders’ equity 7,052 6,599
Noncontrolling interests 584 600
Total shareholders’ equity 7,636 7,199
Total liabilities, redeemable noncontrolling interests and shareholders’ equity 15,517 15,771 25Consolidated statements of operations and comprehensive loss
(RMB MM, unless otherwise stated)
19Q1 19Q4 20Q1 YoY Change
Net revenues
Mobile games 873 871 1,151 32%
Value-added services (formerly known
292 571 794 172%
as Live broadcasting and VAS)
Advertising 112 290 214 90%
E-commerce and others 96 276 157 64%
Total net revenues 1,373 2,008 2,316 69%
Cost of revenues (1,184) (1,610) (1,785) 51%
Gross profit 189 398 531 180%
Sales and marketing expenses (182) (413) (606) 234%
General and administrative expenses (128) (160) (172) 33%
Research and development expenses (186) (245) (297) 60%
Total operating expenses (496) (818) (1,075) 117%
Loss from operations (307) (420) (544) 77%
Investment income/(loss),net 82 (0) (26) -132%
Interest income 24 36 27 9%
Interest expense - (15) (15) -
Exchange (losses)/gains (2) (3) 12 -705%
Others, net 15 22 17 16%
Loss before income tax (188) (380) (529) 182%
Income tax (8) (7) (9) 15%
Net loss (196) (387) (538) 175%
Adjusted net loss (145) (337) (475) 226%
26THANK YOU!
IR Contacts
Bilibili Inc.
Juliet Yang
Tel: +86-21-2509 9255 Ext. 8523
E-mail: ir@bilibili.com
The Piacente Group, Inc.
Tel: +86-21-6039-8363 (In China)
Tel: +1-212-481-2050 (In U.S.)
E-mail: bilibili@tpg-ir.com
27You can also read