Investor Presentation - NYSE:CRK - Comstock Resources, Inc.
←
→
Page content transcription
If your browser does not render page correctly, please read the page content below
NYSE:CRK

           Investor Presentation
                  MAY 2021
Disclaimer
This presentation includes “forward-looking statements” within the meaning of Section 27A of the Securities Act of 1933 and Section 21E of
    the Securities Exchange Act of 1934. Forward-looking statements give our current expectations or forecasts of future events. These
    statements include estimates of future natural gas and oil reserves, expected natural gas and oil production and future expenses,
    assumptions regarding future natural gas and oil prices, budgeted capital expenditures and other anticipated cash outflows, as well as
    statements concerning anticipated cash flow and liquidity, business strategy and other plans and objectives for future operations.
Our production forecasts are dependent upon many assumptions, including estimates of production decline rates from existing wells and the
   outcome of future drilling activity.
Important factors that could cause actual results to differ materially from those in the forward-looking statements herein include the timing
   and extent of changes in market prices for oil and gas, operating risks, liquidity risks, including risks relating to our debt, political and
   regulatory developments and legislation, and other risk factors, including the impact of the current COVID-19 pandemic, and known
   trends and uncertainties as described in our Annual Report on Form 10-K for fiscal year 2020 and as updated and supplemented in our
   Quarterly Reports on Form 10-Q, in each case as filed with the Securities and Exchange Commission. Should one or more of these risks or
   uncertainties occur, or should underlying assumptions prove incorrect, our actual results and plans could differ materially from those
   expressed in the forward-looking statements.
Reserve engineering is a process of estimating underground accumulations of hydrocarbons that cannot be measured in an exact way. The
   accuracy of any reserve estimate depends on the quality of available data, the interpretation of such data and price and cost assumptions
   made by reserve engineers. In addition, the results of drilling, testing and production activities may justify revisions of estimates that
   were made previously. If significant, such revisions could impact Comstock’s strategy and change the schedule of any further production
   and development drilling. Accordingly, reserve estimates may differ significantly from the quantities of oil and natural gas that are
   ultimately recovered. These quantities do not necessarily constitute or represent reserves as defined by the Securities and Exchange
   Commission and are not intended to be representative of all anticipated future well results.
Comstock owns or has rights to various trademarks, service marks and trade names that we use in connection with the operation of our
   business. This presentation also contains trademarks, service marks and trade names of third parties, which are the property of their
   respective owners. The use or display of third parties’ trademarks, service marks, trade names or products in this presentation is not
   intended to, and does not imply, a relationship with, an endorsement or sponsorship by or of Comstock. Solely for convenience, the
   trademarks, service marks and trade names referred to in this presentation may appear without the ®. TM or SM symbols, but such
   references are not intended to indicate, in any way, that Comstock will not assert, to the fullest extend under applicable law, their rights
   or the right of the applicable licensor to these trademarks, service marks and trade names.

2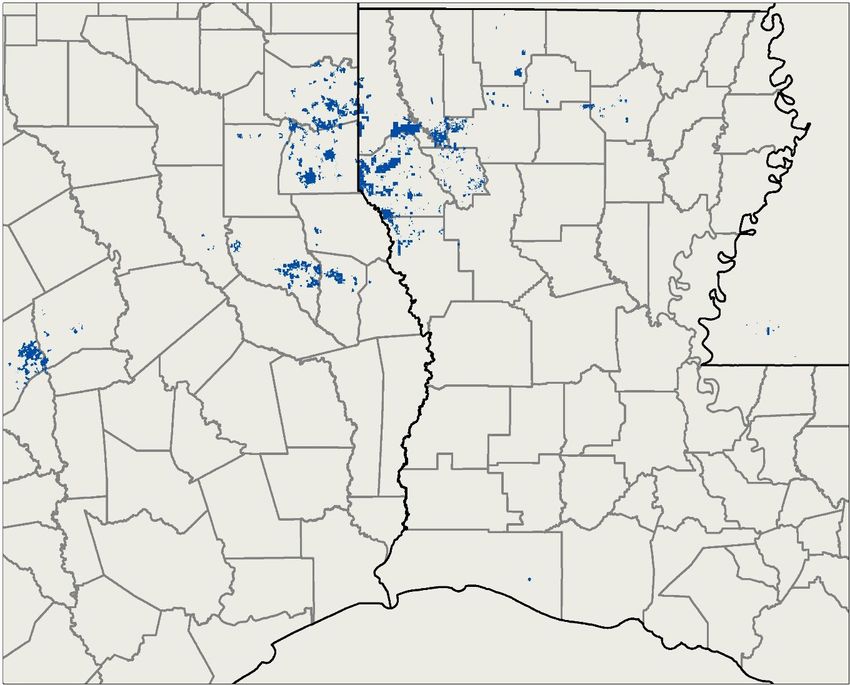
Why Invest in Comstock?

    Best-in-class capital efficiency creates industry-leading margins and return on capital employed

    Conservative operating plan and best-in-class cost structure drives unparalleled free cash flow
    for deleveraging

    Basin leader in the Haynesville, a premier natural gas basin with geographical proximity to Gulf
    Coast and attractive price differentials

    > 1,900 high-return net drilling locations in the Haynesville and Bossier to support successful
    program

    Committed to environmental stewardship and a responsible energy future, with leadership on
    low emissions in a prolific natural gas basin

    Strategic relationship with successful Dallas businessman Jerry Jones, the company's largest
    shareholder, whose investment to date in Comstock totals $1.1 billion

3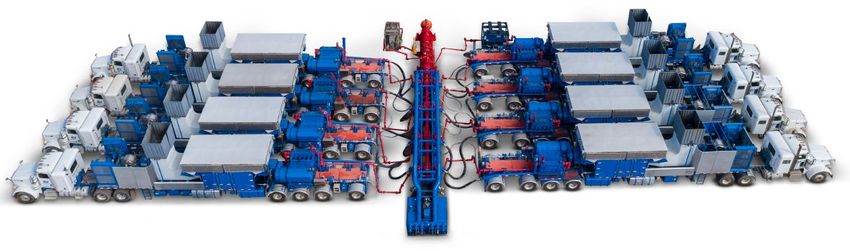
Leading Haynesville Operator
             Comstock Resources overview                                      Haynesville / Bossier shale
                                                                                                                                       Haynesville Shale

    •   Significant Scale in the Haynesville                                           Harrison
                                                                                                                                  Bossier

         •   323,000 Haynesville / Bossier net acres
                     (1)
                                                                                                                       Caddo
                                                                                                                                                      Bienville

    •   Robust inventory of de-risked, high-
        return drilling locations
         •   > 1,900 net drilling locations             Robertson
                                                                                                                                  De Soto
                                                                                                                                               Red
                                                                                                                                              River
                                                                                                      Panola
         •   ~73% of locations >5,000 ft. laterals
    •   Industry leading margins with
        substantial free cash flow generation
                                                                             Nacogdoches                         Shelby
                                                                                                                                  Sabine         Bossier
                                                                                                                                                  Shale
    •   Low-cost, flexible gas marketing
        options                                                                                          San
         •   Limited basis risk due to proximity and                                                   Augustine

             contracts tied to Henry Hub                                              Company statistics
         •   Low gathering, treating and               Net Acres
                                                                                         323,000(1)         Q1 21 Production                1.3 Bcfe/d
             transportation cost                       (Haynesville / Bossier)
                                                       Net Undrilled Locations              1,930           Proved Reserves                   5.8 Tcfe(2)
         •   No unmet minimum volume
             commitments                               % Held-by-Production                    93%          % Gas                                     99%

                                                       % Operated                             91%           PDP PV-10                          $2.2 bn(2)

                                                       % Working Interest                     82%           Total PV-10                        $4.4 bn(2)
                     (1) As of December 31, 2020.                           (2) Based oil and gas prices of $50 WTI / $2.75 HH.

4
Recent Accomplishments and 2021 Outlook
                        • Successfully raised $1 billion of equity and debt throughout a volatile 2020
                        • $207 million common equity in May to redeem the Series A preferred, eliminated $21 million of
       Prudently          annual distributions
     Managing the       • Issued $800 million senior notes in 2020 to enhance liquidity and reduce reliance on bank facility
     Balance Sheet      • Refinanced $1,152 million of senior notes in March 2021 which saves $19.5 million in cash
                          interest payments per year and extends senior notes weighted average maturity from 4.9 years
                          to 6.7 years

       Exceptional      • Strong IP rates of 25 Mmcfe per day on average in 2020 and 2021
     Drilling Results   • Grew proved reserve base by 3% at a low, all-in finding cost of $0.66 per Mcfe in 2020
      and Reserves            • SEC Proved reserves grew to 5.6 Tcfe, replaced 159% of production
         Growth               • 1P PV-10 of $4.4 billion at flat $50 WTI / $2.75 HH

    Consistently Low    • Drilling and completion costs per lateral foot reduced by 17% since 2019
     and Improving      • Longer lateral wells averaged $1,010 per foot in 2021 Q1 versus $1,215 per foot in 2019
         Costs

                        • Comstock’s focus continues to be capital discipline, producing free cash flow, and deleveraging
                          the balance sheet
    Disciplined 2021    • Estimated production of 1.3 to 1.4 Bcfe per day
    Plan and Outlook    • Development capital expenditures of $510 to $550 million
                        • Expecting to generate substantial free cash flow in 2021 to pay down debt

5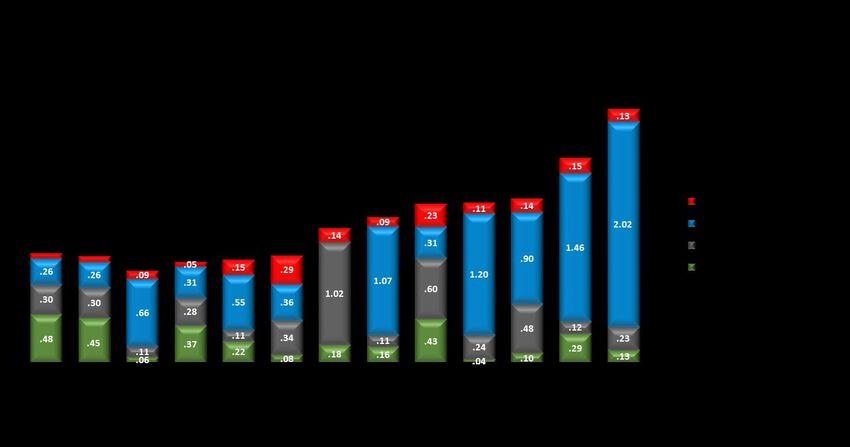
Corporate Strategy Excels in Current Environment
                                                         Develop
                                                Prudently grow free cash flow,
                                                   production and reserves
                                                through development of high-
                                                      quality inventory

              Protect                                                                               Enhance
      Manage commodity price
                                                                                             Enhance returns on capital
     exposure through an active
                                                                                           through a focus on optimizing
     hedging program to protect
                                                                                                full-cycle economics
    our expected future cash flows

                             Finance                                                 Acquire
                                                                            Evaluate and pursue strategic
                    Maintain disciplined financial                           acquisition opportunities to
                              strategy                                       grow reserves, production,
                                                                                and acreage position

6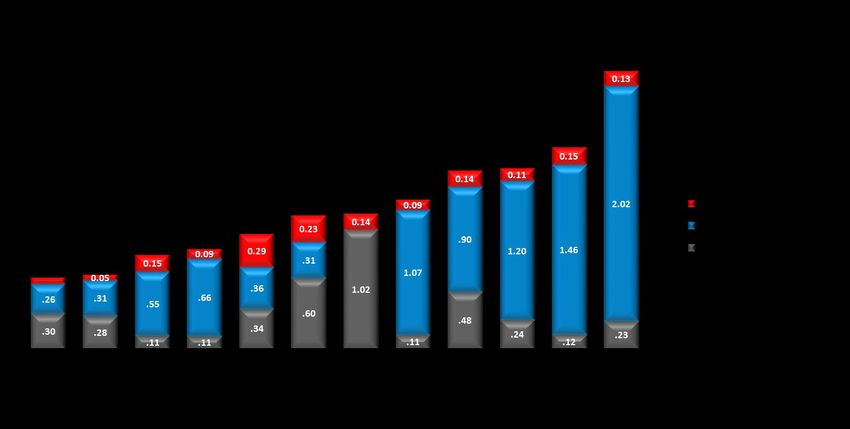
Haynesville vs. Appalachia

               Favorable differentials                                              Lower midstream costs               Superior full-cycle economics

           2021 Q1 Differentials vs. Henry Hub                                    2021 Q1 Gathering & Transportation       2020 EBITDAX Margin / 3-Year F&D
                        ($/mcfe)                                                              ($/mcfe)

                           Higher IRRs                (1)
                                                                                         Faster payouts                      Ample in-basin demand

                                                                                     Basin Average Payback (Years)
                                     IRR (%)                                                                                        Haynesville     Appalachia
                                                                                                                        Basin           Under-
                                                                                                                                                    Over-supplied
                                                                                                                       Demand          supplied

                                                                                                                       Access to      Open, More
                                                                                                                                                    Nearly Full ex
                                                                                                                       Premium        Capacity in
                                                                                                                                                     MVP / ACP
                                                                                                                       Markets         Process

    Source: RSEG, Public filings. Appalachia includes AR, CNX, COG, EQT and RRC

    (1) Based on RSEG type curves at $2.75 per Mcf.

7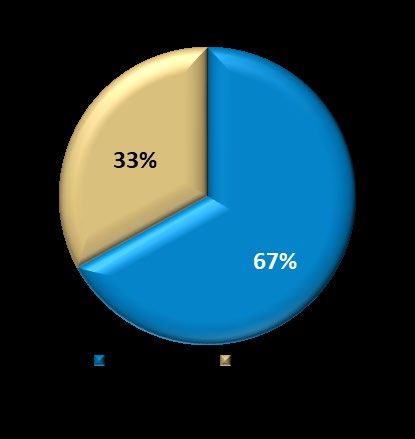
Drilling Location Inventory
                              Extensive inventory of high return drilling locations
                             33 Years of inventory based on 2021 drilling program
                                                     As of March 31, 2021
                                                        Haynesville
                                    Operated           Non-Operated                     Total
                              (Gross)      (Net)      (Gross)     (Net)       (Gross)           (Net)

    up to 5,000 ft.           245          201         535         81          780               282
    5,000 ft. to 8,000 ft.    372          280         206         40          578               320
    > 8,000 ft.               518          372         228         35          746               407
                             1,135         853         969         156        2,104             1,009

                                                          Bossier
                                    Operated           Non-Operated                     Total
                              (Gross)      (Net)      (Gross)     (Net)       (Gross)           (Net)

    up to 5,000 ft.           238          190         371         53          609              243
    5,000 ft. to 8,000 ft.    407          334         98           9          505              343
    > 8,000 ft.               407          323         132         12          539              335
                             1,052         847         601         74         1,653             921

            Total            2,187        1,700       1,570        230        3,757             1,930

8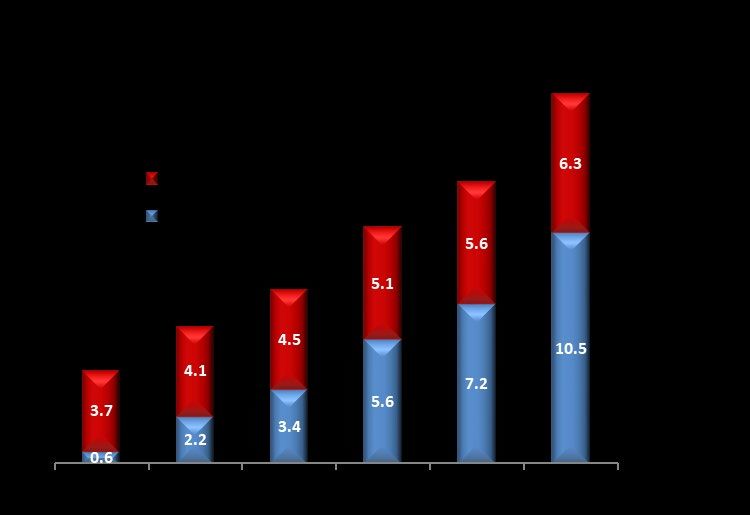
Improving D&C Costs

    17% decrease from 2019 to 2021 due to increased drilling efficiency and lower service costs

                                         (Laterals > 8,000 ft.)
                                           ($ per Lateral Foot)
               $1,506
                              $1,446

                                                $1,215

                                                                  $1,026      $1,010
                $941
                               $1,021
                                                 $764
                                                                   $569
                                                                               $645

                $565
                               $425              $451              $457
                                                                               $365

                2017            2018              2019             2020       2021 Q1
                                  Completion                       Drilling

9
Drilling Results

                                                                                                           Bossier
      Completed 285 operated wells since 2014
        (average lateral length of 7,800 ft.)
         with average IP rate of 24 Mmcf/d                                         Caddo
                                                             6

                                                             5
                                                                                           12 11
 First Quarter 2021:            LL      Turned To   IP                                      13                           Bienville
            Well Name         (feet)      Sales   (Mmcf/d)
  1      Beaubouef 15-10 #3    7,477   03/07/2021   30           Harrison                          1 4
  2      Beaubouef 15-10 #4    5,431   03/07/2021   26                                             2   3

  3      Beaubouef 15-10 #1    5,310   03/08/2021   25
  4      Beaubouef 15-10 #2    7,444   03/08/2021   29
  5        Roberts BF #1      11,132   03/10/2021   21                                                               Red
  6        Roberts TTB #2     13,043   03/10/2021   32                                                               River
  7      Adams 21-28-33 #1    10,573   04/12/2021   23                                                 De Soto
  8      Adams 21-28-33 #2    10,072   04/12/2021   26
                                                                            8 9
  9        Curry 28-33 #1      9,733   04/14/2021   23                      7 10
 10        Curry 28-33 #2      9,544   04/14/2021   23
 11         Davis 7-6 #1       5,997   04/14/2021   25
 12         Davis 7-6 #2       5,398   04/14/2021   21
 13         Davis 7-6 #3       4,568   04/14/2021   19
                               8,132                25

10
Favorable Natural Gas Supply Demand Dynamics
• Long-term price support expected from
Natural Gas Storage (as of 5/7/21)
continued sector capital discipline,
increased power generation demand, long-
Favorable term industrial demand and continued
Supply & coal/nuclear retirements
Demand • Appalachian gas pipeline constraints limit
Fundamentals long-term growth prospects
• Natural gas storage levels are below average
as we enter summer demand season 378 Bcf 72 Bcf
below below
Last Year 5 Yr. Average
Natural Gas Exports
• LNG exports have reached record levels
Strong • Average of 10.5 Bcf/d for 2021 YTD,
Export with max flow rate of 11.6 Bcf/d
Markets • Mexican exports continue to grow
• 6.3 Bcf/d for 2021 YTD
11Gas Marketing Overview
Improving direct access to gulf coast demand centers Improving margins by…
• Having minimal firm transportation
agreements, at out-of-market rates
Carthage
Perryville • Entering into medium-term sales
agreements, which provide basis pricing
certainty at the Perryville hub
• Redirecting natural gas from Perryville
hub to gain direct access to high-growth
Gulf Coast demand (industrial, refining,
chemical and LNG)
• New lateral in service in Q2 which
allows up to 250 Mmcf/day to flow
from Logansport to Acadian
• Entered into agreement to be major
shipper on new Haynesville Acadian
Extension for 1 Bcf/day (expected to
Gillis be in service by 4Q in 2021)
• Expect regional basis to tighten as ~4 Bcf
HSC LNG & Industrial Henry Hub of new North-to-South pipelines are
Demand Centers
projected to come on-line through 2022*
*BTU Analytics’ Gas Basis Outlook
12Cost Structure Drives Best-in-Class EBITDAX Margin
$ / Mcfe
Best-in-class cost structure of gas producers
Leading margins compare favorably to both Permian and gas-weighted names
Unhedged EBITDAX(1)
Margin (%)
Oil Peers
Gas Peers
Source: Public filings. Based on Q1’21 reported actuals. Gas peers include: AR, CHK, CNX, COG, GDP, GPOR, EQT, RRC, SBOW, SWN and VEI (Pro Forma). OIL peers include: FANG, LPI and PXD.
(1) See non-GAAP reconciliation in appendix.
13Operating Cost Structure Offsets Legacy Interest Cost
Cost structure of gas producers including interest
$ / Mcfe
Source: Public filings. Based on Q1’21 reported actuals. Gas peers include: AR, CHK, CNX, COG, GDP, GPOR, EQT, RRC, SBOW, SWN and VEI (Pro Forma).
* Pro Forma for the March 4th Refinancing Transaction.
14Best-in-Class Margins Deliver Strong Returns
EBITDAX Margin (2020)
Comstock’s Margin Advantage
Operational Scale as Haynesville Basin’s
Largest Producer
U.S. E&P
Universe
Higher Realizations due to Favorable Gulf
Coast Market
Favorable Midstream Rates due to No Above Return on Capital Employed (2020)
Market Contracts
Low and Efficient Corporate Overhead
(Lowest of All E&P Companies)
U.S. E&P
Universe
Low Haynesville Lifting Costs
(No Treating/Compression)
Source: Public filings. Note: EBITDAX Margin reflects hedged margin. ROCE calculated as NOPAT / Average Capitalization.
15Oil & Natural Gas Reserves
(1)
Oil Gas Total
MBbls Bcf Bcfe
Proved Reserves as of 12/31/19(1) 16,747 5,342 5,442
Production (1,508) (451) (460)
2020 Additions 2 366 366
Price Revisions (2,858) (68) (86)
Performance Revisions (1,383) 375 367
Proved Reserves as of 12/31/20 (SEC)(1) 11,000 5,563 5,629
SEC PV 10 Value (million $) $1,991
8.2
PV 10 Value (million $) at $2.75/$50 $4,357
*Based on NYMEX prices of $2.75 per Mcf for natural gas and $50 per barrel for oil.
Reserves by Type PV-10 by Type Reserves by Commodity Reserves by Region
Total: Total:
Total: Total:
16
5.6 5.6
$2.0 Bn 5.6
Tcfe Tcfe
Tcfe
(1) Proved Reserves are based on SEC Pricing.
16Drilling Program
First Quarter 2021
Average
Lateral Gross WI Net
($ in millions) $ (feet) Wells Wells
2020 wells turned to sales $ 49.3 9,356 10 9.0
2020 wells completion In process 26.5 10,072 9 8.4
2021 wells drilled 61.1 7,351 21 19.0
2021 wells drilling 13.4 7,500 7 6.4
2021 non-operated and other 12.7
Total Development Costs $ 163.1
Exploratory Leasing $ 5.8
2021 Drilling Program Overview
Developmental Capital Expenditures $510 million to $550 million
Leasing Program $7 million to $10 million
Wells Drilled to Total Depth - Operated 67 Gross / 56.0 Net
Wells to Sales - Operated 55 Gross / 49.0 Net
Year-End Drilled Uncompleted Wells 31 Gross / 24.4 Net
Wells Drilling at Year-End 6 Gross / 5.7 Net
17Balance Sheet
Bank Credit Facility Capitalization
($ in millions) 3/31/2021
Cash and Cash Equivalents $77
Senior Secured Revolving Credit Facility: Revolving Credit Facility $550
7.50% Senior Notes due 2025 244
• $1.4 billion borrowing base
9.75% Senior Notes due 2026 873
reaffirmed on April 16, 2021 6.75% Senior Notes due 2029 1,250
• Maturity date July 16, 2024 Total Debt $2,917
• Pricing of L+225 to 325 bpts Preferred Equity (at face value) $175
Common Equity 1,130
• Key financial covenants: Total Capitalization $4,222
• Leverage Ratio < 4X, Current Ratio >1.0
Liquidity $927
Debt Maturity Profile
$1,250
$850 $873
$244
$550
2021 2022 2023 2024 2025 2026 2027 2028 2029
RBL Outstanding RBL Availability 7.50% Senior Notes 9.75% Senior Notes 6.75% Senior Notes
18Improving Credit Profile
Significant Combination of Comstock and Covey Park created the Haynesville leader with
Scale deep Tier 1 drilling inventory and peer-leading cost structure
Sustainable,
Expect to generate meaningful Free Cash Flow to reduce revolver borrowings
Low Cost,
and Hedged Industry leading margins and returns on capital employed
Business ~69% hedged in 2021
Model
Maximizing Focused on capital discipline and deleveraging the balance sheet
Free Cash
Equitized $210 million of convertible preferred stock and refinanced $1,152
Flow million of senior notes which reduced annual fixed charges by $40.5 million
Favorable Bank facility matures in 2024
Maturity
Weighted average senior note maturity of 6.7 years
19
Runway
Improved Financial liquidity of $900+ million
Liquidity Clear line of sight to reducing leverage
19Strong Focus on ESG
Comstock strives to maintain sustainable and safe business practices and is committed to
conducting business in a responsible manner that protects the environment along with the health,
safety and security of employees, contractors and the communities where it operates.
Environmental Social Governance
We utilize natural gas fueled rigs Our Employee Health & Safety
Despite being a controlled
in our drilling operations. Using Management System is designed
company, we maintain a
cleaner burning natural gas to achieving our goals of
majority of independent
rather than diesel fuel allows us operational excellence and
directors who comprise our
to reduce emissions. maintaining an injury free
three oversight committees –
workplace. Components include
Audit, Compensation and
Our active leak detection and intensive employee training,
Governance/Nominating.
repair program uses optical gas periodic audits and inspection
imaging technology to detect and scorecards to measure our Our bonus incentive plan no
leaks so they are repaired success. longer focuses on absolute
immediately. growth metrics and instead has
We hold our contractors
performance measures for
We have improved our accountable to the highest
Return on Equity, Free Cash Flow
completion designs to reduce performance standards for
Generation, Well Cost Efficiency,
our freshwater use volumes for employee safety programs,
Operating Efficiency and Reserve
hydraulic fracturing by policies and procedures,
Replacement as its primary
approximately 30%. including training and we
performance metrics.
monitor compliance with a third
We utilize multi-well pad party management service.
locations and strive to extend We have strong governance
the lateral lengths of our wells to policies in place over stock
Our OSHA Total Recordable
minimize our above-ground ownership, non-discrimination,
Incident Rate was 0.00 in 2018
footprint. anti-harassment and bribery.
and 2019 and 0.45 in 2020.
20Lowering GHG Intensity
Emission Intensity
Emission Intensity
(kg CO2e / boe)
2019 data includes operations of Covey Park Energy for the full year.
21Natural Gas Powered Completions
Comstock has partnered with BJ Energy Solutions to deploy BJ’s next generation fracturing fleet which is fueled by
100% natural gas in its Haynesville shale development program in early 2022
BJ’s TITAN solution will make a substantial contribution toward Comstock’s CO2e and Methane reduction goals while
also improving well economics
BJ’s TITAN Fleet supports the reduction of greenhouse gas emissions while also creating efficiencies including reduced
operating costs, improved mobility, smaller well pad sites, and improved operational reliability
Carbon emissions (CO2e) are reduced by 25% compared to conventional diesel-powered fracturing equipment
This technology allows Comstock to reduce Methane emissions by ~60% compared to diesel only powered equipment, and by
greater than 95% compared to dual fuel options
The TITAN Fleet is comprised of only 8 pumps versus the 18 conventional pumps required for a typical Comstock completion today,
representing a +30% reduction of pad space required
The TITAN Fleet meets the most stringent noise requirements across North America
The three year contract with BJ locks in current completion cost while providing additional cost saving efficiencies, all
while reducing the environmental impact of Comstock’s future well completions
5,000 HHP direct drive natural gas fired turbine
pumping units – 8 units delivering 40,000 HHP
22Appendix
Guidance

                Guidance                                    2021         2

                Production (Mmcfe/d)                     1,330 - 1,425
                % Natural Gas                             97% - 99%
                Development Capital Expenditures ($MM)   $510 - $550
                Leasing Program ($MM)                      $7 - $10
                Expenses ($/Mcfe) -
                  Lease Operating                        $0.21 - $0.25
                  Gathering & Transportation             $0.23 - $0.27
                  Production & Other Taxes               $0.08- $0.10
                  DD&A                                   $0.90 - $1.00
                  Cash G&A                               $0.05 - $0.07

24
Strong Hedging Program
Comstock has ~69% of its oil and gas production hedged in 2021
Natural Gas (Mmbtu/d) Oil (Bbl/d)
Period Swaps Collars Total 1 Swaptions 2 Collars
2021 1Q 607,271 $2.56 270,000 $2.45 / $2.88 877,271 $2.52 1,328 $41.23 / $51.10
2021 2Q 592,184 $2.54 330,000 $2.46 / $2.99 922,184 $2.51 1,500 $41.67 / $51.67
2021 3Q 585,000 $2.53 400,000 $2.47 / $3.03 985,000 $2.51 1,500 $41.67 / $51.67
2021 4Q 560,000 $2.53 400,000 $2.47 / $3.03 960,000 $2.50 1,500 $41.67 / $51.67
2021 FY 585,981 $2.54 350,493 $2.46 / $2.99 936,474 $2.51 1,458 $41.57 / $51.54
2022 1Q 190,000 $2.62 180,000 $2.51 / $3.27 370,000 $2.57 120,000 $2.51
2022 2Q 130,000 $2.68 120,000 $2.50 / $3.17 250,000 $2.59 120,000 $2.51
2022 3Q 130,000 $2.68 70,000 $2.50 / $3.10 200,000 $2.61 120,000 $2.51
2022 4Q 130,000 $2.68 70,000 $2.50 / $3.10 200,000 $2.61 120,000 $2.51
2022 FY 144,795 $2.66 109,589 $2.51 / $3.19 254,384 $2.59 120,000 $2.51
(1) Weighted average price is calculated using the long put price for collars.
(2) The counterparty has the right to exercise a call option to enter into a price swap with the Company on 120,000 MmBtu/d in 2022 at an average price of $2.51.
The call option expires for 100,000 Mmbtu/d at an average price of $2.52 in October 2021 and 20,000 Mmbtu/d at an average price of $2.50 in November 2021.
25Non-GAAP Financial Measure
Reconciliation of Adjusted EBITDAX
In thousands 1Q 2021 1Q 2020 2020 2019
EBITDAX:
Net Income (Loss) $ (134,125) $ 42,028 $ (52,417) $ 96,889
Interest Expense 63,811 52,810 234,829 161,541
Income Taxes (29,967) 11,391 (9,210) 27,803
Depreciation, Depletion and Amortization 109,128 110,425 417,112 276,526
Unrealized Loss (Gain) from Hedges 13,072 (16,483) 124,545 949
Exploration - 27 27 241
Stock-based Compensation 1,690 1,430 6,464 4,020
Loss on Early Extinguishment of Debt 238,539 - 861
2
-
Covey Park July 2019 Hedging Settlements - - - 4,574
Transaction Costs - - - 41,010
Loss (Gain) on Sale of Properties (70) - (17) 25
Total EBITDAX $ 262,078 $ 201,628 $ 722,194 $ 613,578
26You can also read