Investor Presentation - Q2 2020 - First Capital Realty
←
→
Page content transcription
If your browser does not render page correctly, please read the page content below
Q2 2020
Investor Presentation
FORWARD-LOOKING STATEMENTS AND NON-IFRS FINANCIAL MEASURES
 This material may contain forward-looking statements, including those identified by the expressions “anticipate”, “believe”, “plan”, “estimate”, “expect”, “intend”
 and similar expressions to the extent they relate to First Capital REIT (“First Capital”) or its management. The forward-looking statements are not historical facts
 but reflect First Capital’s current beliefs and are based on information currently available to management. Certain material factors and assumptions were applied
 in providing these forward-looking statements, many of which are beyond our control.

 Management believes that the forward-looking statements are based upon reasonable assumptions; however, management can give no assurance that actual
 results will be consistent with those expressed or implied in these forward-looking statements. These forward-looking statements are subject to a number of
 risks and uncertainties that could cause actual results or events to differ materially from those expressed or implied in these forward-looking statements.
 Additional information about the risks and uncertainties that could cause actual results to differ materially, and the material factors or assumptions that were
 applied in providing these forward-looking statements, are contained in our various securities filings, including our quarter end results press release dated
 August 5, 2020, our Management’s Discussion and Analysis for the year ended December 31, 2019 and for the three and six-month period ended June 30,
 2020 (the “MD&As”) and our current Annual Information Form, all of which are available on SEDAR at www.sedar.com and on our website at www.fcr.ca.

 You should not place undue reliance on any such forward-looking statements. Further, a forward-looking statement speaks only as of the date on which such
 statement is made. These forward-looking statements are made as of August 5, 2020. Except as required by securities law, First Capital undertakes no
 obligation to publicly update or revise any such statements whether to reflect new information, the occurrence of future events or circumstances, or otherwise.
 Additionally, past performance, including the key operating metrics described in this presentation, is not indicative of future results given the risks and
 uncertainties described in detail in our MD&As, including with respect to COVID-19.

 This material references certain non-IFRS financial measures, including but not limited to FFO, FFO per share, NOI and NAV. These non-IFRS measures are
 further defined and discussed in the MD&As, which should be read in conjunction with this material and the conference call. Since these non-IFRS measures do
 not have standardized meanings prescribed by IFRS, they may not be comparable to similar measures reported by other issuers. First Capital uses and presents
 the above non-IFRS measures as management believes they are commonly accepted and meaningful financial measures of operating performance.
 Reconciliations of certain non-IFRS measures to their nearest IFRS measures are included in the MD&As. These non-IFRS measures should not be construed as
 alternatives to net income or cash flow from operating activities determined in accordance with IFRS as measures of First Capital’s operating performance.

 All figures in this presentation are as of June 30, 2020 unless otherwise noted.

                                                                                                                                                           First Capital   2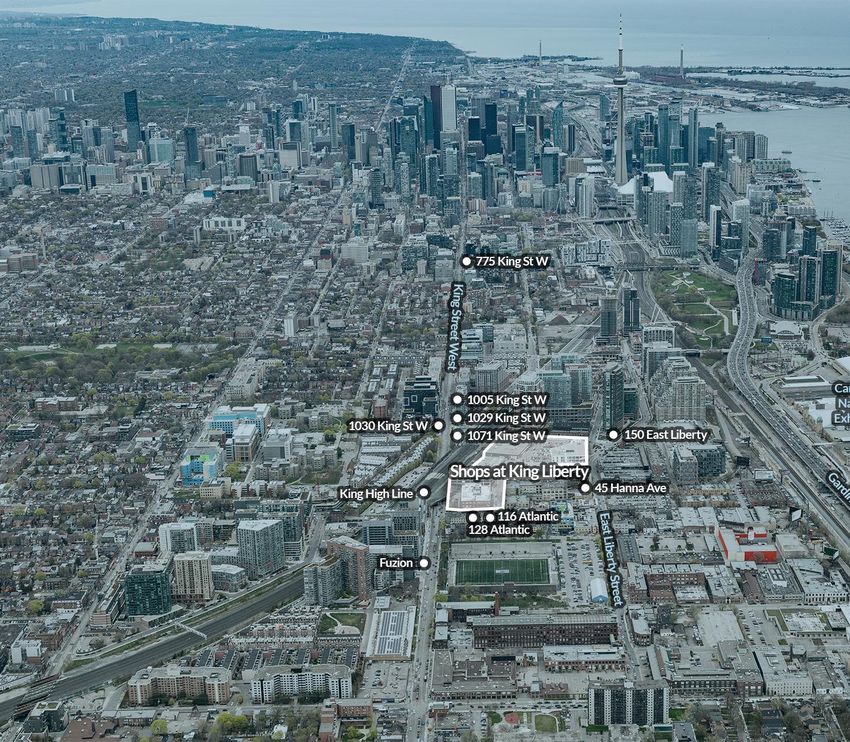
COMPANY SNAPSHOT (TSX: FCR.UN)

First Capital is a leading developer, owner and manager of mixed-use real estate located in Canada’s most
densely populated cities. First Capital’s focus is on creating thriving urban neighbourhoods to generate
value for businesses, residents, communities and our investors.

           149                                                               22.8m sf
       neighbourhoods                          Super                           of gross leasable area
                                                                              (20.3m sf at FCR share)

                                         urban
        $7.8b                       market focus across Canada
                                                                              25.0m sf
        enterprise value                                                    of future incremental density

As of June 30, 2020

                                                                                                   First Capital   3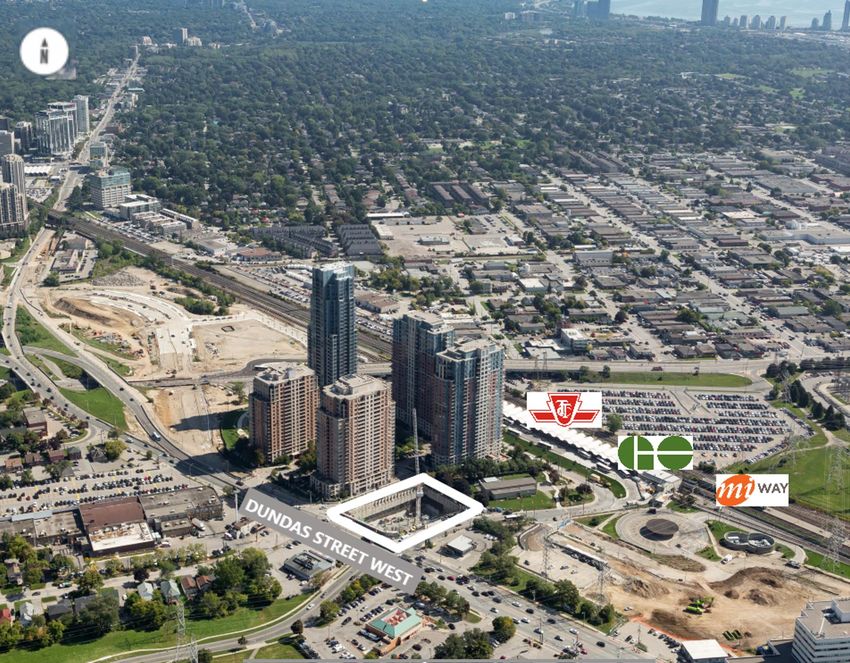
COVID-19 UPDATE

Business Environment Update
• FCR’s tenant mix was designed to provide consumers with their everyday needs
• Tenants representing ~50% of monthly gross rent, deemed essential and remained open during Q2
     o As of August 5, 2020, ~96% of FCR’s tenants were open for business
• Collected 93%* of Q2 gross rent
• Collected 96%* of July gross rent
• Construction at 5 development projects temporarily halted late in Q1 under government directives.
  Construction on all projects resumed during Q2
• $1B of dispositions in the past 18 months (~67% of $1.5b target). Disposition program had been
  temporarily paused but has since resumed
• To support FCR's independent grocery and restaurant tenants and to show its gratitude and thanks for the
  tireless efforts of front line and community service workers, FCR has delivered over 1,300 meals to these
  modern-day heroes

*As of August 5, 2020 after adjusting for approved deferrals or abatements

                                                                                                   First Capital   4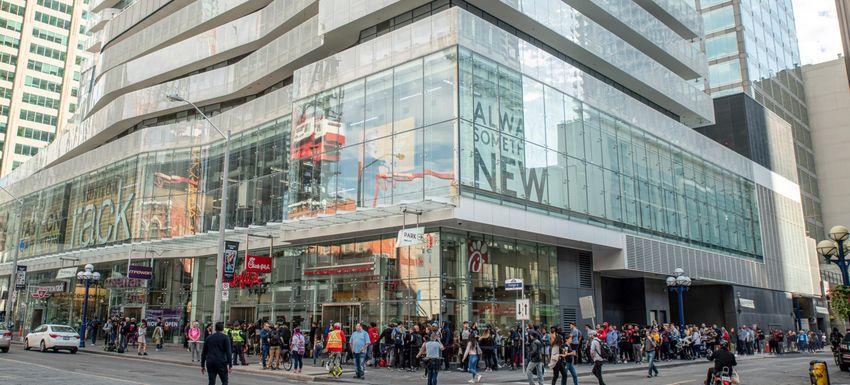
COVID-19 UPDATE

Canada Emergency Commercial Rental Assistance (“CECRA”) Program

Covers the months of April through August 2020
    o Property owner abates 75% of the qualifying tenant’s gross rent
    o Government extends forgivable loan to the property owner for 50% of the gross rent
    o Tenant pays remaining 25% of gross rent
    o FCR is committed to fully supporting its qualifying tenants through participation in the program

Q2 Bad Debt Expense of $16.8m
    o $7.9m relating to the CECRA rental abatement net of the related government receivable
    o $8.9m to provide for other potential uncollectible receivables as a result of COVID-19

• FCR took a conservative view on the collectability of rent due from tenants and assumed full participation
  in the CECRA program by all tenants estimated to be eligible

• Impact of increased bad debt expense was a $0.075 decrease in FFO and in net income per unit

                                                                                                    First Capital   5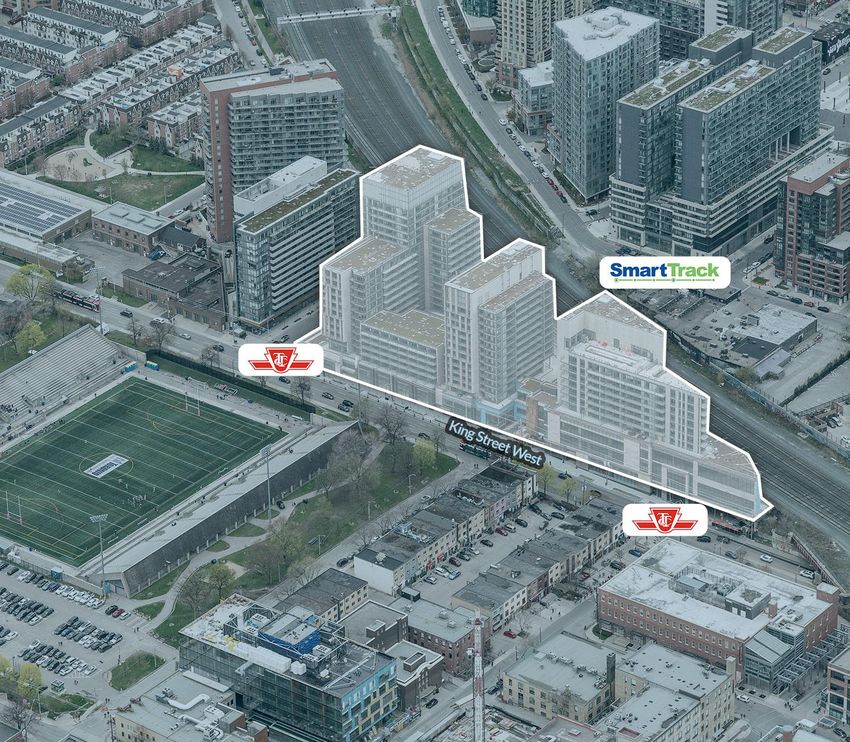
COVID-19 UPDATE

Maintaining a Strong Balance Sheet and Liquidity Position

• ~$770m of cash and undrawn credit facilities*
• Unencumbered properties with an IFRS value of ~$7.0b
• Remaining 2020 debt maturities ~$65m*
• On track to reduce 2020 operating expenses and capital spend by ~$75m
   • ~$60m reduction in capex and development spend
   • ~$15m reduction in G&A and property operating costs

Enhancing Asset Quality
• Asset quality has never been higher due to extensive disposition program and ongoing super urban
  investments
    o 5km population increased to 294k. Highest amongst North American peers
    o 5km household income increased 13% from 2016 to $120k
    o Average base rent increased 12% from 2016 to $21.70 psf. ~30% higher than Canadian peer average

*As of August 5, 2020

                                                                                                 First Capital   6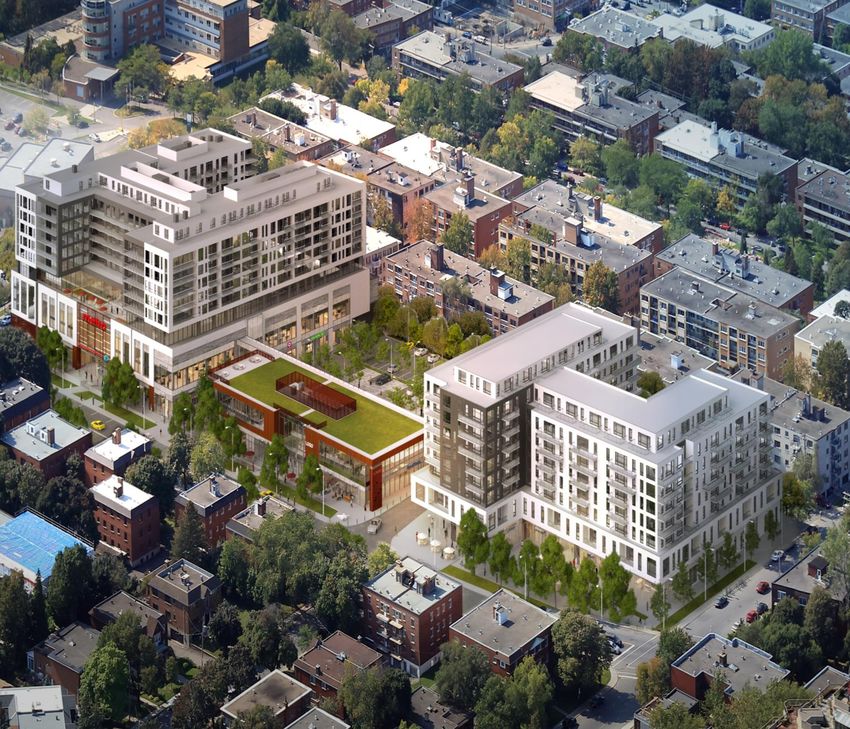
SAFETY MEASURES AT FCR PROPERTIES

 Provincial Restrictions + Guidelines:   Hygiene: hand sanitizer in common        Physical Distancing: encouraging
 as directed by the Chief Medical        areas, enhanced cleaning/disinfection    distancing of 2 metres with signs &
 Officer & Public Health Officials       of high frequency touchpoints, public    floor decals, use of alternate sinks &
                                         awareness signage                        stalls in washrooms, queuing lines for
                                                                                  accessing retailers

  Quick Pick-Up: designated parking      Building Operations: dedicated          PPE: safety protocol for all public
  areas for contactless curbside         access points as IN or OUT only,        facing operations/property
  pickup                                 elevator & escalator passenger          management staff and all third party
                                         limits, promoting staircase use,        contractors & service providers, PPE
                                         directing flow of movement with         dedicated waste disposal receptacles
                                         floor decals                            near entrance points
                                                                                                            First Capital   7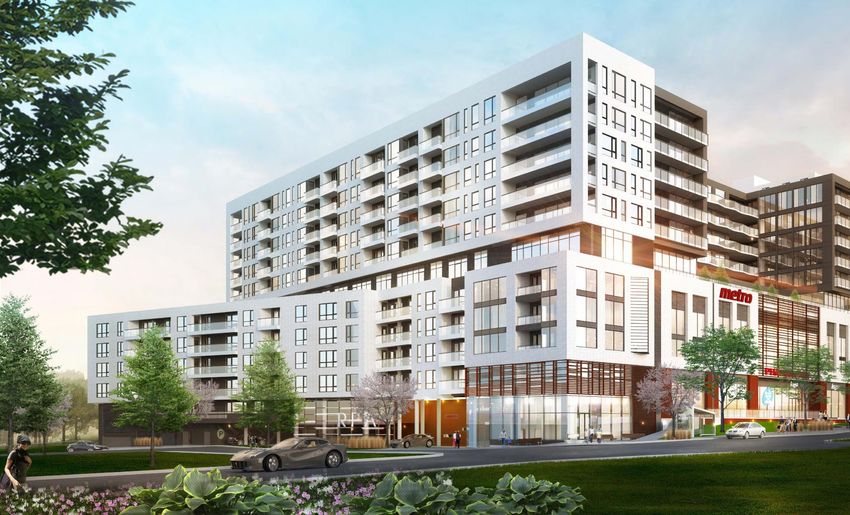
SUPER URBAN INVESTMENT STRATEGY

Creating thriving urban neighbourhoods to generate value for businesses, residents, communities and
our investors

• Investing in high-quality, mixed-use properties to build positions in targeted high growth areas

• Fully integrating retail with other uses to create thriving urban neighbourhoods

• Optimizing the portfolio through active asset management and by concentrating capital in dense, high
  growth neighbourhoods

• Surfacing substantial unrecognized value in our 25.0m sf of density pipeline through entitlements and
  development

• Actively managing our balance sheet to maintain financial strength and flexibility and a competitive cost of
  capital

                                                                                                      First Capital   8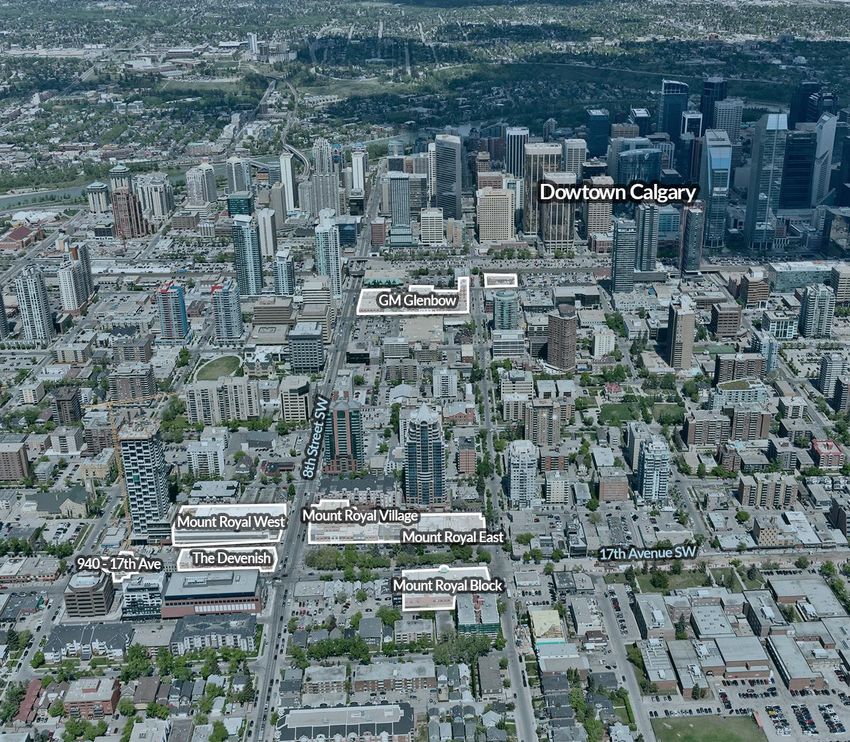
SUPER URBAN NEIGHBOURHOODS

 We define a super urban property based on its proximity to transit, its “Walkability Score”, and most
 importantly its population density and expect to continue to improve these metrics over time through our
 investment and disposition activity.

   >99%
      Public Transit
                       Of portfolio within 5-minute walk of public transit

       78
       Walk Score
                       Average walk score for our portfolio = ‘Very Walkable’

    294k
       Population
                       Average population density within a 5-km radius of each of our properties

                                                                                                    First Capital   9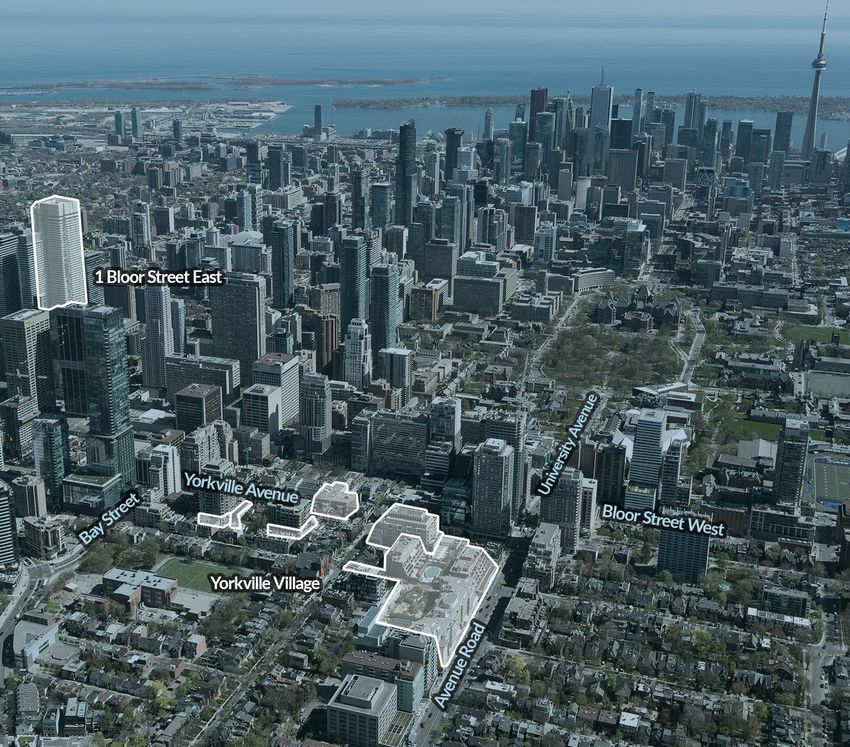
Canada's
Super Urban
  Portfolio
       First Capital   10
SUPER URBAN NEIGHBOURHOODS IN CANADA’S LARGEST CITIES
Vancouver, Calgary,
Western Canada Central Canada Toronto Eastern Canada Montreal, Ottawa
Edmonton
Properties 44 Properties 64 Properties 41
GLA 6.8m GLA 8.6m GLA 4.9m
Fair Value % 31% Fair Value % 53% Fair Value % 16%
Edmonton 8%
Calgary 12%
Vancouver 11%
SW Ontario 2%
48%
12% Montreal
Toronto
4%
Ottawa
Kitchener/Waterloo/Guelph 3%
First Capital 11NORTH AMERICAN LEADER IN POPULATION DENSITY
FCR Portfolio Demographic Metrics vs. its Peer Group: Q2 2020 *
$120,000 US $125,000
294,000 $108,000
154,000
138,000
US Peers **
FCR Q2 **US Peers ***CDN Peers FCR Q2 **US Peers ***CDN Peers
2020 2020
5 km Population 5 km Average Household Income
As of June 30, 2020
* Source: Sitewise, Environics Analytics (2019 estimates)
** US Peers include: Federal Realty and Regency Centers – Source: Company Reports
*** Canadian Peers include: Riocan, SmartCentres, Choice Properties (Retail only)
Property portfolio based on 2019 AIF, Source: Company Reports, Sitewise, Environics Analytics First Capital 12GROWTH IN 5km POPULATION DENSITY
300,000
+20%
• Q2 5km population of 294,000 people
• Up 87,000 or 40% from December 2016 293,000
• Making us a leader amongst our North
American peer group*
+20%
250,000
• Targeting 300,000 people by 2021
207,000
Q4 Q4 Q1
2016 2018 2020 2021
5 km Population
*North American Peer group includes: Riocan, SmartCentres, Choice Properties, Federal, and Regency Centres
First Capital 13STRONG HISTORICAL GROWTH IN NAV PER SHARE 2015
+5.2% $22.59
$23.39
CAGR 2015 - 2019
$21.85
$19.53
$18.25
2015 2016 2017 2018 2019
First Capital 14CONSISTENTLY HIGH PERFORMANCE
Total Same Property NOI Growth
4.0%
2.9% 3.3%
10 Year Average 3.0%
2.0%
1.0%
0.0%
2010 2011 2012 2013 2014 2015 2016 2017 2018 2019
First Capital 15CONSISTENTLY HIGH PERFORMANCE
Lease Renewal Rate Increases
12.0%
10.7%*
10.0%
9.3% 8.0%
10 Year Average
6.0%
4.0%
2.0%
0.0%
2010 2011 2012 2013 2014 2015 2016 2017 2018 2019
Represents increase on total portfolio basis. Includes all renewals and contractual fixed rate renewals.
* The Trust achieved a 18.0% lease renewal rate increase when comparing the net rental rate in the last year of the expiring term to the average net rental rate over the renewal term.
First Capital 16PREMIER PORTFOLIO
HIGHEST RENTS IN SECTOR
FCR rents are 31% higher than peer group average
3.0% $21.70
$19.89
FCR Average rent growth 5 year CAGR $18.69 Peer Group
Average $16.53
$15.54
$14.69
$13.85
1.8%
Peer Average rent growth 5 year CAGR
Q2 2020 Base Rent
*Rates for Crombie and Choice are average expiring rent as in-place rent is not disclosed.
First Capital 17STRATEGIC AND DIVERSIFIED RETAIL TENANT MIX
# of Stores % of Rent
Grocery Stores 118 17.0%
Medical, Professional &
1,360 15.4%
Personal Services
Restaurants & Cafes 950 14.5%
Pharmacies 118 9.1%
Banks & Credit Unions 191 8.2%
Fitness Facilities 81 3.7%
Liquor Stores 92 3.4%
Daycare & Learning
102 1.5%
Centres
Other Necessity-Based
502 18.4%
Retailers
Other Tenants 532 8.8%
18TOP 20 RETAIL TENANTS
Contribute 45% of annualized minimum rent (AMR)
Investment Investment
Rank # Tenant AMR
Grade
Rank # Tenant AMR
Grade
1. 10.3% * 11. 1.4%
2. 5.6% 12. 1.3%
3. 2.9% 13. 1.3%
4. 2.7% 14. 1.2%**
5. 2.5% 15. 1.1% -
6. 2.0% 16. 1.1%
7. 1.8% 17. 1.0%
8. 1.8% - 18. 1.0%*** -
9. 1.8% - 19. 1.0% -
10. 1.7% 20. 1.0%
* Includes Shoppers Drug Mart ** Includes Rexall, Rexall Pharma Plus and Remedy’s Rx
***Includes Tim Hortons, Burger King and Popeyes
19PORTFOLIO QUALITY HAS NEVER BEEN HIGHER WITH $1.4b OF INVESTMENT ACTIVITY IN 2019
2019 5km Average 5km Average
$ Amount Population Household Income
Acquisitions $392m 535,000 $132,000
Development Spend $166m 389,000 $117,000
Investment Total $558m 484,000 $127,000
Dispositions $835m 138,000 $101,000
First Capital 20Density Pipeline
SIGNIFICANT FUTURE DENSITY PIPELINE

Density Pipeline = 25.0m sf
7.2m sf (29%) in IFRS NAV
    • 0.6m sf under active development
    • 6.5m sf future incremental density
      valued at $512m or $79 psf
    • 0.1m sf residential inventory

                                           Yonge & Roselawn    Toronto, ON   Christie Cookie Site   Toronto, ON

                                           1071 King St West   Toronto, ON   Leslie & York Mills    Toronto, ON

                                                                                                     First Capital   22
ENTITLEMENTS PROGRAM
• 2019 entitlement applications of 9.0m sf surpassed our goal of 7.5m sf
• Once approved, FCR expects to recognize a meaningful increase to the current IFRS value
• Pre-2019 and 2019 entitlement applications totaled 12m sf, representing close to 50% of FCR’s 25.0m sf of density pipeline
• Planned 2020 entitlement applications totaled 4m sf, representing 16% of FCR’s 25.0m sf of density pipeline
• Due to the COVID-19 pandemic, FCR expects to achieve ~50% of its planned goal for 2020 entitlement submissions
sf in ‘000s Residential Commercial Total Incremental
Pre-2019 Entitlement Applications 3,000 700 3,700 3,500
2019 Entitlement Applications 8,000 1,000 9,000 8,500
2020 Entitlement Applications 3,900 400 4,300 4,000
Total Entitlement Applications 14,900 2,100 17,000 16,000
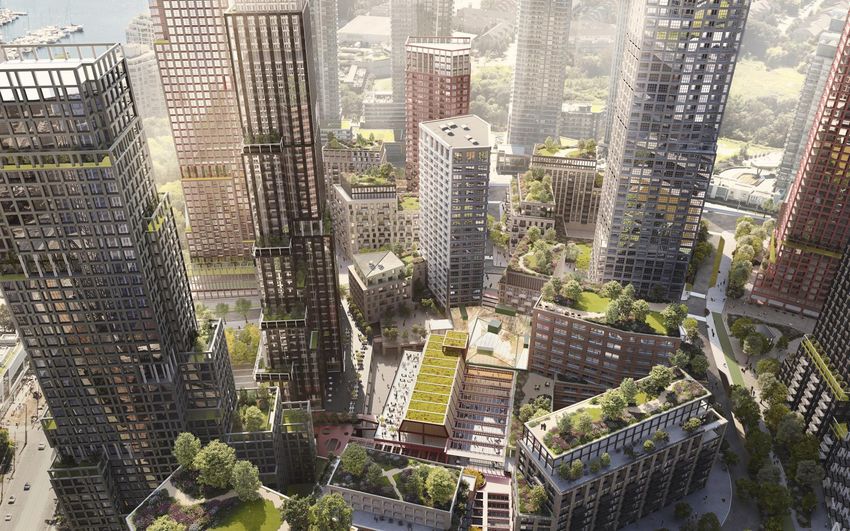
First Capital 23Master Planned Super Urban Neighbourhood
Future Mixed-Use
Neighbourhood
Former Christie Cookie Site, Toronto, ON
28 ACRES
Demographics
5KM AVG
2019 Estimates
Population 269,200
Average Household Income $113,800
First Capital 24Master Planned Super Urban Neighbourhood
Future Mixed-
Use Neighbourhood
Former Christie Cookie Site, Toronto, ON
Planned Gross Floor Area (at 100%)
Residential GFA ( ~7,500 Units) 6,000,000 sf
Retail GFA 500,000 sf
Office GFA 500,000 sf
Total GFA 7,000,000 sf
Targeted Start 2024/2025
First Capital ownership 50%
25% of Site Open Space
First Capital 25Current
Future Mixed-Use Project
Yonge & Roselawn
Toronto, ON
Demographics
5KM AVG
2019 Estimates
Population 480,000
Average Household Income $188,400
First Capital 26Future
Future Mixed-Use Project
Yonge & Roselawn
Toronto, ON
Current Retail GLA 64,000 sf
Future Residential GFA (687 Units) 533,000 sf
Future Retail GFA 65,000 sf
Total Future GFA 598,000 sf
Targeted Start 2022
First Capital 27Super Urban
Neighbourhoods
28Super Urban Neighbourhood
Bloor-Yorkville
Toronto, ON
Property Statistics
5KM AVG
2019 Estimates
Population 741,100
Average Household Income $132,000
Gross Leasable Area
Yorkville Village 315,000 sf
One Bloor East 85,000 sf
Hazelton Hotel (FCR share) 40,000 sf
Total Bloor/Yorkville 440,000 sf
Future Density 135,000 sf
First Capital 29SUPER URBAN NEIGHBOURHOOD - BLOOR-YORKVILLE
Recently Completed Re-Development - Yorkville Village Mall, Toronto
Avenue Road Newly Constructed Yorkville Entrance
Interior Events Program
First Capital 30Super Urban Neighbourhood
Bloor-Yorkville
Yonge and Bloor, Toronto, ON
First Capital 31Super Urban Neighbourhood
Bloor-Yorkville
One Bloor East, Toronto, ON
Property Statistics
Retail GLA 85,000 sf
Commercial Parking 52 Stalls
Key Tenants
Direct Access to the Bloor-Yonge subway, the busiest
station in Canada serving >400k people per day
First Capital 32Super Urban Neighbourhood
Bloor-Yorkville One Bloor East: McEwan 2019 Opening
First Capital 33Super Urban Neighbourhood
Bloor-Yorkville One Bloor East: Chick-fil-A Canadian Flagship 2019 Opening
First Capital 34SUPER URBAN NEIGHBOURHOOD - BLOOR-YORKVILLE
Recent Acquisition: 140 Yorkville Avenue, Mixed-Use Development
C
B
A
Bloor-Yorkville A 140 Yorkville Avenue
B Yorkville Village Mall C Hazelton Hotel
First Capital 35Super Urban Neighbourhood
Liberty Village
Toronto, ON
Demographics
5KM AVG
2019 Estimates
Population 546,500
Average Household Income $111,700
Acreage 14.1
Retail GLA 396,000 sf
Residential GLA 328,000 sf
Office GLA 103,000 sf
Total GLA 827,000 sf
First Capital 36Super Urban Neighbourhood
Griffintown
Montreal, QC
Demographics
5KM AVG
2019 Estimates
Population 411,400
Average Household Income $96,000
Acreage 3.2
Retail GLA 254,000 sf
First Capital 37Super Urban Neighbourhood
Griffintown
Montreal, QC
Key Tenants
First Capital 38Calgary's Premier Super Urban Neighbourhood
Mount Royal Village
Calgary, AB
Demographics
5KM AVG
2019 Estimates
Population 231,300
Average Household Income $147,000
Acreage 4.1 .
GLA 380,000 sf
First Capital 39Before
Current
Calgary's Premier Super Urban Neighbourhood
Mount Royal Village
Calgary, AB
Redevelopment Phase Completed
Gross Leasable Area 118,000 sf
First Capital 40Current
Calgary's Premier Super Urban Neighbourhood
Mount Royal Village
Calgary, AB
Gross Leasable Area 98,300 sf
Key Tenants
First Capital 41Active Developments
DEVELOPING IN SUPER URBAN NEIGHBOURHOODS
Active Development: 0.6m sf = 0.2m sf Commercial + 0.4m sf Residential
King High Line Toronto, ON 3080 Yonge Street Toronto, ON Dundas & Aukland Toronto, ON
Leaside Village Expansion Toronto, ON Centre Commercial Wilderton Montreal, QC
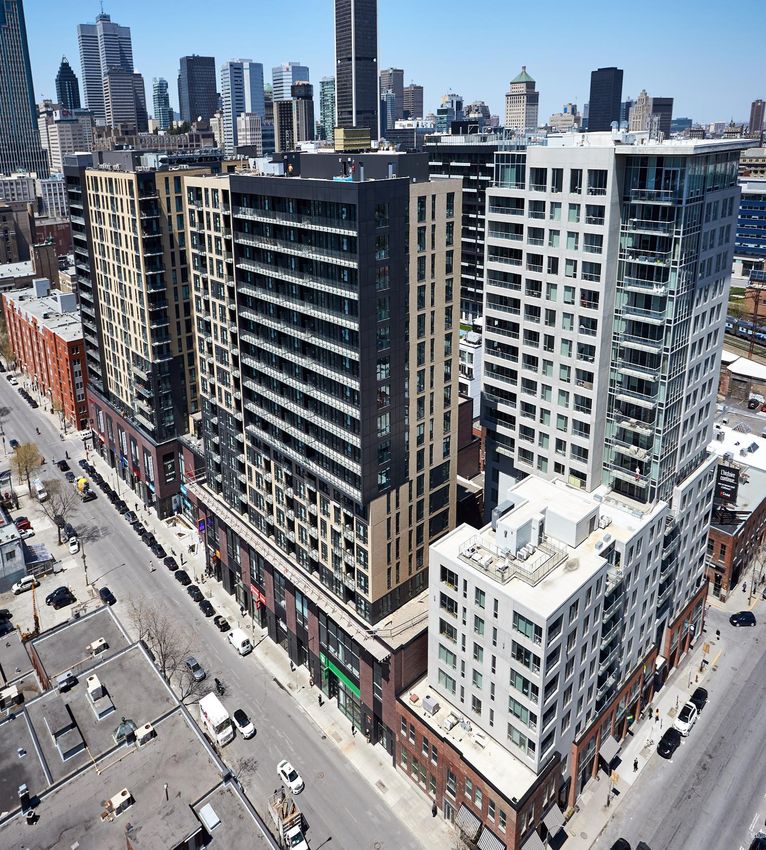
First Capital 43Super Urban Neighbourhood
King High Line
Liberty Village, Toronto, ON
Property Statistics
Acreage 2.8
Residential Units 506
Retail GLA 156,000 sf
100% Commercial
FCR Ownership
67% Residential
Commercial Tenants
First Capital 44Super Urban Neighbourhood
King High Line Toronto, ON
First Capital 45Ground-Up Development
Dundas & Aukland
Toronto, ON
First Capital 46Future
Ground-Up Development
Dundas & Aukland
Toronto, ON
Demographics
5KM AVG
(2019 Estimates)
Population 271,800
Average Household Income $133,200
Gross Leasable Area (at 100%)
Retail GLA 43,000 sf
Residential GLA 267,000 sf
Total GLA 310,000 sf
FCR Interest 71%
Key Tenants
First Capital 47Super Urban Neighbourhood
Centre
Commercial Wilderton
Montreal, QC
Re-development Commenced
Demographics
5KM AVG
2019 Estimates
Population 635,500
Average Household Income $90,700
First Capital 48Under Construction
Super Urban Neighbourhood
Centre
Commercial Wilderton
Montreal, QC
Re-development Commenced
Property Statistics
Acreage 5 acres
Pre-redevelopment GLA 112,000 sf
Post Redevelopment GLA
Retail GLA 130,000 sf
Residential GLA 500,000 sf
Total GLA 630,000 sf
Key Tenants
First Capital 49Super Urban Neighbourhood Before
3080 Yonge St
Toronto, ON
Fully Integrated with Lawrence Subway Station
Demographics
5KM AVG
2019 Estimates
Population 406,400
Average Household Income $190,200
Current
Total Acreage 2.0
Retail GLA 49,000 sf
Office GLA 169,000 sf
Total GLA 218,000 sf
Key Tenants
First Capital 50Active Development
Leaside Village Expansion
Toronto, ON
Demographics
5KM AVG
(2019 Estimates)
Population 483,600
Average Household Income $170,000
Gross Leasable Area (at 100%)
Retail GLA 44,000 sf
Office GLA 28,000 sf
Total 72,000 sf
Key Tenants
Construction Commenced October 2019
First Capital 51Future
Development
Significant Density Pipeline
First Capital 52SHORT-MEDIUM TERM DEVELOPMENT READY
Phase 2
Humbertown Phase 1 Residential Toronto, ON Wilderton Phase 2 Residential Montreal, QC
Yonge & Roselawn Toronto, ON
First Capital 53SHORT-MEDIUM TERM DEVELOPMENT READY
1071 King (Liberty Village) Toronto, ON 140 Yorkville Toronto, ON
400 King Street West Toronto, ON
First Capital 54Future Development
Humbertown
Shopping Centre
Toronto, ON
Demographics
5KM AVG
(2019 Estimates)
Population 346,500
Average Household Income $122,700
Size 9.0 acres
First Capital 55Future Development Phase 1
Edenbridge Kingsway
Humbertown, Toronto, ON
Phase 1
Size 1.8 acres (Phase 1)
Future
Retail GFA 7,000 sf
Residential GFA 245,000 sf
Total Future GFA 252,000 sf
Partner Residential 50%
Targeted Phase I Start 2021
First Capital 56Future
Future Development
1071 King Street West
Toronto, ON
Demographics
5KM AVG
2019 Estimates
Population 556,000
Average Household Income $111,000
Gross Floor Area (at 100%)
Residential GFA 198,000 sf
Retail GFA 5,000 sf
Total GFA 203,000 sf
Ownership Interest 67%
Targeted Start 2021
First Capital 57Existing
Future Development
400 King Street West
Toronto, ON
Demographics
5KM AVG
2019 Estimates
Population 560,000
Average Household Income $123,000
First Capital 58Future
Future Development
400 King Street West
Toronto, ON
Gross Floor Area (at 100%)
Residential GFA 415,000 sf
Retail GFA 38,000 sf
Total GFA 453,000 sf
Ownership Interest 35%
Targeted Start 2021/2022
59Environmental, Social
and Governance (ESG)
60ESG INITIATIVES
Canada’s Top Small & Recognized as one of 2020 Green Lease Leader Honouree in the
Medium Employers Greater Toronto’s Top by Institute for Market Globe & Mail’s inaugural
100 Employers Transformation “2020 Women Lead Here” list
175 119 AAA High 2019 ESG scores*
Environmental: 2
Social: 1
Properties certified LEED-certified projects Highest rating possible
76% of portfolio GLA > 3.7m sf Governance: 1
* On a scale of 1-10, with 1 being the highest
First Capital 61ESG INITIATIVES
10% decrease in Greenhouse Gas (GHG) emissions
in the last 4 years (2015-2019)
25 26
25
Emissions (tCO2e) (thousands)
24
24
GLA (ft2) (millions)
23
23
22
22
21
21
20 20
2015 2016 2017 2018 2019
GHG Emissions (tCO2e) Reporting GLA (ft2)
First Capital 62ENHANCING SUPER URBAN NEIGHBOURHOODS THROUGH PUBLIC ART
27 Public Art Installations across our portfolio
Supporting Public Art Competitions in partnership with
First Capital 63STRONG GENDER DIVERSITY METRICS
ACROSS ALL LEVELS OF THE
ORGANIZATION
EXECUTIVE BOARD
MEMBERS MEMBERS
63% Women 37% Men 22% Women 78% Men
MANAGEMENT TOTAL
Honouree in the Globe and Mail’s inaugural EMPLOYEES
ROLES
“2020 Women Lead Here” list
Over 50% of management positions are held by females
53% Women 47% Men 61% Women 39% Men
First Capital 64FCR SUPPORTS BLACKNORTH INITIATIVE
BlackNorth Initiative is a movement calling on Canadian
organizations to make a commitment to end systemic racism
FCR is among 200 Canadian companies who signed the pledge and committed to:
• Implement unconscious bias and anti-racism education
• Enhance diversity and inclusion strategies
• Hire at least 5% of black students by 2025
• Build a pipeline of talent with at least 3.5% of black leaders in the more senior ranks of the
company by 2025
First Capital 65Financial Strength
and Flexibility
Super Urban
NeighbourhoodsCAPITAL STRUCTURE
Enterprise Value $7.8b
19%
Mortgages and Secured Facilities: $1.5b
Unsecured Debentures: $2.3b
Unsecured Term Loans: $0.7b
42%
Unsecured Revolving Facilities:
$0.3b
($800m total capacity)
Total Unsecured $3.3b
39%
Trust & Exchangeable Units:
$3.0b (219.0m units)
As of June 30, 2020
First Capital 67FINANCIAL STRENGTH AND FLEXIBILITY
As at Q2 2020 2019 2018 2017 2016
Unsecured revolving credit
$800 $800 $800 $800 $800
facilities (million)
70% Unencumbered assets (billion) $7.0 $7.0 $7.3 $7.4 $6.6
Unencumbered assets to
of Q2 2020 assets unsecured debt
2.1x 2.2x 2.5x 2.4x 2.4x
Secured debt as % of total assets 14.5% 14.5% 14.0% 12.7% 12.7%
Net debt to total assets 47.3% 46.7% 42.1% 43.4% 44.9%
Net debt to EBITDA 11.0x 10.0x 9.6x 9.9x 9.6x
EBITDA interest coverage 2.2x 2.4x 2.5x 2.5x 2.5x
First Capital 68$800 5.5%
WELL-STAGGERED TERM
Millions
Unsecured Term Loans
DEBT MATURITIES
Mortgages 5.0%
$700 Senior Unsecured Debentures
Weighted Average Interest Rate 3.8%
Weighted Average Effective Interest % 4.5%
Term to Maturity 4.9 years
$600
4.0%
96% of Term Debt is Fixed Rate
$500 3.5%
3.0%
$400
2.5%
$300 2.0%
1.5%
$200
1.0%
$100
0.5%
2015 2016 2017 2018 2019
As of September 1, 2020
$- 0.0%
* Not including principal amortization 2020 2021 2022 2023 2024 2025 2026 2027 2028 2029 2030 2031
% Due* 0.0% 5.6% 12.3% 11.3% 16.0% 9.7% 13.6% 13.1% 7.8% 5.4% 3.8% 1.2%IMPROVING FFO PAYOUT RATIO
$350 84%
82%
$302 82%
$300 $287
$284
$261 80%
$250 $236 78%
78% 76%
$200
74%
$150 74%
72%
$100 70%
71%
70% 68%
$50
66%
$0 64%
2015 2016 2017 2018 2019
FFO excl OGLE/share $1.05 $1.10 $1.16 $1.21 $1.24
Cash Dividends per share $0.86 $0.86 $0.86 $0.86 $0.86
ACFO less Dividend $25m* $32m 2015 $34m2016 2017
$55m 2018$49m 2019
*Annual retained operating cash
First Capital 70OUTLOOK
Canada’s Super Urban Portfolio COVID-19 Update
• Investing in high-quality, mixed-use real estate • FCR has and will continue to be guided by its corporate
located in Canada’s most densely populated cities, responsibility and sustainability program and values
with a focus on creating thriving urban
neighbourhoods to generate value for businesses, • As a way to support FCR's independent grocery and
residents, communities and our investors restaurant tenants and to show its gratitude and thanks for
the tireless efforts of front line and community service
• Completing strategic dispositions to reduce leverage workers, FCR has delivered over 1,300 delicious and
post the April 2019 share repurchase transaction and nutritious meals to these modern-day heroes
to fund investment program
• Based on FCR’s portfolio demographics and tenant mix,
which has always been focused on everyday essentials, FCR
believes that its high quality portfolio will continue to have
high demand for space
First Capital 71Adam Paul
President & CEO
Kay Brekken
Executive VP & CFO
First Capital
Shops at King Liberty
85 Hanna Ave, Suite 400
Toronto, ON
Tel: 416-504-4114
fcr.ca
TSX: FCR.UN
72You can also read