INVESTOR PRESENTATION - September 2019 - Elanders Group
←
→
Page content transcription
If your browser does not render page correctly, please read the page content below
INVESTOR PRESENTATION
September 2019

Elanders today Almost 7,000 employees in some 20 countries. Annual net sales SEK 11 billion. More than 90 locations. 9 2

Our business areas in 2019

             SUPPLY CHAIN             PRINT & PACKAGING
              SOLUTIONS                   SOLUTIONS

           Share of total net sales    Share of total net sales

                 80%                         20%

3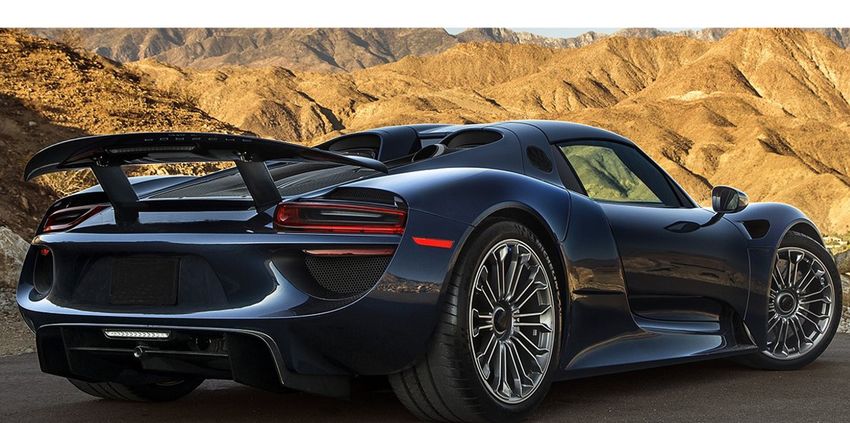
Our major customer segments

                  Our major customer segments' share of total net sales

    25%          35%                 15%
Automotive

             25%

5
Case – Automotive
Centralized hub for production, development & spare parts
End-to-end supply chain solution (pick up at the Just-in-sequence deliveries to
supplier and deliver to customer site). the customer's different facilities.
The solution also includes the handling of Daily volume of 60 trucks.
special packaging for the various car parts.
COCKPIT
Data
SUPPLIER
PHYSICAL TRANSPORT
SHUTTLE TRANSPORT
CROSS DOCK
SUPPLIER CLIENT
SUPPLIER CLIENT
SUPPLIER CLIENT
SUPPLIER
Material/empties
6
Electronics

              35%

7
Case – Electronics
Electronic products
Elanders took over the business starting from July 2018.
Contract over five years with an option to prolong for another three
years.
Location at existing site in Germany.
Employees: 125 FTE.
Products: TV, Cameras, Air Condition etc. for the European market.
MANUFACTURING CUSTOMS AND DISTRIBUTION SERVICES DELIVERY
CONTROL TOWER WAREHOUSE
8
Health Care & Life Science

                             5%

9
Case – Health Care & Life Science
From logistics to service provider in medical technology
Elanders is an outsourcing partner regarding a customer’s diagnostic equipment
Elanders' services includes, but are not limited to, the following:
- Distribution of equipment, spare parts and consumables
- Installation and service on site
- Return handling including repairs in Elanders repair center, where 20 technicians work
- Recycling of discontinued equipment
WAREHOUSING DELIVERIES REPAIR CENTER SERVICES ON SITE SERVICES RECYCLING
10Industrial
15%
11Case – Industrial
Industrial orders with extremely short lead times
Elanders is an outsourcing partner to a heating products and hot water solutions
company in Germany
When Elanders took over the business 52 service centers became seven distribution centers
Elanders’ services for the customer include everything from:
- Distribution and exports of heat pumps, radiators and spare parts
- Orders are received until 22:00 with delivery the next day
- The components that are handled are ranging from small parts to heat pumps weighing hundred of kilos
and several meter long metal pipes
- Deliveries of 17,000 order lines per day from the seven distribution centers that together comprise PREVIOUS: 52 service centers in Germany.
100,000 m2 in floor space TODAY: 6 local and one regional distribution centers.
TOTAL 100,000 M2 17,000 ORDER LINES/DAILY
PRODUCTION DISTRIBUTION CENTERS DELIVERIES MARKET
12Fashion & Lifestyle
15%
13Case – Fashion & Lifestyle
Exclusive products requires flexible logistics solutions
Elanders is a global outsourcing partner regarding a customer’s high-end
products
High-end fashion is a fast moving market which demands fast and flexible
delivery capabilities
Annual volume of 1.8 million products for nine different sub brands
Elanders' services include the following:
- Picking up products at the customer’s suppliers, quality control and storage
- Value-added services such as unpacking, ironing, sewing, labeling and special
packaging
- Global distribution through three distribution centers in Munich, Boston and Hong Kong
to over 1,800 sales locations worldwide
1.8 MILLION PRODUCTS 1,800 SALES
LOCATIONS
PRODUCTION IN ASIA FREIGHT WAREHOUSES SERVICES DISTRIBUTION MARKET
14Case – Fashion & Lifestyle
Subscription boxes
The supply chain operations started in our Atlanta
printing facility in the end of 2015.
12 different customers.
750,000 outbound deliveries / month.
10,000 different products.
Estimated sales of MUSD 50 in 2019.
INBOUND LOGISTICS TESTS KITTING AND ASSEMBLY E-COMMERCE DELIVERY
15Sustainability 16
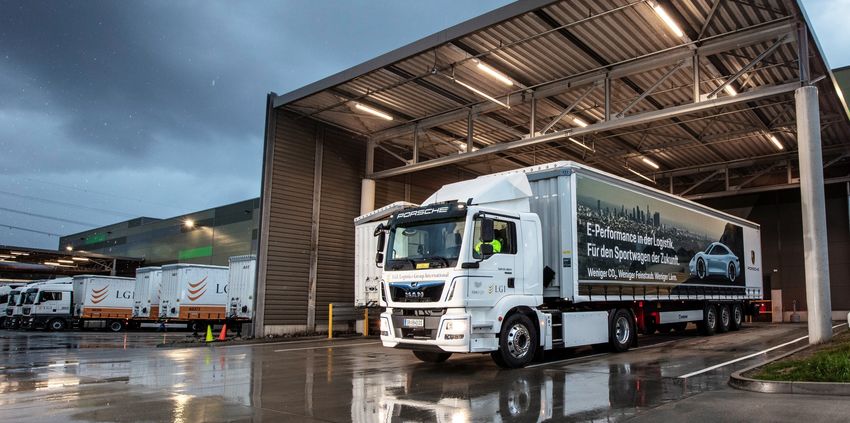
Case – Innovations
Electric truck for a major sports car manufacturer
Elanders has, together with one of its customers,
invested in an electric truck from MAN. The truck
has a operating range of 130 kilometers after
being fully charged. The eTruck
reduces the
5-6 times per day the truck travels the distance of carbon
19 kilometer between Elanders' warehouse and dioxide
emissions by
the customer's factory.
30 tons per
This truck is the first of its kind being used in daily year
operations on public roads in Germany.
The customer has developed a charging station
for the truck, which has been installed at
Elanders' warehouse.
The truck is charged at the same time as goods
are being loaded onto the truck. 45 minutes of
charging gives it an operating range of 100
kilometers.
17Financials 18
The first six months 2019 Actual (excluding IFRS 16 effects) Net sales increased by ten percent to MSEK 5,525 (5,035), of which five percentage points were organic growth. EBITA increased to MSEK 237 (199), which corresponded to an EBITA margin of 4.3 (4.0) percent. The net result increased to MSEK 120 (76) or SEK 3.02 (2.10) per share. Operating cash flow increased to MSEK 390 (-34). Excluding the effects of implementing IFRS 16, operating cash flow increased to MSEK 220 (-34). Cash flow for the period includes a positive one-off effect of MSEK 47 (0) from sales of accounts receivable, i.e. factoring. The Net Debt / EBITDA ratio (rolling 12 month) decreased to 3.3 from 5.2 same period last year. 19
uppdateras
The first six months 2019 (cont.)
                                                                                                        uppdateras

Supply Chain Solutions (excl. IFRS 16 effects)                                                         Print & Packaging Solutions                           (excl. IFRS 16 effects)
                                                    Jan-Jun                Jan-Jun                                                                         Jan-Jun                 Jan-Jun
 Key figures                                           2019                  2018*                       Key figures                                          2019                   2018*

 Net sales, SEK million                                 4,361                  3,982                     Net sales, SEK million                                1,205                   1,067

 EBITA, SEK million                                       190                     155                    EBITA, SEK million                                         63                     54

 EBITA margin, %                                           4.4                    3.9                    EBITA margin, %                                           5.2                    5.1

               Share of total net sales            Share of EBITA                                                     Share of total net sales           Share of EBITA
                   (rolling 12m)                    (rolling 12m)                                                         (rolling 12m)                   (rolling 12m)

                       79%                            75%                                                                     21%                            25%

* The figures for the comparison period have been adjusted to reflect the new structure of business areas. The figures for 2018 have not been adjusted for IFRS 16 since the transition to IFRS 16 have been based
on the modified retrospective approach.

20
Our customer segments
Sales Q2, 2019
(rolling 12m), Sales 2018,
Customer segments MSEK MSEK Outlook (based on Q2)
Automotive 2,558 2,499 Stable demand, even though market is down with a few
percentages.
Electronics 3,824 3,520 No signs of weakness in the market yet for our major
customers. The outcome from the trade war between the
USA and China is a big question mark.
Fashion & Lifestyle 1,975 1,826 Good growth in general.
Health Care & Life Science 266 265 Stable market for the moment.
Industrial 1,620 1,662 Negative trend for our major customers, which affect our
sales.
Other 989 970 A mix of many customers. Difficult to say a clear trend.
Total net sales 11,232 10,742
21IFRS 16 impact
Financial overview First six months Rolling 12 months
2019 2019
excl. 2019, excl.
2019 IFRS 161) 2018 Q2 3)
IFRS 161) FY2018
Net sales, MSEK 5,525 5,525 5,035 11,232 11,232 10,742
EBITDA, MSEK 683 336 302 1,451 759 725
EBITA, MSEK 2) 255 237 199 595 561 523
EBITA-margin, % 4.6 4.3 4.0 5.3 5.0 4.9
Net debt at the end of the period, MSEK 4,587 2,513 2,915 4,587 2,513 2,915
Net debt/EBITDA ratio 3) 3.4 3.7 4.8 3.2 3.3 4.0
1)
Excluding the effect from the transition to IFRS 16, which means that the same accounting principles as 2018 have been
used. IFRS 16 is effective from 1 January 2019 and has affected the accounting of the Group’s lease agreements. For more
details, see page 13.
2)
EBITA refers to Earnings before interest, taxes and amortization; operating result plus amortization of assets identified in
conjunction with acquisitions.
3)
Half year IFRS 16 effect has been extrapolated for the full year.
22Questions? 23
You can also read