2019 Interim Results Presentation - 30 July 2019 Digitalisation Transformation - Hutchison ...
←
→
Page content transcription
If your browser does not render page correctly, please read the page content below

2019 Interim Results
Presentation
30 July 2019
                       Digitalisation
                       Transformation
Disclaimer
The information, statements and opinions contained in this Presentation and any subsequent discussion do not constitute an offer to sell or solicitation of any offer to
subscribe for or purchase any securities or other financial instruments or any advice or recommendation in respect of such securities or other financial instruments.

Potential investors and shareholders (the “Potential Investors and Shareholders”) of Hutchison Telecommunications Hong Kong Holdings Limited (“the Company”) are reminded
that information contained in this Presentation and any subsequent discussion comprises extracts of operational data and financial information of the Company and its
subsidiaries (“the Group”) for the six months ended 30 June 2019. The information included in this Presentation and any subsequent discussion, which does not purport to be
comprehensive nor render any form of financial or other advice, has been provided by the Group for general information purposes only and certain information has not been
independently verified. No representations or warranties, expressed or implied, are made as to, and no reliance should be placed on, the fairness, accuracy, completeness or
correctness of the information, statements or opinions presented or contained in this Presentation and any subsequent discussion or any data which such information
generates. Potential Investors and Shareholders should refer to the 2019 Interim Report for the results of the Group which are published in accordance with the Rules
Governing the Listing of Securities on The Stock Exchange of Hong Kong Limited.

The performance data and the results of operations of the Group contained in this Presentation and any subsequent discussion are historical in nature, and past performance is
no guarantee of the future results of the Group. Any forward-looking statements and opinions contained in this Presentation and subsequent discussion are based on current
plans, beliefs, expectations, estimates and projections at the date the statements and opinion are made, and therefore involve risks and uncertainties. There can be no
assurance that any of the matters set out in such forward-looking statements is attainable, will actually occur or will be realised or are complete or accurate. Actual results may
differ materially from those stated, implied and/or reflected in such forward-looking statements and opinions. The Group, the Directors, officers, employees and agents of the
Group assume (a) no obligation to correct, update or supplement the forward-looking statements or opinions contained in this Presentation and any subsequent discussion;
and (b) no liability in the event that any of the forward-looking statements or opinions does not materialise or turn out to be incorrect.

Potential Investors and Shareholders should exercise caution when investing in or dealing in the securities of the Company.

                                                                                                                                                                               1
1H 2019 Financial Highlights
                    Post-IFRS 16 Basis                                                                Pre-IFRS 16 Basis
      Service                   Service                  Service                       Service                  Service                  Service
     Revenue                    EBITDA                    EBIT                        Revenue                   EBITDA                    EBIT
   HK$1,782m                 HK$778m                  HK$151m                      HK$1,782m                  HK$545m                  HK$142m
      -3%                      +34%                     -13%                          -3%                       -6%                      -18%

    Key cost                                            Interim                     Key cost
                                 Profit                                                                          Profit
     items                                             Dividend                      items
   HK$1,039m                 HK$188m                                               HK$1,272m                  HK$187m
                                                         2.93
      -20%                     -5%                                                     -2%                      -6%
                                                       HK cents

 Note: Following the adoption of IFRS 16 on 1 Jan 2019, the Group’s statutory results for 1H 2019 are on an IFRS 16 basis (“Post-IFRS 16 basis”), whereas
 the statutory results for the corresponding 1H 2018 are on an IAS 17 basis (“Pre-IFRS 16 basis”) as previously reported.

                                                                                                                                                            2
Financial
Review
Service revenue (HK$’m)
    1,843              1,782
             -3%

                                                    • Service revenue is challenging

   1H 2018            1H 2019

Roaming service revenue (HK$’m)
                        358
    349      +3%

                                                    • Introduction of innovative roaming
    19%                 20%                           products and packages for frequent
                                                      and leisure travellers
   1H 2018            1H 2019
                     roaming service revenue over                                          4
                     total service revenue
Customers                                    Postpaid
                                            1,499K             1,499K   0.5%    1,491K
                 Total
3,414K           3,276K           3,328K
          4.0%             1.6%

                                            1H 2018           2H 2018          1H 2019

                                                             Prepaid
                                            1,915K    7.2%    1,777K    3.4%   1,837K

1H 2018          2H 2018          1H 2019

                                            1H 2018           2H 2018          1H 2019

                                                                                         5
Churn and ARPU
          Postpaid Churn                                                      Blended postpaid gross ARPU(1) and
                                                                                        net ARPU(1)
1H 2018       2H 2018                   1H 2019
                                                                               Gross ARPU                           Net ARPU
                                                                              222      217       205              188       184       175

                                           1.1%
  1.2%
                           improved
               1.4%                                                         1H 2018   2H 2018   1H 2019          1H 2018   2H 2018   1H 2019

                      Note 1
                      Postpaid Gross ARPU = monthly average spending per postpaid user including handset contribution for bundled plan.
                      Postpaid Net ARPU = monthly average spending per postpaid user excluding handset contribution for bundled plan.
                                                                                                                                               6
4G Network data usage

                                          28%
                                                          • Growing data demand
                          23%
                                                          • Innovative data product and
          38%
                                                            package offerings
                                                          • Up 57% YoY
2H 2017         1H 2018         2H 2018         1H 2019

                                                                                          7
Key Costs (Pre-IFRS 16 basis) (HK$’m)          Capex (HK$’m)
                                         282

       1,300   -2%
                        1,272            15%

                                                                     154

                                                                      9%

     1H 2018            1H 2019         1H 2018                     1H 2019
                                                  capex over service revenue

                                                                               8
Net Cash (HK$’m)                                             • After the settlement of special
                                                                                          interim dividend and final
                                                                                          dividend as well as the
                                                                                          consideration of acquiring
                     4,009

                                                                                          non-controlling interests
                                                471               278           -

                                                                                        • Cater for future network
 9,555

                                                                              5,353       enhancement and 5G needs

Dec 2018   Special interim dividend and   Acquisition of NCI   Other items   Jun 2019
                                                                                        • Strong position for future
                  final dividend

                                                                                          operational needs

                                                                                                                            9
Business Review and Developments
3・OneWorld Strategy

                    OneWorld
                                 FinTech
    Travel

             Gadgets &         Insurance
             Accessories
Comprehensive Roaming Products
Frequently Getaway
Occasionally Roam-In-Command
Irregularly Day Pass
Prepaid Prepaid
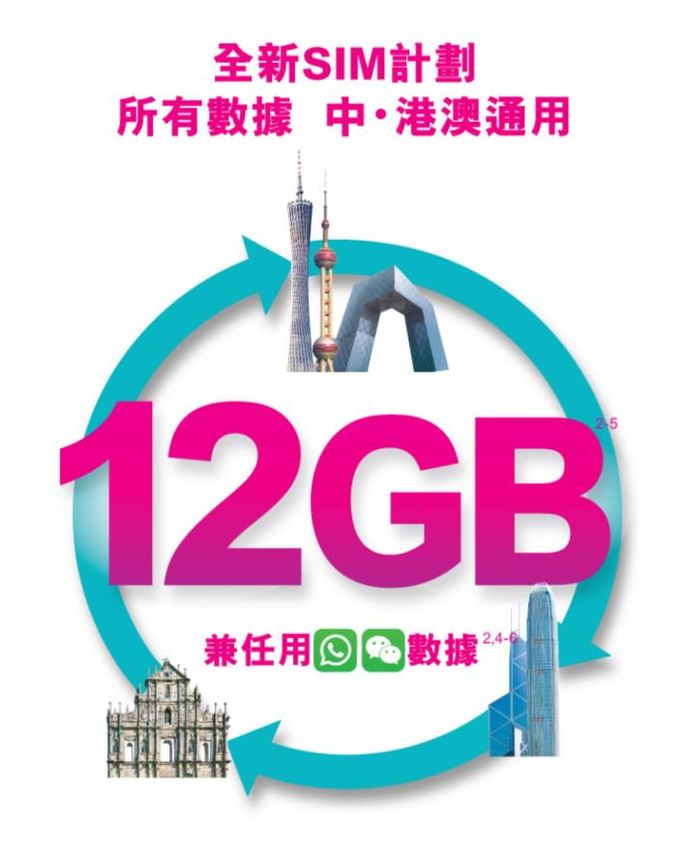
12Greater China Travel Proposition Postpaid plan Top-up Choice Prepaid Card
Getaway (Global Travel) Proposition
More varieties on Getaway services      Getaway Deluxe   Getaway Handset
                       Getaway all-in

Getaway Service

                                   2
Segmentation Strategy
High Tier
3Supreme
Mid Tier
+
Low Tier
AT3Technology - Digital Transformation
Fully leverage Digital Technologies to improve customer engagement and operational efficiency
Flexible Digital
Focus on the Experience Operating
Model
Commerce Platform
Digitalization
Cognitive &
Analytics
Emerging
Cloud Technologies Convergent
Billing
BIG
DATA
5G Mobile Big Data
New Focus Analytics
New Ways to Work
New Expertise
Omni-channel
Internet Of Social Customer
Things
Experience
Security
Real-time Online
Charging System
16Outlook
Grow New Revenue by Corporate Solutions
                                     Advanced SMS
e-Payment                                 Manager
 Solutions
                                             SMS
 Smart
Parking
                                           Smart
                                           Monitoring
       P
3Care - Proposition for Handset Plans Boost
Appendix
Appendix
Financial Summary
                                                                                                                                   Favourable/
                                                                                           1H 2019               1H 2018
                                                                                                                                 (unfavourble)
                                                                                       HK$ million           HK$ million               Change
Revenue                                                                                     2,515                 4,021                   -37%
- Net customer service revenue                                                              1,782                 1,843                    -3%
  l Local service revenue                                                                   1,424                 1,494                    -5%
  l Roaming service revenue                                                                    358                   349                   +3%
   - Data                                                                                      246                   211                 +17%
   - Non-data                                                                                  112                   138                  -19%
- Hardware revenue                                                                             733                2,178                   -66%
 l Bundled sales revenue                                                                       213                   339                  -37%
 l Standalone handset sales revenue                                                            520                1,839                   -72%

Net customer service margin                                                                    1,617                 1,681                    -4%
 Net customer service margin %                                                                   91%                   91%                      -

Standalone handset sales margin                                                                     9                    22                  -59%

CACs (before net of handset revenue)                                                            (308)                 (412)                 +25%
 Less: Bundled sales revenue                                                                      213                   339                 -37%
CACs                                                                                             (95)                  (73)                 -30%
                                     (Note)
Operating expenses and staff costs                                                              (779)               (1,065)                 +27%
 Operating expenses and staff costs as a % of                                                    48%                   63%          +15% points
 net customer service margin

                               Note: Operating expenses and staff costs (Pre-IFRS 16 basis) for the first six months of 2019 was HK$1,012 million,
                               representing 63% of net customer service margin.
Appendix
Financial Summary
Favourable/
1H 2019 1H 2018
(unfavourble)
HK$ million HK$ million Change
Post-IFRS 16 basis
EBITDA 787 601 +31%
Service EBITDA 778 579 +34%
Service EBITDA margin % 44% 31% +13% points
Depreciation and amortisation (603) (381) -58%
EBIT 160 195 -18%
Service EBIT 151 173 -13%
Pre-IFRS 16 basis
EBITDA 554 601 -8%
Service EBITDA 545 579 -6%
Service EBITDA margin % 31% 31% -
Depreciation and amortisation (379) (381) +1%
EBIT 151 195 -23%
Service EBIT 142 173 -18%
CAPEX (excluding spectrum licences) (154) (282) +45%
EBITDA (Post-IFRS 16 basis) less CAPEX 633 319 +98%
EBITDA (Pre-IFRS 16 basis) less CAPEX 400 319 +25%Thank you
You can also read