Investor presentation Responsible growth. Shared success - Givaudan
←
→
Page content transcription
If your browser does not render page correctly, please read the page content below

Investor presentation
Responsible growth. Shared success.

Givaudan products drive millions of consumer
decisions every day!

Key drivers of consumer repurchase decisions
Fragrance and Flavour industry
                        Fine Fragrances                                                 Flavours

                         Scent                  78%                                     Smell and taste     45%

                         4-6%                                                           0.5%
                         of customers COGS                                              of customers COGS

                                                                                        Brand image         30%

                                                                                        Price               15%
                         Overall experience       8%

                         Brand                    5%
                          Fragrance image         3%
                                                                                        Packaging           10%
                         Other                    6%

Source: AC Nielsen (European) study

                                              Investor Presentation July-October 2016                             3
The industry

The Fragrance and Flavour industry
End consumer markets

Our customers
Multi-national | Regional | Local | Food service | Private label

The cost of flavours and fragrances to our customers is typically
between 0.5 – 5% of their product cost

      Food                 Beverages            Fine Fragrances                        Household   Personal care

                                             Investor Presentation July-October 2016                           5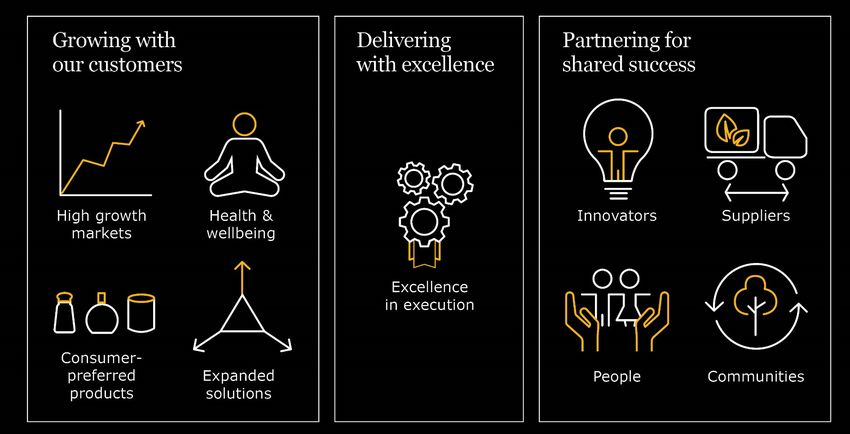
Fragrance and Flavour industry
Total market is CHF 18–19 billion

              Others                                                   Givaudan

                                                                       Firmenich

             Symrise                                                   IFF

> Givaudan market share above 25%

                             Investor Presentation July-October 2016               6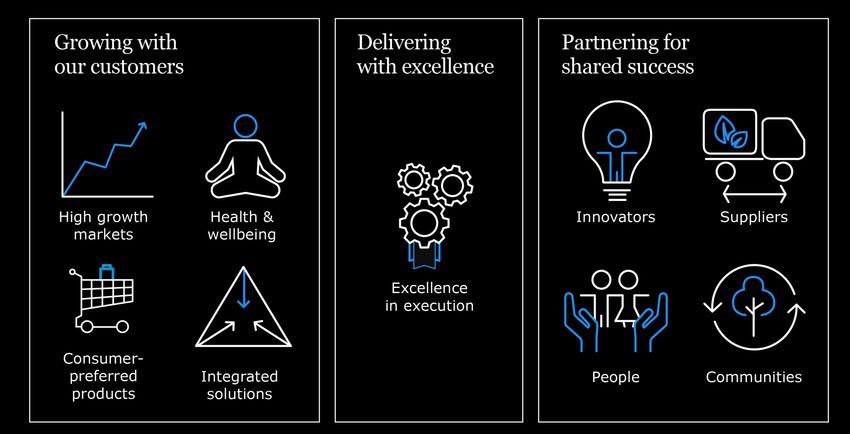
“How to win business” model
 in a competitive bidding situation

 Product life cycles are getting                                       Our submissions draw on leading
 shorter – Our customers issue over 35,000                             global market knowledge
 briefings per year:                                                   and capabilities

 • To a small number of Fragrance and Flavour                          • Creation capability and our fragrance and flavour
   houses                                                                ingredients palette and technology

 • The brief defines the olfactive and                                 • Evaluation and application process
   organoleptic requirements and
   cost-in-use target                                                  • Consumer insight and local market understanding

 • As well as product and brand related                                • Regulatory compliance and advice
   information and requirements

> Revenue stream over the life cycle of the customers’ product

                                         Investor Presentation July-October 2016                                             7
Where are we now?
2015 Full Year Results
Delivering on the mid-term targets set in 2010

    Sales         Gross                   EBITDA                      Net income     Free cash
  CHF 4.4        margin                  CHF 1,070                      CHF 635        flow
   billion,     of 46.2%,                 million                       million,     CHF 720
 up 2.7% like   up from                  margin of                      12.7% up      million,
   for like      46.0%                     24.3%                      year on year   16.4% of
                                                                                       sales

                            Investor Presentation July-October 2016                              9
2016 Half Year Results
Financial highlights

• Sales of CHF 2.3 billion, up 6.2% on a like-for-like* basis

• Project pipeline and win rates sustained at a high level

• EBITDA of CHF 638 million in 2016

• EBITDA margin improved to 27.3% from 25.9% in 2015

• Net income of CHF 368 million, up 7.6% year on year

• Free cash flow of 7.4% of sales, compared to 11.4% in 2015

* Like-for-like (LFL) excludes the impact of currency, acquisitions and disposals

    Our 2016 six month results are a convincing demonstration of the continued
         value we bring to our customers, across all regions and segments

                                                                                Investor Presentation July-October 2016   10
2016 Half Year Results
Sales performance: strong performance
In million CHF 2,334
1,202
1,132
Group Fragrances Flavours
% 2016 growth on LFL* basis 6.2% 9.7% 3.0%
% 2016 growth in CHF 6.9% 10.7% 3.5%
* LFL (like-for-like) excludes the impact of currency, acquisitions and disposals
Investor Presentation July-October 2016 112016 Half Year Results
Sales evolution by market: Underlying presence in high growth markets
continues to increase, offset by currency weakness
In million CHF
1,267
1,186
1,067
998
HY2015 HY2016 HY2015 HY2016
Mature High Growth
% of total sales 54% 54% 46% 46%
% 2016 growth on LFL* basis 2.3% 10.7%
* LFL (like-for-like) excludes the impact of currency, acquisitions and disposals
Investor Presentation July-October 2016 122016 Half Year Results
Sales evolution by region
In million CHF 821
786
669
604
548
508
286 296
HY HY HY HY HY HY HY HY
2015 2016 2015 2016 2015 2016 2015 2016
LATAM APAC NA EAME
% 2016 growth on LFL* basis 18.1% 8.7% 2.9% 2.0%
* LFL (like-for-like) excludes the impact of currency, acquisitions and disposals
Investor Presentation July-October 2016 13The value proposition for investors
Unrivalled capabilities

Depth and range of             Global reach                      Unmatched resources       Broadest product offering
customer relationships                                           to service our clients

   97                         59                                            35            Over   60,000
  Locations                 Creation and                             Production sites            Products sold per year
  worldwide              application centres

                                         Investor Presentation July-October 2016                                          15
Well balanced business with natural hedges
Geography
• 46% of sales in developing markets
• 54% in mature markets
Segments Customers and products
Balanced portfolio in most fragrance Diversified client base ranging
and flavour applications from multinationals to regional
clients, from premium brands to
private and white label
Currency
• Creation and production
centres close to customers
• Sales and expenses balanced across
major currencies protecting margins
Investor Presentation July-October 2016 162015 Full Year Results
Dividend per share: Increasing 8.0% YoY
Free cash flow of CHF 5.9 billion generated over the past 16 years
CHF 2,612 million of cash flow returned to shareholders as dividends
47 50 54
and CHF 504 million (net) through share buy-backs
36
20 20.6 21.5 22
18.8 19.5
16.3 17.6
15.4 720
Raw mats 662
8.1 604
7 SAP - Quest
6.5 549
512
FIS 437
390
340
273 295 289
262
203
157 145
117
2000 2001 2002 2003 2004 2005 2006 2007 2008 2009 2010 2011 2012 2013 2014 2015
Free Cash Flow Dividend
Investor Presentation July-October 2016 172020 strategy Responsible growth. Shared success.
Responsible growth
Shared success

                     Investor Presentation
                         Investor PresentationApril – July
                                               February    20162016
                                                         – April      19
                                                                       19
Responsible growth
Shared success
4–5% 12–17% Partner
Organic sales
growth
Free cash flow as
% of sales
of choice
Creating additional value through acquisitions
Investor Presentation April – July 2016 20Disclaimer
No warranty and no liability: While Givaudan is making great efforts to include
accurate and up-to-date information, we make no representations or warranties,
expressed or implied, as to the accuracy or completeness of the information
provided on this handout and disclaim any liability for the use of it.
No offer and no solicitation: The information provided on this handout does not
constitute an offer of or solicitation for the purchase or disposal, trading or any
transaction in any Givaudan securities. Investors must not rely on this information
for investment decisions.
Forward-looking information: This handout may contain forward-looking
information. Such information is subject to a variety of significant uncertainties,
including scientific, business, economic and financial factors, and therefore actual
results may differ significantly from those presented.
Copyright © 2016 Givaudan SA. All rights reserved.
Investor Presentation July-October 2016 21You can also read