HSE COVID-19 Test and Trace Briefing - 15th of July, 2021

Page created by Bruce Bates
 
CONTINUE READING
HSE COVID-19 Test and Trace Briefing - 15th of July, 2021
HSE COVID-19 Te s t a n d Tr a c e B r i e f i n g
15th of July, 2021
HSE COVID-19 Test and Trace Briefing - 15th of July, 2021
Testing Volumes and Turnaround Times

1
             2     Test and Trace Trends

                       3     Testing Programmes

                              4       Education and Childcare

                                  5     Recruitment
HSE COVID-19 Test and Trace Briefing - 15th of July, 2021
Te s t a n d Tr a c e H e a d l i n e s

 1.4 days                                    2.2 days                                     c. 130,354 c.126,740                                      c.8,648
Community - median end to
end TAT for a not detected                  Community - median end to                          Total number of swabs   Total number of laboratory   Calls made to close
          result                             end for a detected result                            taken last week            tests last week        contacts last week

 Note: The above TaT and volume metrics refer to the seven day date range from 7th – 13th of July.
HSE COVID-19 Test and Trace Briefing - 15th of July, 2021
K e y m e s s a g e s f r o m Te s t i n g a n d Tr a c i n g

1. Testing demand and cases are rising quickly so Testing and Tracing service is now in Surge.
2. We re-iterate our core message to take our tracers calls and the importance of restricting your movements if you are
    deemed a close contact. This really matters in reducing the onward spread of the disease.
3. The positivity rate in the community testing over the last seven days was 5.3% - and rising. On some days individual
    sites have up to 15% positivity of swabs taken
4. Close contacts are c.4 per person. Please share all your contacts with us, we know these will be higher with less social
    restrictions in place now.
5. Not all contacts are sent for testing, about 15% are fully vaccinated. This demonstrates the young age profile of close
    contacts
6. We note a strong rise in travel related cases from holiday destinations, Spain, Portugal, UK.
7. As we look forward in Testing and Tracing, there is a projected increase demand for the service. In order to address
    this demand we are looking at surge capacity across referrals and swabbing, laboratory testing and contact tracing.
8. We have increased PCR capacity to 30,000 per day. In addition we will deploy lateral flow tests further in the coming
    weeks (antigen)
9. Options that we can leverage for surge capacity include expanding our testing centre hours, utilise additional facilities
    and resources, target high demand areas using our NAS pop up teams and leverage antigen testing for outbreaks and
    close contact testing if needed.
10. We will leverage off shore labs as needed and in tracing we will adapt contact tracing call time length, number of calls
    and increase the use of digital channels.
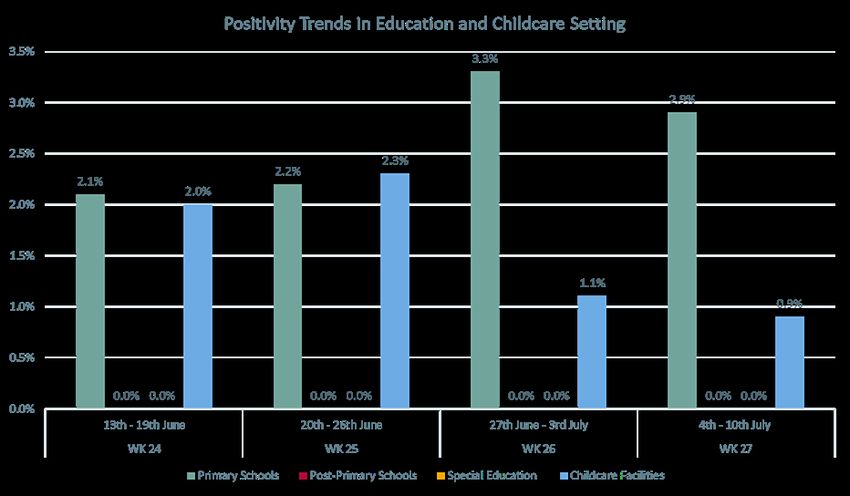
HSE COVID-19 Test and Trace Briefing - 15th of July, 2021
Surge Planning
There is a projected demand for Test and Tracing over the next 3 months as a result of the Delta Variant. The
Test and Trace system has a number of options to increase capacity and control demand over across the end
to end Test and Trace Process. Some of these options include

         Referrals and Swabbing                          Testing                             Contact Tracing
   •   We have expanded our                   • We have extended our PCR              • We have over 900 people fully
       swabbing capacity to 30,000              testing capacity to 30,000              dedicated to contact tracing
       per day across Community and             per day                                 activity, in addition to all of
       Acute hospitals                        • We will leverage additional             our public health
   •   We have expanded test centre             available onshore and                   departments.
       opening hours.                           offshore PCR capacity                 • It is possible to carry out a
   •   We have utilised extra swabbing        • We will further deploy the              shorter positive patient
       facilities and resources.                use of rapid testing                    assessment, reducing call
   •   We will target high demand               methods, including lateral              times and increasing overall
       areas with NAS pop up teams              flow tests                              capacity.
   •   We will leverage lateral flow                                                  • We will manage high numbers
       test as we exceed swabbing                                                       of contacts with digital
       capacity                                                                         methods
1. Testing Volumes and Turnaround Times
Te s t a n d Tr a c e Vo l u m e s

 The following metrics and turnaround times refer to the seven days from 7th – 13th July.

 Total Community Referrals

 • There were c. 96,676 community referrals over the seven day period.
 • This figure includes 23,522 walk-in referrals, 8,412 International travel referrals and 23,402 referrals from the self-referral portal, the remainder relate to GP and
     close contact referrals.
 • International travel referrals have increased by 31.5% in comparison to the same timeframe last week.
 • Overall, this weekly total has increased by 4.3% in comparison to the same time-frame last week (30th June – 6th July; c. 92,692 total referrals).

 Total Swabs Completed
 • During this time period, there were c. 130,354 swabs were completed.

 Lab Tests and Detected Rate
 • During this time period, there was c.126,740 lab tests reported in community, private and acute settings over the past week.
 • The average detected rate over the past week is approximately 5.3%.

 Contact Tracing
 •   Over the last 7 days, of those tested with close contacts, the average number close contacts was 3.9 per person.
 •   From 7th– 13th July, a total of 3,812 calls were completed to inform individuals of their detected COVID-19 test result.
 •   From 7th– 13th July, contact tracing was completed for c. 3,518 individuals that had a confirmed COVID-19 case
 •   In addition, c. 8,648 calls were made to close contacts.
Te s t a n d Tr a c e Tu r n a r o u n d T i m e s

 The following metrics and turnaround times refer to the 7 day date range from 7th – 13th July.

 Turnaround Times

 • The combined median time from swab to lab result in community and acute settings was 24 hours.

 • All contact tracing calls are completed within a mean of 11.3 hours and a median of 8.7 hours.

 • In the last seven days, in the community, we have delivered a median end to end turnaround time of 1.4 day for not detected
   results.

 • In the last seven days, in the community, we have delivered a median end to end turnaround time of 2.2 days for detected
   results.
2. Testing and Trace Trends
Total Community Referrals

•   From the 7th – 13th July, there were a total of c.                                         Total Community Referrals
                                                                                                     Week on Week
    96,676 Community Referrals (including walk-ins,
                                                         120.000
    international travel and self referrals)
                                                         100.000                                                                                            96.676
                                                                                                                                        92.692

•   This weekly total has increased by 4.3% in                                                                     77.338
                                                          80.000
    comparison to the same time-period last week
    (30th June – 6th July; c. 92,692 total referrals)     60.000
                                                                         60.559               59.719

                                                          40.000
•   The graph to the right shows a weekly
    breakdown of total community referrals over           20.000
    the past 5 weeks.
                                                              -
                                                                   09/06 - 15/06/2021   16/06 - 23/06/2021   23/06 - 29/06/2021   30/06 - 06/07/2021   07/07 - 13/07/2021
Walk In Referrals and Self Referrals

•   In the last week, the number of Walk in
    referrals was 23,522, this is a 6.9% increase
    on the number of walk in referrals over the
    same time period the previous week.
•   In the last week, the number of Self referrals
    was 23,402, this is a 11% increase on the
    number of self referrals over the same time
    period the previous week.
•   The self-referral online portal has been updated
    to allow u-16s to book a test through this
    channel.
•   Current operational procedures for those u-16
    will apply at testing centres upon arrival.
International Travel Referrals

•   In the last week, there has been a total of 8,412
    referrals from International Travel.
•   This type of referral has increased by 31.5% over
    when compared to the previous 7 day time period.
•   We continue to monitor this metric and the volumes
    of referrals that are associated with International
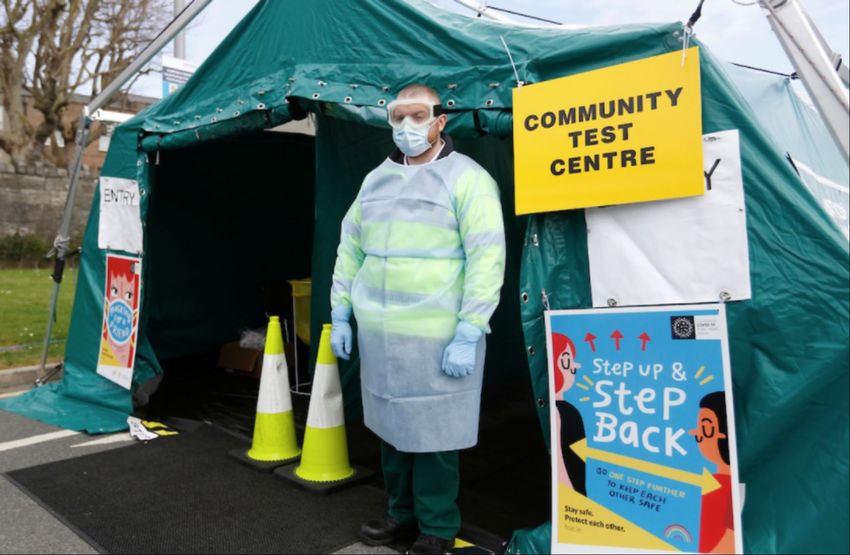
    Travel.
Pop-up - Test Centres

• Our pop up test centres continue to be
  deployed across areas in order to meet
  testing demand.
• As of the 14th July, the following pop-ups are
  operational;
   •   Dublin (Blanchardstown & Tallaght Stadium)
   •   Donegal
   •   Wexford
   •   Athlone

   Testing at Tallaght Stadium is by appointment only.
   The Athlone centre is open 3 days a week.
C o m m u n i t y P o s i t i v i t y Tr e n d

                                     The Last 7 days

                                                              The Last 1 day
           The last 14 days

                              5.0%                     5.3%                    6.5%
Close Contacts Trend

             Over the last 7 days, of those tested with at least                               Mean Close Contacts: Week on Week Average
3.9          one close contact, the mean number of close                          4,5
                                                                                                                                                    4,0
             contacts per person was 3.9                                           4
                                                                                             3,9
                                                                                                                3,7               3,7
                                                                                                                                                                       3,9

                                                                                  3,5

                                                                                   3

                                                                                  2,5

                                                                                   2

                                                                                  1,5

                                                                                   1

                                                                                  0,5

                                                                                   0
                                                                                        9th - 15th June   16th - 22nd June 23rd - 29th June 30th June- 6th July   7th- 13th July

The source of the close contact trend graph is the IIS Test and Trace Dashboard
3. Testing Programmes
Serial Testing in Nursing Homes

.

                                                         Swabs completed and detection rate per cycle in Nursing Homes
    In Cycle 13 (Commenced 21st June);       120.000                                                        113.449                                                2,50%

                                                       100.472
                                             100.000                                                        1,98%
                                                                                                                                                                   2,00%

           277 facilities have been tested    80.000
                                                                                                                      79.505

                                                                                   65.170 66.635 66.847                        66.329                              1,50%
                                                                          61.427                                                        61.560
                                                                 57.456                             1,19%                                        57.076
                                              60.000

           9,627 tests have been completed                                                                                                                         1,00%
                                              40.000                                                                                                      34.306
                                                                                   0,53%
                                                                          0,42%                                       0,45%
                                                                                                                                                                   0,50%
           8 detected cases identified        20.000
                                                                 0,19%
                                                                                           0,33%
                                                                                                                               0,18%                      9.627
           (0.08% detected rate)                       0,13%                                                                            0,09% 0,09% 0,13% 0,08%

                                                  0                                                                                                                0,00%

                                                                                                   Swabs         Detection Rate
Serial Testing in Mental Health Facilities

                                                Swabs completed and detection rate per cycle in Mental Health
                                                                        Facilities
In Cycle 6 (Commenced 21st June);
                                       2.500                                                                                        0,60%
                                                    0,56%
                                               2.139             0,54%
                                                                                                                                    0,50%
                                       2.000
       5 facilities have been tested                                     1.762
                                                                                                                                    0,40%
                                                            1.486
                                       1.500
                                                                                        1.280
                                                                                                                                    0,30%
       390 tests have been completed   1.000
                                                                                                                                    0,20%
                                                                                                        663
                                                                              0,17%
                                                                                                              0,15%
                                        500                                                                            390
       0 detected cases identified                                                           0,08%
                                                                                                                                    0,10%

       (0.00% detected rate)              0                                                                                 0,00%   0,00%
                                               Cycle 1      Cycle 2      Cycle 3        Cycle 4        Cycle 5        Cycle 6

                                                                          Swabs       Detection Rate
Serial Testing in Food Production Facilities

Cycle 11 of serial testing for Food Production Facilities commenced on 28th June.

                                                                            Swabs completed and detection rate per cycle in Food
                                                                                           Production Facilities
In Cycle 11 (Commenced 28th June);
                                                          35.000                                                                                                      2,50%

                                                                   30.262
                                                          30.000                                       2,05%
                                                                                                                                                                      2,00%
         44 facilities have been tested                   25.000
                                                                                                                25.316
                                                                                                                          24.564

                                                                                                       21.511                      22.109
                                                                                              19.750                                                                  1,50%
                                                          20.000                     18.781                                                 18.231
                                                                            17.744
                                                                                                                                                     16.598

         8,575 tests have been completed                  15.000
                                                                                              0,86%                                                                   1,00%
                                                                                     0,69%                      0,66%
                                                          10.000            0,56%                                                                             8.575
                                                                                                                          0,53%
                                                                   0,42%                                                           0,39%                              0,50%
         9 detected cases identified                       5.000
                                                                                                                                            0,16%    0,20%
                                                                                                                                                              0,11%
         (0.11% detected rate)                                0                                                                                                       0,00%
                                                                   Cycle 1 Cycle 2 Cycle 3 Cycle 4 Cycle 5 Cycle 6 Cycle 7 Cycle 8 Cycle 9 Cycle 10 Cycle 11

                                                                                                       Swabs            Detection Rate
Mandatory Hotel Quarantine Testing

•   All passengers arriving into Ireland from designated states
    are required to pre-book accommodation in a designated
    quarantine facility.                                             Total Hotel Quarantine Swabs as of July 13th:
•   Testing resources have been made available in Quarantine
                                                                                     Hotel Staff
    Facilities since 26th March 2021, and are available on a daily
    basis to accommodate the testing of all new arrivals.                       5,067 swabs complete

•   The scope of testing includes:                                              Quarantine Residents
     – Testing of passengers arriving into Ireland from                         13,011 swabs complete
         Category 2 Countries on Day 0 and Day 10
     – Testing of passengers arriving into Ireland from                        Detected Cases To Date
         Category 1 Countries that have not been able to                                392
         produce a negative result
     – Testing of Quarantine Hotel Staff on a weekly basis
4. Education and Childcare
Positivity Trend in Education and Childcare Settings

From the 4th – 10th July;

•   1,669 tests were completed in 97 Primary Schools
    resulting in a 2.9% positivity rate.

•   0 tests were completed in 0 Post-primary Schools
    resulting in a 0.0% positivity rate.

•   32 tests were completed in 5 Special Education
    settings resulting in a 0.0% positivity rate.

•   643 tests were completed in 52 Childcare Facilities
    resulting in a 0.9% positivity rate.
5. Recruitment
Recruitment as of 12th July

                              860
                         Community
                         Swabbers
                     Recruited and Onboarded

                            923
                                                       SINGLE &
                 Staff supporting                     DEDICATED
                 C o n t a c t Tr a c i n g           WORKFORCE

              Of these 923 staff;
              883 of these staff have been hired
              and retained as part of
              dedicated workforce to support
              the contact tracing function

              The remaining 40 staff are redeployed
              from the HSE and other Public Service
              Roles
Conclusion

1    Over the past seven days, the positivity rate in the community is 5.3%.

     Our median end to end turnaround time is 2.2 days for detected cases and 1.4 days for
2    not detected cases.

     Total Community Referral Volumes have increased by 4.3% in comparison to the same
3
     time-period last week.
You can also read