Analisi della domanda per la valutazione della fattibilità economica di servizi ferroviari di Alta Velocità in regime di concorrenza - SIET
←
→
Page content transcription
If your browser does not render page correctly, please read the page content below

Special track 2 (Plenary Session)
   "L’ingegneria dei sistemi e i nuovi mercati dei trasporti"

 Analisi della domanda per la valutazione della
fattibilità economica di servizi ferroviari di Alta
       Velocità in regime di concorrenza

Pierluigi COPPOLA – “Tor Vergata” University of Rome

                      SIET annual conference
                   Venezia, 20th September 2013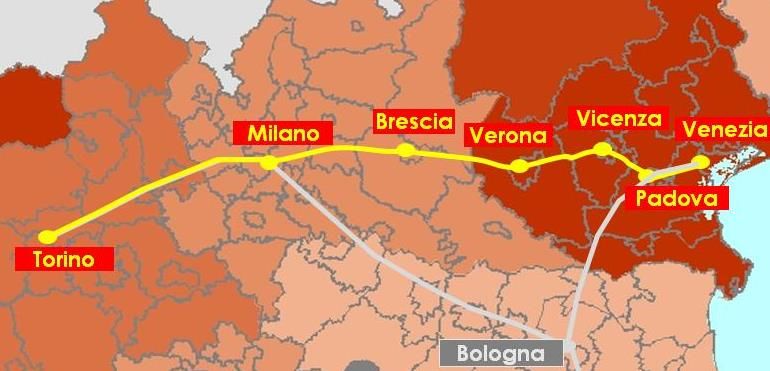
EU STRATEGIES FOR TRANSPORT BY RAIL

• EU Directive 440/1991/CEE       Safety and
                                    Inter-
• First Railway package (2001)    operability

• Second Railway package (2004)

                                  Opening the
• Third Railway package (2007)
                                   market to
                                  competition
• Fourth Railway package (2013
  proposal)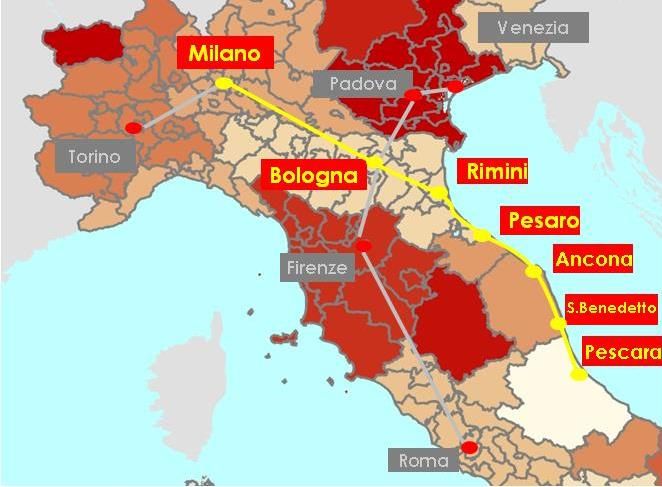
EU Directives for Transport by Rail
                                                                            Vertical separation in
EU Directive 440/1991/CEE                                                   the European Railway
•   Separation of Infrastructure Manager (IM) and Railway                   sector (pioneered by
    Undertaking’s (RU’s)                                                    Sweden in 1988; in
                                                                            Italy : D.Lgs 149/99)
First Railway package (2001)
•   Opening of the market for international freight transport by rail
    (as of 2008)
•   License and Safety Certificates to Railways Undertakings                Incoming of private
•   Regulation of Rail infrastructures capacity e fares                     Railways Undertaking,
Second Railway package (2004)                                               mainly in freight
•   Safety and Interoperability (towards ERMTS)
                                                                            transport, but in some
•   Opening of the market for the whole freight transport by rail (as
    of 2006)                                                                cases also in passenger
•   European Railway Agency (ERA)                                           transport*
Third Railway package (2007)
•   Opening of the market for international passenger transport by
    rail (as of 2010)
                                                                        *Sweden, UK, Germany
Fourth Railway package (2013 proposal)                                  and Italy (D.Lgs 183/2003)
•   Opening of the market for domestic passenger transport by rail      unilaterally opened their
•   Safety and Interoperability (simplification and harmonization)      passenger domestic market
Effect of EU Directives for Passenger HSR Transport
Railways Undertaking (RU)
Examples of Long Distance RU’s
ownerships
Entirely Public SNCF, DB, Trenitalia , …
Public with minor participation
TGV Lyra (France-Switzerland)
of private
Public-Public Joint Venture Thalys
Public-Private Joint Venture Eurostar
• NTV (Italy, April 2012),
Entirely Private • LOCOMORE (Germany, July
2012)HSR demand analysis in a competing market • Effects within the HSR market (competition among RU) – Service quality – Fares • Impacts on different market (modal competition) – New services – Modal shares • Wider Economic Effects – Economic Growth – Tourism – Relocation of workplace and residents – …
HSR DEMAND FORECASTING
• Taxonomy of demand on HSR services

                               e.g. shift from air/auto to
            from other modes
 DIVERTED                      HSR
 DEMAND from other rail        e.g. shift from Intercity to   endogenous
            services           HSR                                factors
                               e.g. increase of trip
            direct             frequency, change of trip
                               destination
 INDUCED
 DEMAND                        e.g. increase of mobility
            indirect           due to change in life-
                               styles and land use
                                                               exogenous
                                                                  factors
 DEMAND                        e.g. increase of mobility
 GROWTH                        due to economic growth
THE METHODOLOGY FOR HSR DEMAND FORECASTING:
Elastic demand multimodal scheduled-based assignment model
Multimodal
Future supply Supply Models LOS
scenarios (diachronic attributes Induced
networks) demand model
Desired Trend
Departure Time OD matrices Schedule-based
(DDT) demand (all modes) mode choice
model by time slice model Future OD
(by purpose matrices
and user class) (HSR)
Demand
growth model
Path Flows on
the HSR
network
Current OD
matrices
(corrected by Schedule-based
traffic counts) Network loading
model
Flows on
individual
trainsThe schedule-based mode choice model Nested logit models with a nesting structure to capture higher degrees of substitutions among specific subsets of modal alternatives, particularly the HSR alternatives provided on the same route by different operators, NTV vs. HSR- Trenitalia
SOME REFERENCES
•   Ben-Akiva M., Cascetta E., Coppola P., Papola A., and Velardi V. (2010) “High speed
    rail demand forecasting in a competitive market: the Italian case study” Proceedings
    of the World Conference of Transportation Research (WCTR), Lisbon (Portugal)

•   Cascetta E., and Coppola P. (2011) “High Speed Rail Demand: Empirical and
    Modeling Evidences from Italy” Proceedings of the European Transport Conference,
    Glasgow (UK).

•   Cascetta E., and Coppola P. (2012) “An elastic demand schedule-based multimodal
    assignment model for the simulation of high speed rail (HSR) systems” EURO
    Journal of Transportation and Logistics, Springer Vol.1 pp- 3-28

•   Cascetta E., Coppola P., and Velardi V. (2013) “High Speed Rail demand: before and
    after evidences from the Italian market” disP – The Planning review, ETH-Zurich
    Vol. 193·(49.2) pp. 51-59

•   Cascetta E., Coppola P. (2013) “High Speed Rail (HSR) induced demand models”
    Proceedings of the 16th EURO Working Group on Transportation, Porto (Portugal)
APPLICATIONS
Design of strategic policies
Services and Rolling Stock
Fares
Design of operational policies
TimetableAPPLICATIONS
Strategic policies tested: service and rolling stock
Alternative scenario:
No services between Napoli and Salerno + new services on the “Torino-Milano-Venezia”
Venezia
Milano
Padova
Torino
Bologna
Firenze
+ new services on the Adriatic corridor
Roma
Napoli
SalernoAPPLICATIONS
Operational policies tested: fares
Fares “war” among the two HSR competitors
HSR Service supply
Ref. Scenario Alternative scenario 1
(invariant)
SeatKm/day paxKm paxKm
TrainKm/day 1st class 2nd class % 1st class 2nd class delta% %
(mil.) (mil.) (mil.)
Trenitalia 78.162 43,9 Base Base 7.128 66,6% -20% -20% 8.066 13,2% 71,5%
NTV 35.238 15,9 base base-8% 3.569 33,4% = = 3.209 -10,1% 28,5%
10.697 100,0% 11.275 5,4% 100,0%
HSR Service supply
Ref. Scenario Alternative scenario 2
(invariant)
SeatKm/day paxKm paxKm
TrainKm/day 1st class 2nd class % 1st class 2nd class delta% %
(mil.) (mil.) (mil.)
Trenitalia 78.162 43,9 Base base 7.128 66,6% -20% -20% 7.715 8,2% 67,2%
NTV 35.238 15,9 base base-8% 3.569 33,4% -20% -26,6% 3761 5,4% 32,8%
10.697 100,0% 11.476 7,3% 100,0%APPLICATIONS Strategic policies tested: fares MODEL ELASTICITIES direct elasticity of total HSR demand with respect to HSR fares : -0,37 cross elasticity of individual HSR operator w.r.t. fares of competing HSR operator: +0,74 OBSERVED ELASTICITIES Direct elasticity of total travel demand w.r.t. fares (in 2012) included in a range between -0,30 and -0,40
APPLICATIONS
Operational policies tested: timetable
Example of timetable setting to increase flows

                                                                dep. arr.      1st     2nd    total
                          dep. arr.      1st     2nd    total
    orig        dest                    class   class           Time Time     class   class   flow
                          Time Time                     flow
ROMA        ROMA                                                07.06 07.16    12      36      48
OSTIENSE    TIBURTINA
                          06.06 06.16    4       12      16
ROMA        MILANO                                              07.20 10.05    90     168     278
TIBURTINA   ROGOREDO
                          06.20 09.05    56      69     125
MIANO       MILANO
ROGOREDO    P.GARIBALDI
                          09.07 09.17    45      66     111     10.07 10.17    75     150     225

                          dep. arr.      1st     2nd    total   dep. arr.      1st     2nd    total
    orig        dest
                          Time Time     class   class   flow    Time Time     class   class   flow
MILANO      MILANO
P.GARIBALDI ROGOREDO
                          06.45 06.55    37      60      97     07.15 07.25    63     131     194
MILANO      ROMA
ROGOREDO    TIBURTINA
                          06.57 09.42    52      80     132
                                                                07.27 10.12    73     153     226
ROMA        ROMA
TIBURTINA   OSTIENSE
                          09.46 09.56    5       14      19
                                                                10.16 10.26    16      50      66
APPLICATIONS
Operational policies tested: timetable Milano Venezia
Example of timetable setting to balance train loads
dep. arr. total dep. arr. total Bologna
orig dest orig dest
Time Time flow Time Time flow
MILANO MILANO VENEZIA Firenze
07.00 07.10 201 PADOVA 06.54 07.20 67
P.GARIBALDI ROGOREDO S. LUCIA
MILANO BOLOGNA BOLOGNA
07.12 08.07 235 PADOVA 07.22 08.17 148
ROGOREDO Centrale C.LE
Roma
BOLOGNA FIRENZE BOLOGNA ROMA
08.10 08.47 238 08.20 10.12 195
Centrale S.M.N. Centrale TIBURTINA
Direct service
FIRENZE ROMA
S.M.N. TIBURTINA
08.57 10.27 246 from Bologna
ROMA ROMA ROMA ROMA
to Roma
10.31 10.41 95 10.16 10.26 122
TIBURTINA OSTIENSE TIBURTINA OSTIENSE
Train OD matrices BOLOGNA ROMA ROMA
PADOVA
BOLOGNA FIRENZE ROMA ROMA Centrale TIBURTINA OSTIENSE
Centrale S.M.N. TIBURTINA OSTIENSE VENEZIA
MILANO S.LUCIA
17 23 11 16
P.GARIBALDI
77 67 35 23
MILANO PADOVA 63 13 22
ROGOREDO
13 11 6 4
BOLOGNA
BOLOGNA Centrale
49 84
Centrale
93 - -
FI S.M.N. 111 68 No pax from Bologna to Roma boarding
on this train at Bologna CentraleCONCLUSIONS
Competition within the HSR market is an additional
element of complexity in demand analysis
• forecasting impacts on services supply (e.g. fares)
• impacts on demand among operators within-mode (e.g. market
shares)
Surveys and mathematical models are essential for
strategic planning, for monitoring the HSR market and
for designing services
Operations Strategic Planning
• Schedule-based models • Schedule-based vs.
frequency- based models
• Induced demand modelsYou can also read