Is The Recession Already Over? The Outlook for the U.S. Economy - Kevin L. Kliesen Business Economist and Research Officer Federal Reserve Bank of ...
←
→
Page content transcription
If your browser does not render page correctly, please read the page content below
Is The Recession Already
Over? The Outlook for the
U.S. Economy
Kevin L. Kliesen
Business Economist and Research Officer
Federal Reserve Bank of St. Louis

Little Rock Regional Economic Briefing Webinar
November 12, 2020

                                                 1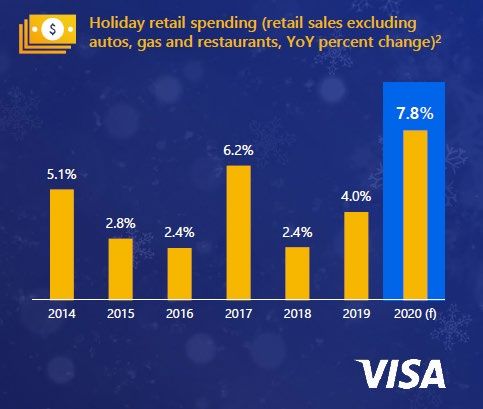
Disclaimer
The views I will express today are my
own and do not necessarily reflect the
positions of the Federal Reserve Bank
of St. Louis or the Federal Reserve
System.

                                         2
FRED ECONOMIC DASHBOARDS:
https://research.stlouisfed.org/dashboard/49765
https://research.stlouisfed.org/dashboard/49752
https://www.stlouisfed.org/publications/regional-
economist/data/economy-at-a-glance
3The Big Picture
• You can learn a lot by asking a simple question:
“What’s going on here?”
• Well, the economy has been on the mother of all
rollercoaster rides in 2020!
• We’re now transitioning from recession to
recovery—and (hopefully) less volatility.
• The pandemic produced temporarily low inflation
rates and lower interest rates. But for how long?
• Above-trend growth in 2021 is my baseline
forecast. The vaccine news is promising—a
rising tide that would lift all boats.
4A Fundamentally Different Type of
Recession (and Recovery?)
5How to Think About the Recovery
• The economy tends to grow at a rate consistent with
its fundamentals.
• Broadly, the economy’s fundamentals are: (1) how
many people are working; (2) business capital
spending; (3) the discovery of new ideas.
• Currently, the economy is operating well below
potential chiefly because the pandemic is a massive
shock that affects (1) and (2).
• Thus, fiscal and monetary support is designed to
boost growth in the demand for goods and services,
thereby increasing employment (1) and investment
by firms (2).
6Pandemic-Related Legislation
Boosted Real After-Tax Income
7The Economic Narrative—Part 1
• The U.S. and global economies are now climbing
out of a deep hole (rising output & employment).
• Business recovery dynamics are occurring: near-
term cyclical strength boosted by aggressive
policy actions and a natural tendency to return to
growth determined by fundamentals.
• But there are key unknowns: Will the spike in
COVID infection rates trigger renewed caution
by policymakers and individuals?
• Another round of widespread “lockdowns” would
be extraordinarily damaging.
8A Partial Recovery in Nonfarm
Payroll Employment
Monthly Changes
(millions):
Mar-Apr: -22.2
May: + 2.7
June: + 4.8
July: + 1.8
August: + 1.5
Sept.: + 0.67
Oct.: + 0.64
Jun-Sep: +12.1
9The Goods-Producing Economy
is Gathering Steam
U.S. Railroad Traffic, By Type
Number of Units, NSA, 12-Week Moving Averages
320,000
Intermodal Carloads
300,000
280,000
260,000
240,000
220,000
200,000
180,000
Jan.2013 Apr.2014 Jul.2015 Oct.2016 Jan.2018 Apr.2019 Jul.2020
SOURCE: Association of American Railroads and Haver Analytics Data through weekending Oct. 31, 2020.
SOURCE: VISA, October 2020
10The Residential Housing Market:
Strong Demand, Lean Inventories
Total (New and Existing) Home Sales
Thousands of Units, End of Period
9,000
8,000
7,000
6,000
5,000
4,000
3,000
Jan.2005 Sep.2007 May.2010 Jan.2013 Sep.2015 May.2018
Last observation is September 2020.
11The Economic Narrative—Part 2
• Services-based industries that depend on human
interaction have seen especially large output and
employment losses. A spike in bankruptcies.
• The amount of unused capital stock owing to
work-from-home arrangements is massive. How
much of the shift in preferences is permanent?
• Technologies developed during the pandemic
will likely lead to long-run compositional
changes in output and employment.
• But the magnitude of these longer-run effects are
not yet known.
12Spending on Goods Has
Recovered, But Not on Services
Real Consumer Spending and its Major Components
Index, Jan. 2020 = 100
115
110
Goods
105
100
95
90
85 Services
80
75
70
Jan.2020 Mar.2020 May.2020 Jul.2020 Sep.2020
Total PCE Durables Nondurables Services 100
13The Economic Narrative—Part 3
• The Fed’s new monetary policy strategy is
another economic dynamic at play.
• The new strategy elevates employment
conditions in the Fed’s decision-making process.
• Importantly, it also seeks to temporarily drive
inflation above 2% to make up for past misses.
• The new strategy hasn’t been stress-tested yet.
• Fiscal and monetary policy changes suggest that
the long-run inflation outlook may be less
sanguine than many expect.
14The Fed is Likely to Keep Rates
Lower for Longer
The FOMC's Nominal Federal Funds Target: Actual and Projected
Percent “So you know, we’re
6
not thinking about
5 raising rates. We’re
Actual FFTR not even thinking
4 about thinking
Sept. 2020 SEP Projection
3
about raising rates. So
what we’re thinking
2 about is providing
support for this
1
economy.”
0
FOMC Chair Jerome
2003 2004 2006 2008 2010 2011 2013 2015 2017 2018 2020 2022 Powell, June 10, 2020.
SOURCE: Federal Reserve and Haver Analytics
15The Bond Market’s Inflation
Barometer is Quiet
16The Economic Outlook According
to FOMC Participants
September 2020 FOMC Economic Projections
Percent
10.0
2020 2021
8.0 7.6
5.5 2022 Longer run
6.0
4.0 4.6 4.1
4.0
3.0
1.9 1.7 1.8 2.0
2.0 1.2
0.0
-2.0
-4.0
-3.7
-6.0
Real GDP Unemployment Rate PCEPI Inflation
NOTE: FOMC Projections are the median estimates of FOMC participants. The unemployment
rate is the average of the fourth-quarter for the year indicated.
17Economic Uncertainty Remains
High—That’s Not Good
Key factors elevating
uncertainty:
• Path of the virus/vaccine
• Future fiscal policy
• Economic scarring
• Global economic
outlook
18St. Louis Fed Resources
https://research.stlouisfed.org/resources/covid-19/
19QUESTIONS?
20You can also read