Learning during the pandemic: review of international research - Report 5 of 5 on learning during the 2020 coronavirus (COVID-19) pandemic
←
→
Page content transcription
If your browser does not render page correctly, please read the page content below
RESEARCH AND ANALYSIS

Learning during the pandemic:
review of international research
Report 5 of 5 on learning during the 2020
coronavirus (COVID-19) pandemic

                                            1
Learning loss during the pandemic: review of international research
Authors
• Neil Stringer
• Ellie Keys
With thanks to
• Charlotte Lockyer
• Paul Newton
2Learning loss during the pandemic: review of international research
Contents
Authors ..................................................................................................................................... 2
With thanks to ................................................................................................................................... 2
Executive summary ................................................................................................................. 5
Introduction .............................................................................................................................. 8
Background and scope .................................................................................................................... 8
Better to have learned and lost than never to have learned at all................................................ 9
Quality vs. quantity ......................................................................................................................... 10
Learning loss scenarios ................................................................................................................. 10
Structure of the report .................................................................................................................... 12
International evidence on learning loss ..............................................................................13
Evidence from largescale testing programmes following COVID-19 school closures ............ 13
Evidence summary .................................................................................................................................... 13
Modelling .................................................................................................................................................... 13
Real data ..................................................................................................................................................... 15
Evidence from other events: the impact of variation in school time on learning ..................... 20
Evidence summary .................................................................................................................................... 20
Teaching Time ........................................................................................................................................... 21
Absences .................................................................................................................................................... 24
Weather-related school closures ............................................................................................................. 25
Teacher strikes .......................................................................................................................................... 26
Natural disasters ....................................................................................................................................... 28
Previous pandemics .................................................................................................................................. 30
Summer learning loss ............................................................................................................................... 31
Student dips in performance.................................................................................................................... 33
Summary of the international evidence on learning loss ........................................................... 35
International evidence on learning remotely ......................................................................36
Efficacy of online learning .............................................................................................................. 37
Evidence summary .................................................................................................................................... 37
Evidence regarding the efficacy of online learning ................................................................................ 37
3Learning loss during the pandemic: review of international research
Differential impacts on students................................................................................................... 40
Evidence summary .................................................................................................................................... 40
Introduction ................................................................................................................................................ 40
Age or grade ............................................................................................................................................... 42
Gender......................................................................................................................................................... 42
Ethnicity & socio-economic factors ........................................................................................................ 43
Evidence summary.................................................................................................................................. 43
Socio-economic status ............................................................................................................................ 44
Digital divide ........................................................................................................................................... 45
Race......................................................................................................................................................... 46
Family support ........................................................................................................................................ 47
Prior attainment ......................................................................................................................................... 48
Special educational needs and disabilities............................................................................................. 49
Non-cognitive abilities and wellbeing ...................................................................................................... 49
Summary of the international evidence on learning remotely ................................................... 51
Conclusion..............................................................................................................................51
References ..............................................................................................................................55
4Learning loss during the pandemic: review of international research
Executive summary
In March 2020, schools around the world began to close as part of a global effort to
reduce the transmission of the coronavirus (COVID-19) pandemic. In early April
2020, at the peak of the closures, 1.6 billion students – over 90% of the world’s total
– were thought to be affected. By the summer (northern hemisphere), when schools
in many countries break for holidays, globally, the average student had missed
almost 50 school days – or a quarter of a school year. To minimise the learning lost
while schools remained closed, governments and schools around the world
responded by putting in place remote learning. In England, this largely took the form
of online learning, up to and including teacher-led lessons.
Rapid evidence assessments published at the beginning of the school closures
painted a grim picture of the impact these closures could have on students’ learning.
Modelling based on data pertaining to ‘summer learning loss’ suggested that
students might learn little to nothing while schools remain closed, and studies of the
efficacy of remote – including online – learning suggested it may only partially offset
the losses.
The purpose of this report is to review international research papers and reports that
may help our understanding of the scale and nature of learning loss in England.
Three scenarios for learning loss were identified from the literature.
In the first scenario, mean attainment falls; however, the overall distribution of
attainment remains the same. This means that any losses would be distributed
evenly across the student population, that is all students would be affected equally.
In the second scenario, mean attainment falls, but the distribution of losses is
uneven across the student population, causing the standard deviation1 to increase.
Some students may do better than they would otherwise have done, some may be
relatively unaffected, but many will do worse: some of them quite substantially so.
The third scenario is much like the second, except that a significant proportion of
students score zero – or very close to it – on their assessments, producing a second
peak at the low end of the distribution curve. This represents, at best, no progress
and, at worst, regression for the worst-affected students.
In the first of 2 main sections of this report, we review the early papers that modelled
the impact of school closures on students’ attainment and more recent reports based
on students’ performance in large-scale testing programmes following school
closures. In addition to this, we review the diverse literature on the impact of other –
non-COVID-19-related – events on students’ attainment. These events include
1
A quantity expressing by how much the members of a group differ from the mean value for the
group.
5Learning loss during the pandemic: review of international research
normal variations in teaching time, sickness absence, weather-related school
closures, teacher strikes, natural disasters, previous pandemics, and the
aforementioned summer learning loss.
Early modelling of the impact on learning of school closures projected average
learning losses, with greater losses in mathematics than reading, and an uneven
distribution of losses according to socio-economic factors. Subsequent studies
reporting pre- and post-school closure assessment data suggest losses were not as
great as some of the most pessimistic projections, although the overall pattern
predicted was correct.
School closures in the second quarter of 2020 put students typically 2 to 3 months
behind the academic milestones their cohorts would be expected to reach. As
anticipated, losses were frequently greater in mathematics (3 months) than in
reading (one-and-a-half months). In most studies, disadvantaged populations
experienced above-average losses. There is some evidence that younger students
were more adversely affected than older students, though there is variation across
research studies.
The impact of variation in teaching time on student attainment has been studied
internationally in several different contexts (for example, the length of school days,
student absences, and teacher strikes). In general, a reduction in the time spent in
school is associated with a reduction in student test scores. Individual student
absences have a greater impact on attainment than whole school closures do,
probably because it is easier for teachers to facilitate whole classes than individual
students in catching up. In all of the different contexts we reviewed, mathematics
was more severely impacted by reductions in teaching time than literacy,
conceivably because students can develop their literacy skills outside of school more
easily. A common finding across countries and contexts is that students from lower
socio-economic backgrounds are most impacted by changes to teaching time.
In the second main section, we review evidence of the efficacy of online remote
learning – before and during the COVID-19 related disruption – and how that efficacy
– and thus learning loss – may vary according to students’ characteristics and
circumstances.
Online learning is generally associated with poorer outcomes than traditional
classroom teaching, although its effectiveness varies depending on implementation.
Teaching quality is fundamental to successful learning, and therefore generally more
important than the medium of delivery. Some of the shortcomings of online learning
during school closures may stem from hurried implementation on an unparalleled
scale; however, the medium is currently better suited to some tasks and types of
content than others. The limited opportunities for interactions with peers and
teachers may affect motivation and learning, particularly during the pandemic where
this extends to life beyond school.
6Learning loss during the pandemic: review of international research
Evidence suggests the effectiveness of online remote learning will vary according to
students’ characteristics and circumstances. It is expected that younger students
may adapt less easily than older students, and that boys and girls may be affected in
different ways. For example, boys appear to lose more learning time, while girls are
at greater risk of developing mathematics anxiety.
Access to the necessary equipment for remote learning, a home environment
conducive to learning, and parental support are all key to successful online and
home-based learning. These factors are all heterogeneous across student
populations, and variation in them can lead to substantial differences in learning
outcomes. Students with special educational needs and disabilities may find the
tailored support they require is not available when learning from home or that the
online platforms and devices they use do not accommodate their needs.
The evidence regarding the impact of school closures and online tuition on students’
non-cognitive abilities and wellbeing, including physical fitness, is more limited,
though the evidence available points to declines. Finally, the school closures in the
learning loss literature are typically not accompanied by restrictions on social
interactions outside of school. Therefore, it remains an empirical question how this
affects recovery from learning loss as schools reopen fully.
Of the 3 learning loss scenarios identified, the evidence we reviewed suggests that
the effect of socio-economic status on assessment scores alone might be expected
to produce the second scenario. In this scenario, the distribution of losses across the
student population is uneven, causing a fall in mean attainment and an increase in
the standard deviation. Regarding the worst-case scenario, in which a subpopulation
of students has effectively ceased learning, there is evidence to suggest some
students will have fallen badly behind during school closures. Nevertheless, the
medium to longer-term outcomes for these students are probably not inevitable and
will depend on re-engagement and support with continuing to learn.
The aim of this literature review was to understand how COVID-19 has affected
student learning across the globe, to inform our understanding of the variety of ways
in which it has affected students in England. Of course, countries have experienced
and responded to the pandemic in very different ways, and although many insights
from our literature review are likely to generalise to circumstances in England, others
may not. Our review should be read with this caveat in mind.
7Learning loss during the pandemic: review of international research
Introduction
Background and scope
In March 2020, the World Health Organization declared COVID-19 a pandemic. As
part of the effort to reduce transmission of the virus, many countries closed their
schools.2 At the peak of school closures in early April 2020, over 90% of the world’s
students – 1.6 billion students across 194 countries – were estimated to be affected
(UNESCO, 2020b). In an international survey conducted by UNESCO, UNICEF, and
The World Bank during the summer3, 108 countries reported missing an average of
47 days4 of in-person teaching due to school closures. This is equivalent to
approximately one-quarter of a regular school year (UNESCO et al., 2020).
UNICEF (2020) estimates that, as of November 2020, more than 570 million
students – 33% of the enrolled students – globally were affected by country-wide
school closures in 30 nations. School closures have continued or recurred in many
countries through 2020 and early 2021 – including England from January to March
2021 – though the number of students affected globally at any one time has
remained lower than the initial peak (UNESCO, 2020b). The OECD (2021) reported
that, 1 year after the pandemic hit, primary and secondary schools were open for at
least the vast majority of students in less than 40% of the 33 countries for which they
had comparable data.
Governments and schools quickly introduced remote teaching and learning so that
students could continue their education during school closures (UNESCO et al.,
2020). It is important for our understanding of learning loss to gauge the
effectiveness of remote schooling compared with face-to-face schooling. It is also
vital to understand the differential impact of school closures on the learning of
children, depending on their circumstances. Access to technology is not
homogeneous and home environments are not all equally conducive to learning.
In England, the scale of the disruption and the rollout of remote tuition have no
modern precedents; however, globally, events such as natural disasters and war
have resulted in comparable levels of disruption. This report is a companion to our
report covering research on learning loss from England.
2
To be precise, in England, for example, although schools were closed to the majority of students,
most schools remained open to vulnerable students and the children of key workers.
3
Answers were received from July 15, 2020 to October 15, 2020, with August 20, 2020 as average
date.
4
Countries where the academic year was still ongoing at the time of the survey reported more days of
teaching lost (54 days) on average compared with those where the academic year had finished at the
time of the survey (40 days).
8Learning loss during the pandemic: review of international research
The focus of this report is on understanding the possible scale of learning loss
England’s students may face based on a reading of international research on school
closures. We review international reports and papers on the loss of learning caused
by such events, including the COVID-19 pandemic, as well as teacher strikes,
summer learning loss, and absenteeism. We consider how effective alternative
arrangements – primarily remote learning – have been, including any disparities in
effectiveness between students from different backgrounds and circumstances. We
have chosen to focus on the issue of learning loss and the use of remote learning to
alleviate it; longer term strategies for remedying learning loss and the longer-term
economic impacts of learning loss are out of scope.
Our approach to the review is thorough, though not systematic. For the sections on
the COVID-19 pandemic specifically, we attempt to be comprehensive in our
coverage of reports that model or report real data regarding learning loss at scale.
We elected not to focus on small-scale studies, such as reports based on data from
individual institutions, because the findings are less likely to generalise well from
very specific contexts to schools in England, and would likely add diminishing returns
alongside large-scale studies.
For the sections on non-COVID-19 learning loss, the body of research we report on
overlaps with that included in various reports by international organisations. We are
therefore confident we provide a thorough overview of the relevant research,
including journal articles and reports, though it is not intended to be as
comprehensive as the coverage of the COVID-19-related research.
The section on non-cognitive abilities and wellbeing is briefest, as less research is
available and our focus was on these factors as they related to learning loss rather
than in their own right. Data on the effect of the pandemic on these factors is likely to
emerge more slowly than large-scale assessment data.
Technical and vocational learning is largely conspicuous by its absence in the
international literature and consequently in this report. This is perhaps unsurprising,
as many studies focus on attainment in reading and mathematics and students at
stages of their education prior to selecting academic or vocational tracks. Finally, our
review is almost exclusively restricted to publications in the English language.
Better to have learned and lost than never to have
learned at all
The literature on learning loss includes scenarios in which students have learned
everything they are supposed to, but scheduled breaks in education – such as the
summer holidays – result in performance dips in the following autumn term. There
are also scenarios in which students have not learned everything they are supposed
to. This is an important distinction, as it is likely to have implications for the trajectory
9Learning loss during the pandemic: review of international research
of learning regain. Summer learning loss may be best thought of as rustiness or a
loss of form, requiring revision or practice for swift regain; in contrast, the absence of
original learning may be considerably harder to regain (Education Endowment
Foundation, 2020a).
A study by Kuhfeld and Soland (2020) shows that rates of growth are higher at the
beginning of the school year and slow towards the end. A plausible interpretation of
this is that part of the growth at the beginning of the school year is regain that is
acquired more quickly than new learning (Education Endowment Foundation,
2020a). Kuhfeld and Soland also show that this nonlinear growth may mean
estimates of summer learning loss that assume linear growth are overestimated as
much as twofold.
Quality vs. quantity
Discussion of learning loss sometimes focuses on the timetabled learning hours lost
compared with the time spent studying remotely. This implicitly assumes an hour
learning in school is worth an hour learning remotely at home. This may not always
be the case; time in school may be more or less productive than time at home, and
this will depend to an extent on how the time is used by the teacher. Moreover, it is
likely that the students’ home environments are a significant source of variation in
productivity that is normally moderated by their presence in school. It is important to
bear in mind that lost time does not necessarily equal lost learning – though it might
– and that lost time almost certainly does not result in the same degree of lost
learning for all students.
Learning loss scenarios
UNESCO et al. (2020) warn that even short interruptions to children’s schooling can
have long-lasting negative impacts on their learning (Alban Conto et al., 2020). The
OECD (2020b) uses the language of labour economics to compare the long-term
impact of school closures on students’ outcomes with hysteresis5: the long-term
effect of unemployment on a worker’s ability to find a job. They argue the potential
learning loss is determined by 2 concurring factors: (i) how much students have
learnt during school closures – or the “intensive margin” – refers to the efficiency of
education continuity solutions; (ii) how many students continued to learn during the
school closures – or the “extensive margin” – refers to the proportion of students
engaged in the education continuity solutions.
5
The term used to describe any system in which the response depends not only on its current state,
but also on its historic states.
10Learning loss during the pandemic: review of international research
Schools face challenges integrating information and communication technologies
into the classroom (OECD, 2018b, 2019) and there were signs early on during
school closures that some students either could not be – or had not yet been –
contacted by their teachers (Goldstein et al., 2020; Les Echos, 2020). Potential for
hysteresis of the COVID-19 crisis in education (Saavedra, 2020) stems from various
elements, often linked to students’ socio-economic status (SES), leading to a
withdrawal from the school system that will produce a long-term impact on students’
outcomes. Given the critical role IT resources and parental involvement have played
in ensuring education continuity during the crisis (Gouëdard et al., 2020), the
hysteresis caused by school closures may be more prevalent among students from
less privileged backgrounds (OECD, 2020b).
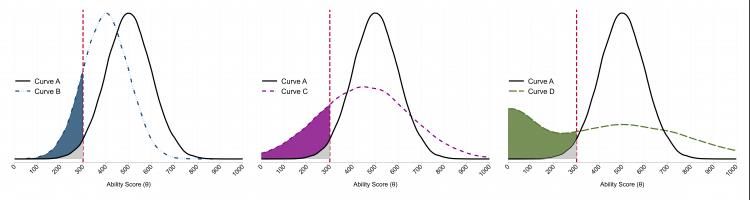
The World Bank (Iqbal et al., 2020) identifies 3 distinct learning loss scenarios
(Figure 1).
Figure 1. Three possible scenarios of how the learning curve may evolve in the coming months: a lower average,
a higher standard deviation, or a sharp increase in low learning at the bottom.6
They describe them as:
1) The most straightforward transformation is a reduction in average learning
levels across the distribution (the blue curve, left). This scenario is very likely,
despite the best efforts of school systems to provide distance
learning. Variation in teaching time is associated with learning loss (Cattaneo
et al., 2016) and shocks, like floods, affect learning outcomes across grade
levels (Thamtanajit, 2020).
2) The curve may flatten or skew due to highly unequal effects of the crisis (the
purple curve, centre). In this scenario, children at the top will make gains,
while students at the bottom fall further behind. This divide may run along
lines of SES. Wealthier families are better placed to mitigate the effects of
6
“Three possible scenarios of how the learning curve may evolve in the coming months: a lower
average, a higher standard deviation, or a sharp increase in low learning at the bottom” by The World
Bank is licensed under CC BY 4.0.
11Learning loss during the pandemic: review of international research
school closures, being more likely to have: comfortable homes; good internet
connections; the means to provide private tuition; and well-educated parents,
better placed to home school their children. The bottom of the income
distribution may also see a sharp increase in poverty from unemployment
(Worley, 2020). For example, the 2008 to 2009 recession negatively affected
learning, particularly in districts with higher proportions of disadvantaged and
minority children (Shores & Steinberg, 2018).
3) The curve may change due to chronic absenteeism or dropouts (the green
population, now permanently out of school, right). Iqbal et al. take a global
perspective, noting that the 1997-98 Asian financial crisis (Cameron, 2009)
and the 1916 polio pandemic (Meyers & Thomasson, 2017) showed that
school enrolment can fall sharply due to both demand and supply side effects.
On the demand side, income shock leads families to ask their children
(particularly girls) to leave school to work. On the supply side, increased
numbers of schools may close permanently, particularly in countries that have
expanded schooling through low-fee private schools (Yousafzai, 2020). These
kinds of effects will be less pronounced in developed countries like England,
where education is compulsory, but they may have an impact on post-
compulsory education, and on particular groups of students.
The World Bank also estimated that 5-month school closures could result in 25%
more students falling below a baseline level of proficiency needed to participate
effectively and productively in society, and in future learning (Azevedo et al., 2020).
The modelling was at a coarse geographical level (for example, Europe and Central
Asia, Latin America and the Caribbean, and the Middle East and North Africa). The
percentage point changes by region were broadly consistent, though regions
comprising less-developed countries started from a much higher baseline than those
comprising more-developed countries.
David et al. (2020) expected examination-oriented progress to slow down for all
students. They argued that examination-oriented syllabuses become unfit for
purpose when tests and examinations have been put on hold, and that much of the
curriculum cannot be adapted quickly to online teaching (Graham & Sahlberg, 2020).
Structure of the report
The body of the report is divided into 3 main sections. The first section considers the
international evidence on learning loss and is organised into subsections on: (i) the
COVID-19 pandemic, looking at initial modelling of potential learning loss and the
real impact using subsequent assessment data; and (ii) evidence from non-COVID-
related factors, including variations in teaching time, school summer holidays, and
unplanned disruption.
12Learning loss during the pandemic: review of international research
The second section considers the use of remote learning and is organised into
subsections on: (i) evidence regarding the efficacy of online learning as an
alternative to traditional schooling; and (ii) the evidence on how the efficacy of online
learning may be mediated by factors including students’ age, gender, ethnicity, SES,
prior attainment, and special educational needs and disabilities.
The third section briefly considers the impact of school closures and online learning
on: (i) students’ non-cognitive abilities – such as learning skills and social and
communication skills; and (ii) wellbeing – including their physical and mental health –
with particular regard to how these underpin learning.
International evidence on learning loss
Evidence from largescale testing programmes
following COVID-19 school closures
Evidence summary
Some of the most pertinent evidence available regarding learning loss comes from
testing programmes that have measured student progress before and after school
closures. The performance of these students can be compared with the progress of
previous cohorts that were unaffected by school closures. Prior to this a number of
studies used data from testing programmes to model the likely learning loss based
on the known impact of other events, in particular the school summer holidays and
absenteeism.
Early modelling of the impact on learning of school closures anticipated average
learning losses, with greater losses in mathematics than reading, and an uneven
distribution of losses according to socio-economic factors. Studies of pre- and post-
school closure assessment data from several countries suggest school shutdowns in
the second quarter of 2020 put students typically 2 to 3 months behind the academic
milestones their cohorts would be expected to reach.
Losses were frequently greater in mathematics (3 months) than in reading (1½
months), and in most studies disadvantaged populations experienced above average
losses. There is some evidence that younger students were adversely affected more
than older ones, though this appears less consistent across studies than the other
effects. There is little evidence available on gender effects.
Modelling
Kuhfeld, Soland, et al. (2020) produced a series of projections of COVID-19-related
learning loss based on estimates from the absenteeism literature and analyses of
13Learning loss during the pandemic: review of international research
summer learning patterns of 5 million U.S. students in grades 3-8 (ages 8 to 14) who
took MAP® Growth™ assessments in the 2017-18 and 2018-19 school years. Based
on school closures prior to the summer holidays, they expected students to begin the
autumn term with approximately 63% to 68% of the learning gains in reading and
37% to 50% of the learning gains in mathematics relative to a typical school year.
Learning loss was not expected to be universal, however, with the top third of
students potentially making gains in reading. Unlike mathematics, for which the
standard deviations1 of expected scores were like a typical year, for reading, not
only was average attainment expected to fall, but the standard deviation of expected
scores increased by up to 20%.
Some consolation was to be found in the prediction that students who would lose the
most while out of school should gain the most the following year. However, these
models are based on typical summer loss conditions, and it is uncertain how factors
such as financial uncertainty, health issues related to the virus, and psychological
stresses may affect subsequent academic growth.
The authors acknowledge that their analyses could not address the impact on ethnic
groups but suggest it may be disproportionately great. For example, African
Americans have experienced higher than average rates of COVID-19 infections and
deaths (Bouie, 2020), and the economic downturn in the United States has been
particularly damaging for Black and Hispanic parents, who are typically less able
than other ethnic groups to work from home (Cerullo, 2020; Krogstad et al., 2019).
Modelling the relationship between schools’ student attendance rates and student
proficiency levels, EmpowerK12 (2020a) estimated that metro Atlanta7 students
losing 9 weeks of regular teaching (due to the COVID-mandated move to distance
learning in mid-March) would result in the percentage of students demonstrating
proficiency to drop 3.6 points in English language arts and 4.9 points in mathematics
compared with the previous year. Economically disadvantaged students and
students of colour, who were already behind their peers, were expected to fall further
behind, reversing recent gains.
Kaffenberger (2020) used a calibrated model with a “pedagogical production
function” (Kaffenberger & Pritchett, 2020) to estimate the potential long-term losses
to children’s learning from the temporary shock of school closures. The model
showed that without mitigation, students could lose more than a year’s worth of
learning from a 3-month school closure, as short-term losses continue to compound
after schools reopen.
7
In the United States, a metropolitan statistical area (MSA) is a geographical region with a relatively
high population density at its core (typically a single large city) and close economic ties throughout the
area.
14Learning loss during the pandemic: review of international research
Real data
The authors of several of the following studies acknowledge possible issues with the
validity and/or representativeness of the data collected in 2020. In some instances,
tests were taken online at home instead of in school, which resulted in some
students performing better than anticipated. Curriculum Associates (2020a), for
example, excluded data from tests taken at home. Another effect of home test taking
and/or limited school opening was that the samples tended to be incomplete, with
the missing students typically being from backgrounds most likely to be adversely
affected by the school closures (for example Kuhfeld, Tarasawa, et al., 2020).
The result of the validity and sampling issues is that the effects may be under- or
overestimated. The impact of school closures may be underestimated where
students have received help or used prohibited resources during the test, or where
the students most affected by the pandemic have not been assessed. Conversely,
there may be students who have taken tests at home in suboptimal conditions (for
example with noise, distractions, poor IT equipment) who would have performed
better in schools. The learning lost by these candidates – both absolute and relative
to their more advantaged peers – may be overestimated. For these reasons, it is
probably best to treat the findings as an indication of what we might expect to see in
England rather than a precise estimate.
Following up on their projections for learning loss, Kuhfeld, Tarasawa, et al. (2020)
analysed data from MAP® Growth™ assessments taken by students in the autumn
of 2020. They found students in grades 3 through 8 (ages 8 to 14) performed
similarly in reading compared with same-grade students in autumn 2019, but about 5
to 10 percentile points lower in mathematics.
In nearly all grades, most students made learning gains in both reading and
mathematics since the beginning of the COVID-19 pandemic. Nevertheless, gains in
mathematics were lower on average than in previous years. Students scored better
than projected in reading, while mathematics scores were in line with projections for
grades 4 through 6 (ages 9 to 12), but slightly above projections in grades 7 and 8
(ages 12 to 14). There was some indication in the data that differences may be
emerging along lines of race, and that student groups especially vulnerable to the
impacts of the pandemic were most likely to be missing from the data.
A study published by McKinsey & Company (Dorn et al., 2020a) analysed
assessment data from the Curriculum Associates i-Ready platform and reported that
K-5 (ages 5 to 11) students in their sample learned only 67% of the mathematics and
87% of the reading that grade-level peers would typically have learned by the
autumn. This translates into an average student losing the equivalent of 3 months of
learning in mathematics and one-and-a-half months in reading. In schools with
mainly students of colour, scores were 59% of the historical average in mathematics
and 77% in reading.
15Learning loss during the pandemic: review of international research
Renaissance Learning (2020) analysed the results of over 5 million grade 1 to 8
students (ages 6 to 14) from across the United States who had taken Star Early
Literacy, Star Reading, or Star Math assessments in both autumn 2019 and autumn
2020. They compared the progress of these students – who experienced school
closures in 2020 – with historical norms based on the progress of previous,
unaffected cohorts. They reported a small negative effect on reading achievement
and growth, and a moderate negative effect on mathematics achievement and
growth, with the impacts varying by grade.
In reading, students in many grades were performing close to expectations but in
others they were as far as 7 weeks behind (such as 4 to 7 weeks behind for students
in grades 4 through 7). For mathematics, students in all grades were performing
behind expectations, with some grades 12 or more weeks behind (such as 8 to more
than 12 weeks for students in grades 4 through 8).
A follow up study by Renaissance Learning (2021) reported that student growth
during the first half of the 2020 to 2021 school year was approaching normal levels in
both reading and mathematics, with the impact of COVID-19 on achievement
beginning to shrink in many grades. Despite the encouraging headline figures,
autumn-to-winter growth results varied by subgroup. Black, Hispanic, American
Indian, English language learner (ELL) students, and students with disabilities grew
less than the overall sample. Similarly, students attending urban or Title 1 Schools
were more likely to experience below-typical rates of growth.
Engzell et al. (2020b, 2020a, 2021) estimated the learning loss that occurred when
Dutch schools closed for 8 weeks by comparing data from national primary school
examinations that took place just before and after schools closed with similar data
from previous years. Students lost on average 3 percentile points or 0.08 standard
deviations: a fifth of a year’s worth of learning – that is roughly the length of the
school closures – with losses up to 60% greater among students from disadvantaged
homes.8 Interestingly, learning loss did not vary according to past levels of student
achievement (although see Grewenig et al., 2020).
Engzell et al. note that the Netherlands underwent only an 8-week lockdown, has an
equitable system of school funding, and enjoys the world's highest rate of broadband
access. They argue that, in many respects, it represents a best-case scenario.
However, Engzell et al. acknowledge that the circumstances were not necessarily
ideal – the short duration of school closures allowed little time to adapt teaching and
learning – and that these results may represent a temporary setback. It is also
possible that some of what is lost in post-school closure assessments is examination
8
For reference, Wößmann (2016) suggested that, as a rule of thumb, learning gains during one year
on most national and international tests are equal to between one-quarter and one-third of a standard
deviation.
16Learning loss during the pandemic: review of international research
technique and/or practice rather than knowledge, skills, or understanding in the
domain being tested.
EmpowerK12 (2020b) studied the impact of school closures on students in the
District of Columbia in the United States. Predictions of learning loss from the spring
(EmpowerK12, 2020a), estimated in half to full numbers of years, did not come true.
Students gained knowledge, though their gains were significantly less than during in-
person schooling. Students lost 4 months of learning in mathematics and 1month of
learning in reading, though students most at risk of academic failure9 lost more
learning: 5 months in mathematics and 4 months in reading. It seems likely that one
of the original assumptions of their model – that distance learning initiatives would
have limited effect on average – was somewhat conservative.
There was evidence of small differential impact by student subgroup, with Black,
Hispanic, and American Indian students experiencing slightly more negative impacts
than the overall averages. Students attending schools serving low-income families
were also more negatively impacted, as were students attending schools that were
public as opposed to private, and schools in rural or town areas as opposed to urban
or suburban areas.
Using data from i‑Ready Diagnostic for Reading and for Mathematics, Curriculum
Associates (Curriculum Associates, 2020b; Huff, 2020) looked at the proportion of
students performing below grade level overall by subject in autumn 2020 compared
with prior academic school years. Although they found evidence of a “COVID slide”,
they noted that it was not as severe as many observers had feared. The analysis
showed that: (i) the proportion of students ready for grade-level teaching in autumn
2020 was smaller than the historical average; and (ii) the proportion of students
performing below grade level was greater in mathematics than in reading.10,11
An age breakdown of the data showed that, in reading, a higher proportion of
elementary school students performed below grade level than students in middle
school. The picture for Mathematics was less straightforward, with grades 2, 3, and 4
having higher proportions of students performing below grade level than students in
grades 1, 5, 6, 7, and 8.
9
Broadly defined as students whose characteristics or circumstances put them in a vulnerable
position for having academic and/or social problems in school.
10
The historical comparison sample is based on a rolling average of autumn test scores across 2017,
2018, and 2019, for any student in the same schools analysed in autumn 2020.
11
Historically, 27% of students in Reading placed below grade level on the autumn Diagnostic. In
autumn 2020, 28% of students placed below grade level. Historically, 23% of students in Mathematics
placed below grade level on the autumn Diagnostic. In autumn 2020, 29% of students placed below
grade level.
17Learning loss during the pandemic: review of international research
The data were also disaggregated by the proportion of Black, Indigenous, and
people of colour (BIPOC) attending schools. In both reading and mathematics,
schools with a higher proportion of BIPOC students saw their number of students
below grade level increase more than schools with fewer BIPOC students. Likewise,
when the data was disaggregated by each school’s median household income,
lower-income schools saw their number of students below grade level increase more
than higher-income schools in both reading and mathematics.
A study of schools in Flanders, the Flemish (Dutch)12 speaking part of Belgium, from
2015 to 2020 found significant learning loss for students in the 2020 cohort
(Maldonado & De Witte, 2020). School closures appear to have led to a decrease in
school averages of mathematics scores of 0.19 standard deviations and Dutch
scores of 0.29 standard deviations compared with the previous cohort.
The Belgian study is unique in that language learning was more affected than
mathematics. This may be because Belgium has 3 official languages, Flemish
(Dutch), French, and German, which are spoken in different parts of the country.
Although students attending schools in Flanders predominantly speak Flemish at
home, in some areas closest to the French-speaking region, there may be more
crossover in the students’ primary language.
These findings may extend to students in England who speak English as an
additional language (EAL) (see also Armour et al., 2020). Additionally, variation
within schools increased by 17% for mathematics and 20% for Dutch, while
inequality between schools increased by 7% for mathematics and 18% for Dutch.
Bielinski et al. (2021) analysed data from FastBridge adaptive reading and
mathematics assessments in the United States, comparing students’ growth from
autumn 2019 to autumn 2020 with rates of growth derived from the 3 prior cohorts.
The analysis shows COVID-19-related disruption negatively impacted K-8 (ages 5 to
14) students’ learning in mathematics and reading, with the greatest losses – as high
as 3 to 4 months’ worth – in mathematics and in late elementary and middle school
grades. The effects were observed uniformly across school strata (rural, urban, and
suburban), school-level poverty rates, and race and/or ethnic composition.
Using data from a computer-based formative feedback system in Switzerland,
Tomasik et al. (2020) compared learning gains in mathematics and language of
28,685 students during the 8 weeks of COVID-19-related school closures with
learning gains in the 8 weeks prior to the school closures. Secondary school
students were largely unaffected by the school closures in terms of learning gains;
however, primary school students’ learning slowed down at the same time as
interindividual variance in learning gains increased. The authors concluded that,
12
The languages learned at school are officially labelled French and Dutch.
18Learning loss during the pandemic: review of international research
although distance learning arrangements seemed an effective means to substitute
for in-person learning (at least in an emergency), not all students benefit to the same
degree.
In the Dallas Independent School District, Measure of Academic Progress (MAP)
tests given to students in September and October 2020 – and compared with their
midyear assessments in 2019 – indicated that half of all elementary and middle
school students experienced learning loss in mathematics (by up to as much as 30
percentage points) and nearly a third slipped in reading during the COVID-19-related
disruption. The slide in mathematics was attributed to students being unlikely to use
mathematics concepts outside of school.
There were disparities between Black and Latino students – who make up more than
90% of the district’s student population – and the rest of the district, for example in
mathematics, the percentages of Black students reaching the “meets grade level”
projections ranged from 7.5% (in fourth grade) to 17.9% (in eighth grade) compared
with a range of 41.8% to 61.2% for White students in the district (Carter, 2020;
Dallas Independent School District, 2020; Smith, 2020). It is unclear though how
these disparities compare with those in previous years, that is whether they are the
same or greater.
A study published by Amplify (2021) analysed the effects of COVID-19 disruptions
on literacy skills by comparing DIBELS 8th Edition (a battery of one minute fluency
measures) benchmark data from the middle of the school year 2019-20 and 2020-
21. The findings suggested that in 2019-2020, 28% of U.S. kindergarten students
(age 5/6) were in the lowest category of early literacy skills; in 2020-21 it was 47%.
Learning losses due to COVID-19 disruptions were disproportionately concentrated
among Black and Hispanic students – particularly the youngest ones (kindergarten
and grade 1). In 2019-20, 27% of Black kindergarten students were in the lowest
category of early literacy skills, compared with 54% in 2020-21. Similarly, 34% of
Hispanic students were in this category in 2019-20 compared with 59% in 2020 to
2021.
Domingue et al. (2021) used data from an oral reading fluency (ORF) assessment
administered in over 100 U.S. school districts to assess the effects of the pandemic
on reading development. The findings suggested that in spring 2020 students
showed limited or no growth in ORF gains relative to previous years; however, it is
worth noting that, due to the impact of COVID-19, only a fraction (roughly 30%) of
students were assessed in the spring.
In autumn 2020, there was a far more representative sample of students; in this case
ORF growth approached levels observed in previous years, although autumn gains
were insufficient to recoup spring losses. At this time, around 5% to 10% of students
were missing from the sample: possibly those experiencing the most substantial
impact to their learning. The biggest impact on ORF growth was observed for
19Learning loss during the pandemic: review of international research
students in grades 2-3, as well as students in lower achieving districts. These
students seemed to be falling further behind and, as gains appeared to be unequal
across schools and districts, the effects of COVID-19 on oral reading fluency may be
introducing new skills gaps across students.
Pier et al. (2021) studied 6 districts in California that administered the MAP
assessment and 12 that administered the STAR assessment by comparing
outcomes from autumn 2019 to autumn 2020 with the previous 3 years. The findings
of this analysis suggested a significant learning loss in English Language Arts (ELA)
and mathematics, with students in earlier grades most affected.
Students from a socio-economically disadvantaged background and English
language learners (ELLs) were found to have significantly more learning loss
compared with previous years. Again, the findings may exclude the worst-affected
students, as only students who were present for assessments were measured.
Kogan and Lavertu (2021) found average achievement on the Ohio Third-Grade
English Language Arts (ELA) assessment declined by approximately 0.23 standard
deviations between autumn 2019 and autumn 2020. This is roughly equivalent to
one-third of a year’s worth of learning. It was also found that Black students
experienced test score declines that were nearly 50% larger than White students,
and students from socio-economically disadvantaged backgrounds were also found
to be more affected than those not identified as such.
It seemed the impact on student achievement was, to a large degree, tied to how
significantly COVID-19 had affected unemployment in the area; the largest test score
declines were in areas with the sharpest job losses. As well as this, districts that
began the academic year using remote teaching saw more declines in achievement
than those using in-person teaching or a combination of the 2. Most districts
experienced declines to some extent, but just over 10% of districts experienced no
test score declines during the pandemic, suggesting a decline resulting from COVID-
19 disruption is not inevitable.
Evidence from other events: the impact of variation in
school time on learning
Evidence summary
This section aims to estimate the impact that the pandemic might have on learning
loss by considering what is known about the impact of changes to teaching time, in
other circumstances, on student achievement. Variation in the time spent in school
has been studied in several different contexts with consideration of the impact that
this has on student skills and achievement. In general, a reduction in the time spent
in school is associated with a reduction in student test scores.
20Learning loss during the pandemic: review of international research
Student absences seem to have more of an impact on this than school closures,
perhaps because teachers face more challenges helping individual students catch
up than the whole class. A consistent finding, demonstrated in each of the various
contexts, is that reduced teaching time has more impact on mathematics than
literacy, perhaps because students can develop their literacy skills outside of school
more easily. Another common finding is that students from lower socio-economic
backgrounds are most impacted by changes to teaching time.
Teaching Time
The notion of time as a resource for learning, and something required to achieve
academically, is often considered to have first been conceptualised by Carroll
(1963), whose model of school learning included time and opportunity to learn as a
key contributor to the degree of learning achieved. Following this model, the
relationship between teaching time and student achievement has been studied at
length, most often using data on teaching time and students’ test scores. Several
international comparisons have generally found a marginal increase in teaching time
to have a positive impact on student achievement (Baker et al., 2004; Barro & Lee,
2001; Gromada & Shewbridge, 2016; OECD, 2011; Scheerens et al., 2013;
Wößmann, 2003; Yeşil Dağlı, 2019).
Several countries have seen adjustments to the number of classroom hours required
each day, or the number of days required in a school year, which have been used to
assess how changes to teaching time impact academic achievement. Jensen (2013)
studied the effects of a reform in Denmark, which led to changes in classroom hours
by 2.2% to 2.3% in literacy and mathematics.
While there were no significant effects on student achievement in literacy, it was
found that one additional hour of classroom time for mathematics per year increased
test scores by 0.0021 standard deviations. Although this is a relatively small
increase, it does suggest mathematics achievement is sensitive to even minor
changes to teaching time. Marcotte (2007) suggested the reason mathematics is
more affected by changes in teaching time, is that literacy teaching also takes place
at home.
Lavy (2012) studied changes to teaching time in Israel, finding increased time spent
on mathematics, science, and English positively impacted test scores in these
subjects. There was a much smaller effect when increasing teaching time in Hebrew.
As Hebrew is most people’s first language in Israel, the additional school time would
be unlikely to make much difference to learning outcomes because, proportionally, it
is very small.
Generally speaking, increased achievement in a given subject was the result of
increased time spent on that particular subject alone; there did not seem to be
crossover effects whereby increased time in one subject improved test scores in
21Learning loss during the pandemic: review of international research
others. One exception was that there were modest increases in science scores from
increased teaching time in mathematics. It appears that a reduction in mathematics
teaching could have the biggest impact on student achievement, in mathematics and
possibly other subjects with a mathematical basis.
In Germany, Mandel and Süssmuth (2011) used cross-state variation to study
differences in classroom hours and found one additional hour of teaching time per
week increased PISA13 test scores by around 0.12 standard deviations. Again, it was
found that the effect was more prominent in mathematics but still sizeable in reading.
In addition to this, they suggested that, while it seemed all students benefit from
increased teaching time, it was most beneficial for lower-achieving students.
Cattaneo et al. (2016) also found that the effectiveness of teaching time varies
substantially between students of different abilities; however, their findings
suggested that higher ability students benefitted most from an additional hour of
teaching. This study built on the research conducted by Lavy (2015), who analysed
the effect of cross-national variation in hours of teaching on test scores, and found
an additional hour of teaching time in a subject per week over the school year was
associated with a gain in test scores of 0.06 standard deviations; the effects were
even larger for children from lower socio-economic backgrounds.
It seems that the socio-economic background of students may be one of the most
influential factors in determining the impact of teaching time on achievement. Several
countries have introduced programmes of increased teaching time and seen a
positive impact on student achievement, especially for students from low socio-
economic backgrounds.
In South America, several countries have lengthened school days, from half-days to
full-days, often finding that the effects have the most impact on the poorest students
and those in rural areas (Bellei, 2009; Bonilla-Mejia, 2011; Cerdan-Infantes &
Vermeersch, 2007; Garcia et al., 2013; Hincapie, 2016). Hincapie (2016) also found
the positive effect of full school days was more beneficial for 9 th grade than for 5th
grade, suggesting age may also have an effect on the impact of teaching time.
Thompson (2021) studied schools in the United States that have changed from a
traditional 5-day school week to a 4-day week with slightly longer hours. This led to a
reduction in around 3 and a half hours of teaching time each week. The results
suggested a negative impact on student achievement, with declines between 0.044
and 0.053 standard deviations in mathematics and 0.033 and 0.38 in reading.
In addition to this it was again found that low-income students were most affected,
but also that boys were more impacted than girls. However, in the case of this study
there may be other factors at play contributing to these declines, other than the
13
Programme for International Student Assessment
22You can also read