Learning From the 2009 Recovery Act: Fewer jobs - Smart Growth America
←
→
Page content transcription
If your browser does not render page correctly, please read the page content below
Learning From the
    2009 Recovery Act:

Fewer jobs

                                     More jobs

       Lessons and recommendations
       for future infrastructure stimulus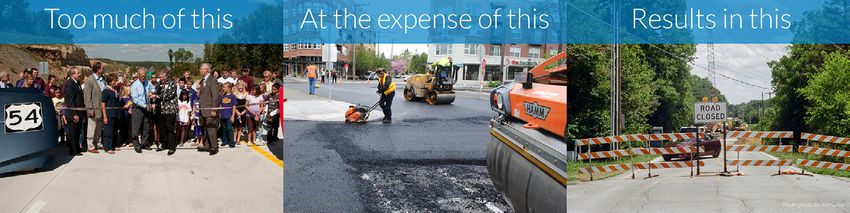
Acknowledgements: This report was written by Transportation for America Director Beth Osborne, Smart
Growth America Communications Director Stephen Lee Davis, and East Metro Strong Executive Director
Will Schroeer (Also Smart Growth America’s state policy director in 2011.) Cover photos: left photo: MODOT
Photos on Flickr, right top, ExpoLightRail on Flickr; right bottom, Seattle DOT on Flickr. It was released in April
2020. Some findings were previously discussed in Recent Lessons from the Stimulus: Transportation Funding
and Job Creation, released in 2011 by Smart Growth America, available here: https://smartgrowthamerica.
org/resources/recent-lessons-from-the-stimulus-transportation-funding-and-job-creation/

About Smart Growth America: Smart Growth America envisions a country where no matter where you
live, or who you are, you can enjoy living in a place that is healthy, prosperous, and resilient. We empower
communities through technical assistance, advocacy, and thought leadership to realize our vision of livable
places, healthy people, and shared prosperity. https://smartgrowthamerica.org/. Transportation for
America is a program of Smart Growth America.

Smart Growth America
1152 15th Street NW Ste 450
Washington, DC 20005
202-207-3355
www.smartgrowthamerica.org

Lessons from the previous stimulus and recommendations for the future
  Between 2009 and 2010, the American Reinvestment and Recovery Act (ARRA, commonly known as “the
       stimulus”) gave states $26 billion in flexible dollars to spend on surface transportation capital projects
          and $8.4 billion in funding for public transportation capital projects. Because the purpose was to
            create jobs, the funds came with the requirement that states report how they spent that money,
              and how many jobs they created with it.

                 The United States now needs another stimulus. A COVID-19 recession is all but certain.
                 Additional spending will almost certainly follow the CARES Act approved by Congress in late
                 March. While there are enormous needs for relief and support all across the economy, the
                 president and many congressional leaders have indicated that they want infrastructure to be
               a major part of some future stimulus bill. If Congress wants to use infrastructure spending
              to create jobs and support recovery, we should learn from the previous stimulus.

         This report reviews broad lessons from transportation spending in the last stimulus, especially how
that spending was used to varying degrees of success to create jobs and support short- and long-term
recovery. The lessons here are drawn from Smart Growth America’s close analysis of the 2009-2010 stimulus
spending which used state-reported documentation of how they spent ARRA money, and how many jobs
their stimulus-funded projects created.1 We also use economic models based on broad economic data, but
most of the lessons are drawn from ARRA-specific data. Because lessons do little good if we don’t learn from
them, we offer recommendations for using any future infrastructure stimulus to produce the desired results.

This is not a comprehensive list of lessons. Smart Growth America and Transportation for America invite
those who implemented Recovery Act programs or experienced the impacts of the programs locally to share
with us the lessons you learned.

1         Recent Lessons from the Stimulus: Transportation Funding and Job Creation. Smart Growth America, February 2011.
https://smartgrowthamerica.org/resources/recent-lessons-from-the-stimulus-transportation-funding-and-job-creation/.
Learning from the 2009 Stimulus

    Lesson 1: Some classes of transportation projects create substantially more jobs than others

 1. An ARRA dollar spent on public transportation produced 70 percent more job hours than an
    ARRA dollar spent on highways.
 2. Each mode showed clear differences in jobs produced per dollar in ARRA: Transit preventive
    maintenance had by far the highest direct job-per-dollar result, followed by rail car purchase
    and rehabilitation, transit infrastructure, and bus purchase and rehabilitation.

ARRA jobs reporting did not distinguish between road construction and repair as the source, but a wide
variety of other research consistently finds that on average, road repair produces 16 percent more jobs per
dollar than new road construction.2 This makes sense considering the fact that new roadways and roadway
expansions usually require right-of-way acquisition, which creates very few jobs (and no construction jobs),
as well as more planning and environmental review, which also creates just a few jobs.

Overall, ARRA was meant to create jobs, yet that was not how we targeted or governed spending.

Recommendation 1: To create the most jobs per dollar, invest in transit and maintenance.

                               Lesson 2: Public transit spending creates jobs fastest

120 days after ARRA was signed into law, each dollar of available transit funding had been spent
about 1.5 times faster than highway funding. At 10 months after signature, ARRA investments in public
transportation produced almost twice as many jobs per dollar as investments in roads.3

Operating money for transit typically produces the most jobs per dollar, because it is essentially all labor,
and it can be implemented immediately by preventing layoffs. Yet states or urbanized areas over 200,000 in
population were prohibited from spending any stimulus funds on transit operations. Nearly half a year into
ARRA, Congress gave these recipients the flexibility to use up to 10 percent of their transit capital funds on
operating costs. But largely because so much of the money had already been committed by that point, only
about 17 percent of recipients used that flexibility, spending just 2.2 percent of Recovery Act transit capital
assistance funds on operating expenses.4 Because of this limited spending, this analysis could not fully
compare transit operations funding to other categories for job creation.

Because Congress decided to limit transit agencies to capital spending in ARRA, lawmakers both slowed
recovery and created additional costs, leading to bizarre outcomes like agencies having money to buy new
buses they couldn’t afford to operate.

Recommendation 2: Create the maximum number of jobs by investing in transit expansion and
improvement, and provide emergency funding to stabilize operations and help transit agencies avoid
layoffs, service cuts and fare increases.

On this front, the CARES Act is already a significant improvement to the approach in ARRA. The CARES Act
included $25 billion for transit, explicitly intended for operations. TransitCenter estimates a national operations

2         Though ARRA reporting did not distinguish between road construction and repair for job creation, recipients were required
to report how much they spent on new capacity vs. repair. State DOTs lumped all road projects together when reporting jobs. Several
states chose to report transit hours in more detail, allowing us to distinguish between jobs created by new transit and transit repair.
3         What We Learned From the Stimulus. Smart Growth America, January 2010. https://smartgrowthamerica.org/resources/
what-we-learned-from-the-stimulus/
4         Federal Transit Administration Pub. L. No. 111-32, §1202, 123 Stat. 1859, 1908 (2009).

                                                                   3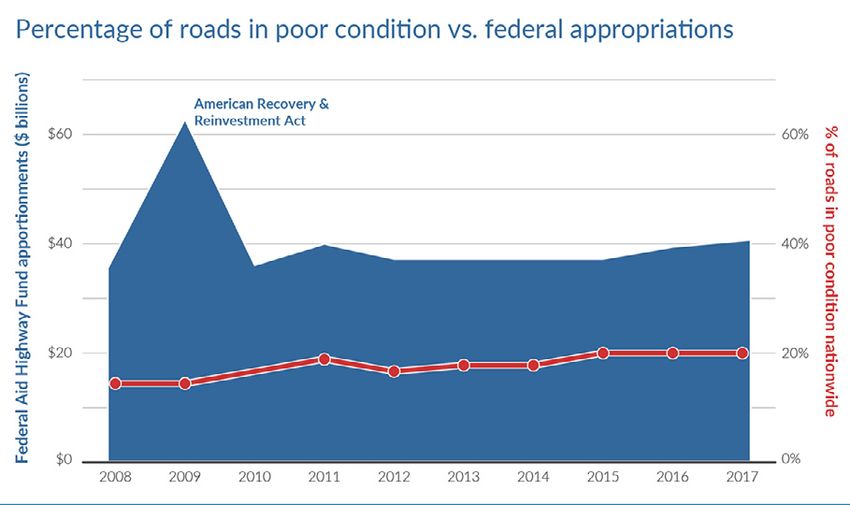
Learning from the 2009 Stimulus

shortfall of $28-38 billion annually to cover existing service.5 If a new stimulus provides funding only for
additional capital, expansions will come with operations costs that local economies will be unlikely to afford
as they emerge from a recession.

In addition to investing in transit expansions and improvements to create the most jobs, the next stimulus
must also continue the approach of the CARES Act to stabilize operations and help transit agencies avoid
layoffs, service cuts and fare increases. Our economic and social recovery relies on everyone reaching jobs
and necessities—including those not regularly using a car to get around. Millions will need transit service to
survive through the crisis, and we’ll need transit service for the economy to bounce back quickly afterward.
That requires operations funding.

            Lesson 3: When given total flexibility, states did not spend money on projects that
                                     create the most jobs, fastest

With states spending just 1.7 percent of their funds on transit, the category that produces the most jobs,
states clearly did not maximize the job creation possibilities of their ARRA funds. But even within their road
spending, states made decisions that failed to maximize job creation. A third of all flexible spending went to
the least effective category for creating jobs: new road construction.

On the positive side, eight states spent 100 percent of their road money on repair projects. Sixteen states
spent 90 percent or more on road repair. On the other hand, 11 states spent less than half of their ARRA
road money on repair projects.6 (See table on p.5)

  Lesson 4: When given total flexibility, many states did not spend money to repair crumbling roads

Even given the goal of creating jobs
quickly, it may be that states had
pressing road repair needs that required
spending on roads rather than transit.
But many did not prioritize repair,
choosing instead new construction,
despite the never-ending calls for more
infrastructure money to repair our
“crumbling roads and bridges.”

For example, 21 percent of New Mexico’s
lane miles were in “poor” condition when
ARRA was signed. Yet given flexible
funds, New Mexico spent the vast
majority of those funds on new roads,                              Graphic from Repair Priorities, Transportation for America, 2019.
rather than fixing its deteriorating system,
and eight years later, the percentage of roads in poor condition had grown to 31 percent.
5         “Estimated Financial Impact of COVID-19 on U.S. Transit Agencies: $26-$40 Billion Annually.” TransitCenter, retrieved on
April 1, 2020. https://transitcenter.org/estimated-financial-impact-of-covid-19-on-u-s-transit-agencies-26-38-billion-annually/
6         The eight states that spent 100 percent on repair were Connecticut, the District of Columbia, Maine, New Jersey, North Da-
kota, Rhode Island, South Dakota, and Vermont. All of the other state data in this paragraph can be found on page 9 of Recent Les-
sons from the Stimulus: Transportation Funding and Job Creation. Smart Growth America, February 2011. https://smartgrowthameri-
ca.org/resources/recent-lessons-from-the-stimulus-transportation-funding-and-job-creation/.

                                                                 4
Learning from the 2009 Stimulus
11 states spent less than half of their flexible ARRA money on repair
Percent of ARRA road Percent of roads in poor Percent of roads in poor
State
money spent on repair condition (2009) condition (2017)
Arizona 48% 8% 19%
Tennessee 46% 6% 5%
Virginia 46% 3% 10%
Hawaii 45% 38% 42%
New Mexico 45% 21% 31%
Louisiana 40% 25% 25%
Texas 27% 8% 11%
Kentucky 26% 2% 10%
Florida 23% 3% 8%
Arkansas 19% 18% 9%
Kansas 19% 9% 10%
Recommendation 3: Dedicate funding toward rebuilding crumbling infrastructure and hold states
accountable for doing it.
These projects create more jobs per dollar and will leave our country in better shape when we are done.
Every roadway repair project is also an opportunity to identify safety issues, particularly for our most
vulnerable users, and make improvements. Especially in more developed urban and suburban areas but
also in rural towns, roadways are often built for speed in contexts where speed is not only inappropriate, but
deadly. At a time when the number of people killed while walking and biking are skyrocketing, we need to
analyze whether roadways in areas surrounded by homes and businesses should be built for speed or for
safety.
A safety analysis should be part of every road repair project because to rebuild an unsafe environment is
irresponsible and callous. If the roadway is currently too unsafe for people to dare use it or where people are
currently being killed, it should be redesigned when it is rebuilt.
We’ll never be able to build a sustainable economic recovery without helping everyone get back on their feet.
Requiring every member of society to buy a car just to participate in the economy because they can’t safely
cross the streets near their home or job is a recipe for a slow recovery.
5Learning from the 2009 Stimulus
Lesson 5: Congress got stuck in old, irrelevant programs and rules
Decision making in an emergency is hard for everyone, including Congress. In an attempt to do things
quickly, Congress defaulted to existing programs or rules put in place decades ago that were not well tailored
to the tasks at hand.
One of those was choosing not to fund transit operations. This is in spite of the fact that it produces the most
jobs per dollar. By failing to make this investment, some agencies were forced to make cuts so deep that it
took them years to recover to pre-recession service levels. An entire bus system was eliminated in Atlanta’s
Clayton County. Millions were left stranded, delaying a full recovery. We also missed the chance to reimagine
how transit is delivered by redesigning and updating bus routes. Today we could use operations funding to
consider use of microtransit and other new technology that could make transit more efficient.
Another old rule that was needlessly followed was how the dollars were divided, with 80 percent going
toward roads, and 20 percent toward transit. But this division came from a 1982 political compromise over
the use of gas tax revenues—a user fee paid by drivers. Not a single dime of Recovery Act dollars
came from gas tax user fees. The bill’s full cost came from deficit spending paid for with general fund
revenues. Why honor an arbitrary split meant to govern specific user fees sourced from drivers if it was in
fact tax money sourced from all taxpayers, taken from the general fund? There may be reasons to fund both
highway and transit projects, but doing it just because that’s how we have divided up gas tax dollars for 40
years is not one of those reasons.
Congress did break with tradition in one way in ARRA by creating the TIGER program, now called BUILD.
This program was not based on dividing money by a predetermined formula, but by funding projects that
addressed federal priorities, including stimulating the economy and creating jobs. This program put a larger
portion of funding into transit and was able to fund multimodal projects and projects of regional and national
significance due to its flexibility.
Recommendation 4: Any future stimulus should abandon old habits that don’t apply, like the 80-
20 split that governs gas tax revenues. Congress should instead adopt “job creation and recovery”
as the primary goal and then fund programs that fulfill that priority.
6Learning from the 2009 Stimulus
Lesson 6: States did not spend money on public priorities
The project types proven to create the most jobs are also the priorities that would have risen to the top if
Congress solicited public input about where to direct the infrastructure spending. This was true in 2009-11,
and is true now.
A November 2019 national poll (both graphics on this page) found strong support for prioritizing repair
road projects before building new roads, with just 3 percent separating Democrats, Independents and
Republicans—and 61 percent supporting an outright moratorium on new roads for 10 years as a means of
reorienting toward repairing infrastructure.7
That same poll also found that voters from across the political spectrum and from urban, suburban, and rural
areas overwhelmingly believe more transit would benefit the country.
As the results in lessons 1-4 show, this is not how most states spent most ARRA funds.
Recommendation 5: As Congress chooses which types of spending to fund in any stimulus, it
should be guided by public desires for roads and transit in good repair, and more transportation
choices.
7 YouGov Blue survey of 1,029 U.S. voters from November 27, 2019 through November 29, 2019. Polling results released in
“Voters Want a Better Transit System for America,” by TransitCenter, Data for Progress, Transportation for America, the Ian L. McHarg
Center for Urbanism and Ecology, and the Socio-Spatial Climate Collaborative. http://t4america.org/maps-tools/the-green-new-deal-
for-transportation/
7Learning from the 2009 Stimulus
Recommendation 6: Institute better guidance and oversight to help accomplish our goals.
Transparency and oversight is the best way to ensure taxpayers get the promised results. Ten years ago,
states did not start spending their ARRA funds until the U.S. Department of Transportation (USDOT) started
ranking the speed of their spending. If Congress wants to produce results with transportation spending of
any kind, Congress should:
• Develop and reinforce guidance to states, MPOs, and transit operators that transportation funds are
widely flexible.
• Make job creation calculations a feature of any stimulus, and then consider making it a permanent
feature of the nation’s surface transportation program, consistent with the Secretary’s and the
administration’s commitment to performance-based investing.
Have USDOT and the modal administrations:
• Put out guidance for calculating jobs created per dollar.
• Collect and report jobs data on all projects funded with stimulus dollars to Congress and post online.
• Rank projects and states on jobs created per dollar, report to Congress and post online.
Conclusion
The CARES Act addressed enormous, immediate needs across the country by providing emergency support
for transit operations. When the time comes from Congress to move from emergency stabilization measures
to the next phase of stimulus, we can and should benefit from the lessons we learned from the last stimulus.
Some of the lessons are straightforward: some kinds of spending create more jobs, faster, than others.
Other lessons might not be as immediately obvious: limiting spending to capital only creates future costs, and
slows the speed of economic recovery.
Finally, we learned that to get the results we want and need, we should direct federal dollars to the types of
projects that create what we need. In the face of unprecedented unemployment, that means projects which:
• Create the most jobs, fastest.
• Connect people to as much economic opportunity as possible.
That means public transit—especially operations and repair—and road repair.
– –
8Connect with us
smartgrowthamerica.org
t4america.org
@smartgrowthusa
@t4americaYou can also read