LESS FORECLOSURES, MORE HOMEOWNERS? COLLATERAL REGIMES, NON-PERFORMING LOANS AND CREDIT CONDITIONS - CLAIRE LABONNE AND FERGAL MCCANN - FEDERAL ...
←
→
Page content transcription
If your browser does not render page correctly, please read the page content below

Supervisory Research and Analysis Unit

Working Paper | SRA 20-02 | June 22, 2020

Less Foreclosures, More Homeowners?
Collateral Regimes, Non-Performing
Loans and Credit Conditions
Claire Labonne and Fergal McCann
Supervisory Research and Analysis (SRA) Working Papers present
             economic, financial and policy-related research conducted by staff in the
             Federal Reserve Bank of Boston’s Supervisory Research and Analysis Unit.
             SRA Working Papers can be downloaded without charge at:
             http://www.bostonfed.org/publications/sra/

             The views expressed in this paper are those of the author and do not
             necessarily represent those of the Federal Reserve Bank of Boston or the
             Federal Reserve System.

© 2019 Federal Reserve Bank of Boston. All rights reserved.
Less Foreclosures, More Homeowners?
Collateral Regimes, Non-Performing Loans
and Credit Conditions
Claire Labonnea and Fergal McCannb∗
a b
Federal Reserve Bank of Boston; Central Bank of Ireland
June 22, 2020
Abstract
We show that legal shocks to the collateral value of debt contracts can spill over to
other debt portfolios and constrain new debt origination. Using a natural experiment in
the Irish mortgage market, we find that lenders responded to an unexpected repossession
ruling reducing the value of the collateral on their outstanding mortgages by restricting
riskier credit originations. The effect was even stronger when the decision was reversed:
when contract enforcement is improved, banks expand their credit risk appetite, and issue
loans with substantially weaker credit risk scores, higher loan to value ratios, and higher
probabilities of subsequent default or modification. Such cross-portfolio spillovers high-
light a trade-off between protecting existing homeowners and allowing new entrants on
the mortgage market.
Keywords: Law and Finance, Repossession, Credit Risk, Capital Channel.
JEL Classification: G30
∗
E-mail: fergal.mccann@centralbank.ie (corresponding author); claire.labonne@bos.frb.org. Phone: +353 1
2246893 (McCann). Address: Central Bank of Ireland, Spencer Dock, Dublin 1, Ireland. We thank Elisabeth
Beckmann, Terry O’Malley and participants at the April 2019 CES-IFO workshop on banking and institutions
(Munich), the 2019 AREUEA International Meeting and the 2019 IBEFA Summer Meeting for helpful com-
ments. The views presented in this paper are those of the authors alone and do not necessarily represent the
official views of the Central Bank of Ireland, the ESCB, the Federal Reserve Bank of Boston or other parts of
the Federal Reserve System. Any remaining errors are our own.
11 Introduction
In residential mortgage markets, the pledging of the underlying housing asset as collateral acts to
alleviate banks’ expected losses given default and relaxes credit conditions ex ante (Pence, 2006). The
ability to realize the housing collateral is therefore a key factor in determining banks’ risk appetite on
new lending.
In this paper, we document spillovers from debtor protections on outstanding mortgages to origi-
nations. We use a unique unexpected change in banks’ ability to enforce contracts in Ireland in 2011,
with financial intermediaries’ balance sheets serving as transmission channels that amplify the effects
of the legal shock, which acts similarly to a capital shock. As financial intermediaries cannot easily
offload or reprice their outstanding loans, they adjust their origination policies to manage credit risk.
Measuring the impact of legal institutions on credit access is challenging as they result from long
historical and political processes. To overcome this difficulty, we exploit a unique unexpected shock
to repossession. In July 2011 in Ireland, the court system identified a loophole in 2009 legislation that
meant that, with immediate effect, there was a moratorium on foreclosure for all mortgages issued in
Ireland before December 2009 (referred to as the “Dunne judgment”). O’Malley (2020) documents
a significant increase in defaults following this ruling, while loss given default also temporarily goes
to one hundred percent, weakening lenders’ balance sheets. To document spillovers from outstanding
loans to originations, we rely on a loan level data set covering two thirds of the Irish mortgage market
for the period 2010-2014. The data records conditions at origination, including borrowers’ character-
istics and updates loan characteristics every six months.
We estimate the spillovers of this legal shock using a difference-in-difference strategy. We build
on the strong presence of Republic of Ireland (ROI) banks in Northern Ireland (NI), where they serve
borrowers facing the repossession regime of the United Kingdom. We contrast loans from the Border
region of the Republic of Ireland (six counties along the border with Northern Ireland) with NI loans.
Both areas have similar economic structures and are part of a highly-integrated region with free move-
ment of goods, capital and labour. To further alleviate concerns that we could be capturing events
differently affecting both areas, we control for regional unemployment and house prices. We rule out
confounding factors on the bank supply side such as funding costs, business models and solvency by
sampling only banks lending on both sides of the border.
We start by investigating the “direct” adjustment of banks to valuations of already-outstandingloans. As they now bear a higher expected loss, lenders might be expected to charge higher rates on
affected loans, as highlighted in Cerqueiro et al. (2016) for a Swedish lender after a comparable shock
to collateral values. Our evidence suggests this lever was not used by Irish banks as a response to the
moratorium. First, banks had pricing discretion only over one type of loan contract, standard vari-
able rates (SVR) loans. For 52% of the outstanding ROI mortgages on banks’ balance sheets in July
2011, this adjustment is therefore impossible. Second, when applying our identification strategy to the
sample of SVR mortgages originated before December 2009, we find no evidence of rate adjustment fol-
lowing the moratorium. We hypothesize that banks may delay pricing adjustment in order to maintain
business volumes, or perhaps to avoid increasing the debt burden and probabilities of default, partic-
ularly given the presence of heightened moral hazard during the period as outlined by O’Malley (2020).
We then undertake to trace the effect of this shock onto originations. We investigate whether newly
originated loan risk characteristics change after the Dunne judgment on both sides of the border. Our
estimates suggest that banks respond to the moratorium on collateral repossession by reducing the
risk profile of their new lending in 2011. However, we find even stronger results when estimating the
effect of the removal of this moratorium: when contract enforcement is improved, banks expand their
credit risk appetite, and issue loans with substantially weaker credit risk scores, higher loan to value
ratios, and higher probabilities of subsequent default or modification.
Our results contribute to the literature on creditor protection and credit markets (Porta et al.,
1998; La Porta et al., 1997). Pence (2006) in the US, Fabbri and Padula (2004) and Jappelli et al.
(2005) in Italy, and Ponticelli and Alencar (2016) in Brazil demonstrate how high legal enforcement
costs hinder access to finance for households and firms. Degryse et al. (2019) highlights the underlying
mechanism works through creditor rights and debt enforcement procedures affecting expected recovery
rates. We document spillovers from loans for which a given legal framework is relevant to other loans
via the lender’s balance sheet they are jointly held on. We are able to give a causal interpretation of
this effect by analyzing a unique unexpected shock to a repossession regime.
Our paper also contributes to the growing literature on the importance of non-performing loans
(NPL) ratios on bank loan origination. Accornero et al. (2017) have recently shown using matched
bank-borrower Italian data that new loan growth is weaker for firms borrowing from banks experienc-
ing an increase in their NPL ratios as part of the ECB’s Comprehensive Assessment in 2013. Other
studies have shown that countries that actively reduce NPL ratios experience greater investment and
GDP growth than countries that allow NPLs to remain on banks’ balance sheets (Balgova et al., 2016)
and that banks with higher NPL ratios experience a higher cost of capital and market funding, and a
2subsequently lower level of liquidity and credit creation (Chiesa and Mansilla-Fernández, 2018). Be-
cause the moratorium we study generates non-performing loans while protecting homeowners, it is
preventing other households from access credit markets.
The paper proceeds as follows. Section 2 details the institutional framework, our identification
strategy and the data we run the analysis on. Section 3 lays out results on the pricing of outstanding
mortgages; Section 4 focuses on new lending. Section 5 concludes.
2 Data
2.1 The Dunne Judgment
The shock to collateral values we study originates from the late identification of a legal loophole. On
December 1st, 2009, the Irish Parliament passed the Land and Conveyancing Law Reform Act. This
Act repealed the 1964 Registration of Title Act, which regulated conveyancing matters crucial to the
mortgage market until then. While repealing the 1964 Act, the 2009 Act created a serious legal loop-
hole. Setting out the obligations, powers and rights of mortgages, the 2009 Act sets they apply to any
mortgage created by deed after the commencement of this Chapter. Loans originated before December
1st, 2009 are not regulated by this Act.
Figure 1: The Dunne Judgment and Affected Loans
Ms Justice Dunne identified the consequences for mortgage repossessions in Start Mortgages &
ors v. Gunn & ors [2011], the High Court Judgement she made on July 25th, 2011. Because loans
3originated before December 2009 were no longer regulated by the 2009 Land and Conveyancing Law
Reform Act, it was no longer obvious the banks could repossess registered land in case of default.
Her judgement establishes lenders have acquired the right to start repossession proceedings if two
conditions are met. First, the loan was in default before December 1st 2009. Second, the demand
for repayment was sent before December 1st 2009 as well. Practically, this judgment prevented banks
from repossessing any property acting as security against a loan issued before December 1st 2009.
Mid-2011, these loans represented approximately 95 per cent of the mortgage portfolios of Irish banks.
This ruling was highly unexpected. Preventing the repossession of pre-December 2009 loans was
never the intention of the legislator when passing the Land and Conveyancing Law Reform Act. At
that time, legislators thought the Interpretation Act of 2005 would allow repossessions to continue
as usual in spite of the repeal of relevant legal provisions (Mee, 2010). But as ruled by Ms Justice
Dunne, the Interpretation Act only provided continuity for loans defaulted and for which repossession
proceedings had started before December 2009.
This decision amounted to a shock to the value of loans already on the books of Irish lenders.
Mortgages are secured by the house they finance. Because repossessing the house securing mortgages
issued before December 2009 became impossible, the risk on this portfolio went up significantly. First,
mortgage lending was rendered unsecured overnight and the loss given default increased to 100 percent.
Further, the ruling introduced substantial moral hazard risks: O’Malley (2020) computes the effect of
the judgment on the probability of default of Irish mortgages. Using a difference-in-difference estima-
tor comparing loans issued either side of the 2009 cut-off, and observing their repayment behaviour
either side of the judgment, he shows that loans subject to the foreclosure moratorium had a 40 to 60
per cent increase in their quarterly default rate, relative to the counterfactual.
Closing the lacuna was an important part of resolving the Irish arrears crisis. In December 2012,
Irish policymakers committed to introduce a new law by March 2013, to enable the repossession of
mortgages originated before December 1st 2009 (IMF, 2012). The Land and Conveyancing Law Act
was adopted on July 24th 2013. Its objective is ”to provide that certain statutory provisions apply to
mortgages of a particular class notwithstanding the repeal and amendment of those statutory provisions
by the Land and Conveyancing Law Reform Act 2009”. The adoption of the Act in July 2013 is when
the probability of default and loss given default were reduced for the vast majority of loans outstanding
on Irish banks’ balance sheets.
As the probability of default and loss given default significantly increased when the lacuna was
4discovered, they decreased when it was closed. We can analyze two changes to a legal repossession
regime and how lenders adjusted to them: the Dunne judgment in July 2011 and the Land and
Conveyancing Act in July 2013. We refer to the period between these two events (July 2011 - July
2013) as the repossession freeze, or moratorium, period. We define a pre-moratorium period from
January 2010 to 23 July 2011, and a post-moratorium period from 25 July 2013 to December 2014.
2.2 Empirical Strategy
We want to assess how lenders adjust to these shocks to the repossession regime, through rates charged
on loans on books as well as the characteristics of originations. Because the shocks are system-wide,
we cannot directly compare rates or characteristics just before and just after the shocks. We would be
capturing any other macroeconomic shock affecting the Republic of Ireland economy at the time.
But Republic of Ireland lenders do not serve only households in their jurisdiction. There has
been a long tradition of Irish banks lending directly in the UK which pre-dates Irish independence
and continued thereafter (McGowan, 1988). This is particularly strong in Northern Ireland with large
subsidiaries of Irish banks continuing to operate North of the border. Presently, two main banking
groups in Ireland (Bank of Ireland and AIB) have considerable ongoing activities in the UK market.
Bank of Ireland have a particularly large presence in the UK. Their acquisition of Bristol and West
Building Society in the 1990’s gave them a foothold in the market and, currently, they lend directly
as Bank of Ireland UK but also provide savings and loans products through their strategic alliance
with the UK Post Office. Using data from their Annual Report1 , as of Q4 2016, the total stock of
UK mortgage loans outstanding for Bank of Ireland was valued at e23.8bn which is only marginally
smaller than their Irish portfolio with e24.4bn outstanding. In fact in the year to end 2016, the value
of new mortgage lending was nearly two times larger in the UK at e2.8bn as compared to e1.4bn in
ROI. AIB’s UK presence is more regionally focused with a majority of activity being worked through
First Trust, its wholly owned subsidiary in Northern Ireland. They also lend through AIB UK Group
directly into the UK market. In total, AIB held e1.5bn worth of UK mortgages outstanding.
Thanks to the strong presence of Irish lenders in the United Kingdom, we are able to build a
control group to analyze the effect of the shocks to the repossession regime. Loans originated in the
UK and the Republic of Ireland face similar repossession regimes as they share a common legal origin
(DJE, 2013) but the Dunne Judgement only applies to Republic of Ireland loans.
1
https://investorrelations.bankofireland.com/app/uploads/BOI-Annual-Report-2016.pdf
5Our control group only includes Northern Ireland loans. During our estimation period, the physical
border between the ROI and UK on the island of Ireland was in effect non-existent.2 As a within-
European Union border, goods, services and people could travel freely across the border, with goods
and labour markets highly integrated across the two regions.
To ensure comparability with Northern Ireland, our treatment group zooms in on the Border region
of the Republic of Ireland (counties Cavan, Donegal, Leitrim, Louth, Monaghan and Sligo, see Figure
2). Table 2 shows that the industrial structure of the two regions is remarkably similar. The only
noticeable difference is the relatively greater importance of agricultural employment in the ROI Border
region and of administrative and support service activities in Northern Ireland. This is primarily due
to the fact that Northern Ireland includes Belfast, an administrative center and the second-largest city
on the island of Ireland, whereas the ROI Border region does not include a large urban center.
Figure 3 displays the evolution of house prices and unemployment in the ROI, ROI Border region
and NI. For both these variables, the level difference between outcomes in ROI and NI during the
period is worth noting. This is because the period under study incorporates the peak of the Irish
financial crisis and beginnings of the subsequent recovery. The Irish banking system during the period
was also undergoing the “Financial Measures Program”, a program of supervision and restructuring
involving the European Commission, European Central Bank and International Monetary Fund, as
part of the overall program of financial support to the Irish state during the crisis.
Despite these important level differences across the series, it is notable the evolution of the series
over time, particularly between 2010 and 2014, is similar across the regions. All of these facts support
the usage of Northern Ireland as a useful control group when thinking about the evolution of risk-
taking either side of a legal system shock by Irish banks in the ROI.
The main difference between the Republic of Ireland and Northern Ireland we have to adjust for is
the currency. The Republic of Ireland uses the Euro while Northern Ireland is a Pound Sterling area.
For this reason, the Euro-Sterling exchange rate may influence credit allocation decisions either side
of the border. In our setting, these differences in exchange rates will be collinear with time dummies
included in all empirical specifications.
2
The 1998 “Good Friday Agreement”, which brought about a cessation of conflict and the creation of
regional power-sharing institutions in Northern Ireland, led to the complete elimination of waiting times and
check-points along the border.
62.3 Loan-level Data
We use data from the Central Bank of Ireland’s mortgage Loan Level Data (LLD). The LLD were
first collected in March 2011 as part of the Prudential Capital Assessment Review (PCAR) assessment
of bank solvency which ultimately resulted in State financial support being provided to six domes-
tic Irish banks in the guise of the Financial Measures Programme (FMP). Of these six banks, four
remained as going concerns at the end of the FMP: Allied Irish Banks (AIB), EBS, Bank of Ireland
(BOI) and Permanent TSB (PTSB), with EBS being subsumed into the AIB group as part of the FMP.
Information on each loan outstanding at December 2010 at the subject banks was provided as part
of PCAR. After the PCAR process, an additional dataset was provided pertaining to the December
2011 profile of all outstanding loans at the subject banks, with twelve months of arrears history to
December 2010 provided. After December 2011, the Central Bank has received LLD every six months
from these banks, with the most recent dataset usable at the time of writing relating to December
2019. During our estimation window, we focus on the lending of AIB-EBS, BOI and PTSB, which
together accounts for around two thirds of the Republic of Ireland mortgage market during the period.
Monthly information on loan performance is complemented by time-varying information which is
updated every six months on items such as a loan’s current outstanding balance, interest rate, inter-
est rate type, payment type, modification status, loan to value ratio (LTV) and loan maturity date.
Furthermore, a wide range of time-invariant fields are also observable in the data, for example First
Time Buyer status, Buy to Let status, drawn balance at origination, originating borrower income,
originating LTV, borrower and collateral location, date of origination. As Irish banks also serve UK
customers, we are able to observe Northern Ireland loans using the same data source.
3 Outstanding Loans
We study how lenders adjust to the repossession freeze and its lifting on their stock of loans. One
could expect that, as in Cerqueiro et al. (2016), banks respond to the moratorium by increasing rates
for the now riskier loans.
In both the ROI and the UK, Irish banks predominantly issue three types of mortgage: (i) a
mortgage with an initial fixed-rate period (often 1, 2, 3, or 5 years); (ii) Tracker mortgages, where
the loan rate follows a base policy rate with a fixed margin; (iii) a “Standard Variable Rate” (SVR)
7mortgage, a floating rate loan without indexation, i.e. the lender has discretion over when the inter-
est rate changes. Lenders can adjust rates on SVRs only. Even if they are the predominant type of
outstanding mortgages, they hardly represent about half of the total portfolio (47 per cent of ROI
mortgages outstanding and 38 per cent of UK mortgages in our sample as of December 2012). The
second-most popular mortgage product in our data is the Tracker mortgage, which accounted for 41
per cent of ROI mortgages and 45 per cent of UK mortgages at the same time. The remaining 11 and
16 per cent of ROI and UK loans, respectively, were on fixed interest rates at the time.
In this section, we study rates adjustments on the sample of SVR mortgages only. We test two
hypotheses: (i) banks respond to the ROI moratorium in July 2011 by increasing the interest rate
charged on outstanding floating-rate loans (H1O ) ; (ii) banks respond to lifting of the ROI moratorium
in July 2013 by reducing the interest rate charged on outstanding floating-rate loans (H2O ).
3.1 Specification
We compare interest rates across ROI and NI loans before and after the shock in a difference-in-
difference setting. We estimate β in
rit = αi + βM oratoriumOn + γROI + δP ost + λb + Xit + it (1)
rit is the interest rate charged to borrower i in quarter t. M oratoriumOn is an indicator for the
moratorium to be active. Our observation window is the year 2011. M oratoriumOn takes a zero in all
four quarters for Northern Ireland loans, and switches from zero to one for ROI loans in the third and
fourth quarters of 2011. We also include a dummy for being in the treated jurisdiction (ROI) and in
the post period (P ost).
Rates charged to borrowers depend on an array of factors on top of the relevant judicial framework.
The origination date and borrowers characteristics (whether a first time buyer, their income...) can also
drive rates adjustments. Because we repeatedly observe all loans on balance sheets and the rates they
are charged, we can control of all such time-invariant characteristics by including a loan fixed effect, αi .
We further control for shocks that could affect the Border region and Northern Ireland asymmet-
rically. House prices are highly relevant to the valuation of mortgages, as a driver of the loss given
default. And the unemployment rate is highly relevant to the probability of default for this product.
To avoid capturing area specific trends in both these variables, we add them as regressors at a region-
quarter level (Xit ).
8The magnitude of a lender’s adjustment depends on its available buffers. A poorly capitalized
bank might be more likely to adjust rates upward when loans become riskier. To the contrary, a well
capitalized one might choose not to pass-through the shock to protect its clientele. We include bank
fixed effects (λb ) to compare loans within a single bank, hence facing the exact same trade-offs when
deciding on the adjustment.
We use a symmetric set-up to assess the impact of the end of the moratorium (H2O ). We observe
rates charged for the year 2013. M oratoriumOf f replaces M oratoriumOn and is equal to 1 for ROI
loans in the third and fourth quarter. P ost is set to one in the second half of 2013.
Our sample for all regressions is limited to SVR loans originated before December 1st, 2009 that
are present in the data in all twelve quarters in the years 2011-2013. This is to avoid attrition bias
when comparing the introduction and the lifting of the moratorium. This leads to a balanced panel
with 25,971 ROI Border and 6,425 Northern Ireland loans each quarter.
3.2 Results
Table 3 lays out results for the introduction of the repossession freeze. We find no evidence that
rates charged on mortgages already on books were raised more in the Border region of the Republic
of Ireland than in Northern Ireland following the repossession freeze. In column (1), Irish loans are
shown to have an interest rate that is 107 basis points higher than UK loans on average throughout
the sample, without any change in the slope after June 2011.
One might be worried that we fail to find evidence of a pass-through of heightened risk because we
are comparing two jurisdictions. Banks have a home bias and might wish to favor domestic borrowers
over foreign ones.3 If competition is not too stringent, they might smooth out the shock by charging
higher rates to both Republic of Ireland and Northern Ireland customers. In that case, our identifica-
tion strategy will fail to pick up the pass-through as it focuses on the difference between rates across
the regions. To alleviate these concerns, we use a triple difference strategy. We further contrast loans
originated before and after the December 1st, 2009 cut-off, à la O’Malley (2020). We are now focusing
on rates for loans originated before December 1st, 2009 in the Republic of Ireland and how they differ
from rates charged for loans on the other side of either the cut-off date or the border. Again, we do not
3
While there is a long literature on home bias in banking, McCann and O’Toole (2019) show that risk-taking
abroad does increase moderately in response to macroprudential lending restrictions at home, looking at Irish
banks’ UK lending relative to lending by local competitors.
9find any significant difference (column (2)). In this setting, we document a 124 basis point differential
between Irish and UK loans, and a 32 basis point differential for loans originated before December
2009, but no evidence of any change in loan pricing as a response to the moratorium.
We interpret this absence of pass-through as a consequence of the impossibility to repossess. If
the lender raises rates, she increases the borrower’s debt burden hence his probability of default. In
a set-up with no repossession backstop where default is unconditionally more likely (O’Malley, 2020),
raising rates would not help contain risk on the portfolio.
We look into lenders’ adjustment to the symmetric shock - the lifting of the moratorium in July
2013 - in Table 4. As lenders maintained rates when risk went up, they are not adjusting them back
down. We find a non-significant impact of the lifting of the repossession freeze when using our main
difference-in-difference specification (column 1) or the triple difference approach (column 2). The loan
pricing margin of adjustment is not part of Irish banks’ reactions to either the introduction of removal
of the repossession moratorium.
4 New Lending
As lenders do not pass through the additional risk on outstanding loans to these very loans, we inves-
tigate if their adjustment strategies involves other portfolios. Within banks, risk is often managed at
the line of business level. The mortgage portfolio manager targets a level of risk and makes necessary
adjustments to remain within the boundaries agreed upon at the Board level. If the risk of loans
already on books turns out bigger than expected, originations are an easy lever to activate. Lowering
additional risk taking from newly originated loans helps keeping portfolio risk under control. This is
especially relevant for Irish lenders, who “originate and hold”.4
In this section, we study the pass-through of the repossession freeze shock to credit conditions
for originations. We test two hypotheses: (i) banks respond to the ROI moratorium in July 2011 by
reducing the risk profile of new lending (H1N ) ; (ii) banks respond to the lifting of the ROI moratorium
in July 2013 by loosening the risk profile of new lending (H2N ).
4
Off-balance sheet securitization has historically not been a prominent feature of Irish mortgage lending.
In certain cases since the crisis, banks have utilized securitization to transfer Non-Performing Loans risk off
their balance sheets. However, newly-issued loans are rarely if ever securitized with risk transfer.
104.1 Specification
We compare credit conditions for loans newly originated around the repossession freeze announcement
and its lifting across the Republic of Ireland Border region and Northern Ireland. Over the 2010-2014
period, aggregate levels of originations follow a similar pattern across the two regions (Figures 4 and
5). We estimate β in
Yi = α + βM oratoriumOn + γROI + δP ost + Xi + Ri + λt + λb + λLG + i (2)
Yi is a measure of credit conditions. We proxy credit conditions by loan characteristics at origi-
nation. We use the internal credit score at origination, summarizing all relevant borrower information
available to the lender. We include bank fixed effects (λb ) to get around cross bank score comparison
issues.5 Alternatively, we use the origination loan-to-value. This is an important parameter as it drove
differential pricing on floating rate loans.6 We also leverage ex-post measures of risk and create an
indicator of subsequent trouble, set to one if the loan experiences default or is modified.
As in the previous section, M oratoriumOn is an indicator for the moratorium to be active, γROI
and P ost are dummies for being in the treated jurisdiction and in the post period, respectively. Since
credit conditions can change with the macroeconomic environment, we include a set of time fixed
effects (λt ) and control for regional unemployment.
We only observe the origination characteristics of mortgages once in our pooled cross-section of
new mortgages. To plausibly purge estimates of β of unobserved heterogeneity, we follow Auer and
Ongena (2016), and create loan groups λLG . Degryse et al. (2018) shows such a strategy performs a
similar function to a more fully-saturated set of demand controls using multi-bank, multi-firm data
à la Khwaja and Mian (2008). We work with 142 loan groups, the combination of First Time Buyer
v. Second Purchase, Property Type (3 types), Borrower Age (3 groups), Fixed v. Variable, Single v.
Joint Mortgage, Within-Country-Year house price quintiles. These “loan group fixed effects” saturate
the model of any credit demand that is common to borrowers, on either side of the ROI-UK border,
that share the set of common characteristics laid out above.
There is potential for borrowers to sort either side of the beginning and end point of the morato-
5
Due to the lack of an exhaustive credit registry in Ireland at the time underwriting on the basis of external
credit scores such as FICO was non-existent.
6
Gupta and Hansman (2019) have shown there is a relationship between strong positive relationship between
origination LTV and subsequent default, with 40 per cent of the effect resulting from leverage itself, and the
other 60 per cent resulting from adverse selection of riskier borrowers at higher OLTVs.
11rium as a response to the shock. If such sorting existed and was not adequately controlled for, it would
present issues for our identification. To address the possibility that substantial shifts in composition
may drive our results, we split our sample into six groups: pre-moratorium, during moratorium and
post-moratorium, either side of the border. We document the share of First Time Buyers, detached
houses, fixed-rate mortgages and single borrowers, along with average borrower age (Table 1). While
there are some differences across time periods within each country, broadly there is a reasonably stable
sample. We are comfortable using our “loan group fixed effects” as demand-side controls knowing
one particular group is unlikely to be highly over or under-represented either side of our cut-offs for
identification.
We perform a symmetric analysis around the removal of the repossession freeze to test whether
credit conditions were adjusted then (H2N ).
4.2 Results
Table 5 give results for the internal credit score at origination. Columns (1) and (2) consider the entire
period 2010 to 2014, where the periods in which M oratorium is equal to zero straddle either side
of the July 2011- July 2013 period, when the moratorium was active. When considering this whole
period, we cannot find any effect of the presence of the moratorium on the risk profile of new loans
(column 1). Results are similar when further controlling for regional unemployment (column 2).
In columns 3 and 4 we focus solely on the introduction of the moratorium and restrict the sample
to January 2010 to July 2013 . We expect that, upon the introduction of the moratorium, Irish banks
would tighten their credit standards disproportionately in Ireland relative to the UK. Again, in both
cases (with and without a time-varying control for regional unemployment), we find no significant
coefficient on M oratoriumOn .
Finally, when focusing on the closing of the loophole in July 2013, using a sample of loans orig-
inated between July 2011 and end-2015, we find a significant adjustment. The average credit score
decreases by 7-8 points following the lifting of the moratorium, a magnitude of one fifth of a standard
deviation. This result is robust across columns 5 and 6 to controlling for regional unemployment.
The interpretation of the finding is in line with H2N : when the legal loophole was closed, Irish banks
provided credit to increasingly riskier borrowers, as per their own internal credit scoring assessment.
Table 6 measures credit conditions using the origination LTV. Consistently with the results using
12internal credit scores, when considering the whole period (columns 1 and 2) or the period around which
the moratorium is put into effect (columns 3 and 4), we cannot find any effect. But using this other
risk measure, we confirm previous results for the period around July 2013. Irish banks granted loans to
borrowers with higher LTV once the Dunne judgment loophole was closed. The effect is non-negligible,
with loans in the Border region of ROI increasing by 5.8 to 8 points more than the counterfactual loan
in NI (relative to a standard deviation of 25 and a mean of 67 across the sample). This again suggests
some credit loosening on new loans once the legal uncertainty created by the moratorium is removed
from law.
Lenders might consider information other than the credit score and the OLTV when originating
these loans, which could bias our estimates. But this information would be revealed by ex-post risk
measures. In Table 7 our dependent variable takes a one if the loan experienced modification or default
at any point from origination until the end of 2016. We are no longer comparing expected but realized
risk, which takes us one step closer to lenders’ risk appetite.
In Columns (1) and (2), we now find supporting evidence that, relative to the period where there
is no moratorium, subsequent “troubled rate” on new loan issuance is 4.9 to 5.8 points lower for loans
issued during the moratorium, suggestive of less risk-taking by banks on their ROI loans. Looking
specifically at the initial shock, M oratoriumOn , we estimate that this negative shock to the value
of existing loans lowered the subsequent “trouble rate” by 3 to 3.5 percentage points. The previous
conclusion of increased risk-taking after the closing of the loophole is confirmed here also (columns 5
and 6): the subsequent default rate is 8.4 to 8.5 percentage points higher on ROI loans issued once
the moratorium is lifted.
These are all large effects, given that the rate of subsequent trouble across our entire estima-
tion sample is 7 per cent. The doubling of the coefficient on M oratoriumOf f , when compared to
M oratoriumOn , in Table 7, combined with the findings of Tables 5 and 6, all suggests some asymme-
try: according to our models, banks’ risk taking is more responsive on the upside to the removal of the
moratorium in 2013 than on the downside as a response to the initiation of the moratorium in 2011.
This may possible reflect time delays in processing news and implications of the judgment in 2011; by
2013, market participants may have been more familiar with the existence of the moratorium and had
prior information on the passage of its removal through the courts system.
One noteworthy pattern is the seemingly stronger and more often statistically significant effect of
M oratoriumOf f relative to M oratoriumOn . This relative finding may suggest that banks are sluggish
to respond to short-run, unexpected changes to the lending environment. The decision to alter credit
policy may not have occurred in the immediate days following the judgment, and the transfer of
decision-making may not immediately filter throughout the network of bank lending officers. By
13contrast, it is plausible that there was more information available in the run-up to the removal of the
moratorium in 2013 which would have allowed banks to be more prepared to loosen lending criteria.
5 Conclusion
Legal frameworks are highly relevant to credit markets development. In this paper, we show that
changes to repossession frameworks can spill over to contracts they are irrelevant for. This is because
different debt contracts are held on a same balance sheet that acts as a transmission channel. Lenders
can adjust to a legal change on part of their portfolio by changing credit conditions on another. We
are able to give a causal interpretation of the effect as we analyze a rare unexpected shock to a legal
framework. We exploit an exogenous shock to the ability of Irish banks to repossess collateral on home
mortgages in the Republic of Ireland in 2011. We benefit from the existence of lending on both sides
of the Ireland - United Kingdom border by the same lending institutions to construct a counterfactual
group of loans not subject to the 2011 shock.
We find banks respond to the moratorium on collateral repossession by reducing the risk profile of
their new lending in 2011. And we find even stronger results when estimating the effect of the removal
of this moratorium: when contract enforcement is improved, banks expand their credit risk appetite,
and issue loans with substantially higher credit risk scores, loan to value ratios, and probabilities of
subsequent default or modification.
Our paper also offers valuable lessons for the current European debates on Non-Performing Loan
resolution. Vı́tor Constâncio, the then Vice-President of the European Central Bank, stated that “if
the entire amount of capital currently tied up by NPLs is used to support new lending, total credit
volume in the euro area may increase, in the most optimistic variant, by about 2.5% and up to 6%
in the group of 6 countries with higher NPLs” (Constâncio, 2017). We show there is indeed a direct
link between NPLs and new credit provision: when the value of banks’ capital suffers a negative shock
through the NPL channel, they adopt more conservative lending policies.
A further implication of our finding is that a debtor-friendly legal and institutional environment
comes with costs: where banks have difficulty in enforcing contracts, prospective borrowers attempting
to enter the housing market may suffer from the tightening of origination credit conditions. The
Dunne Judgment itself was not a policy measure aimed at protecting homeownership. Rather, it
was a technical legal judgment that had identical effects to deliberate debtor-friendly policies such as
foreclosure moratoria. Policies that may at first glance appear desirable from the point of view of
14protecting homeownership may have negative spillovers to those who would otherwise use a mortgage
to become homeowners.
15References
Accornero, Matteo, Piergiorgio Alessandri, Luisa Carpinelli, and Alberto Maria Sor-
rentino, “Non-performing loans and the supply of bank credit: evidence from Italy,” Questioni di
Economia e Finanza (Occasional Papers) 374, Bank of Italy, Economic Research and International
Relations Area March 2017.
Auer, Raphael and Steven Ongena, “The countercyclical capital buffer and the composition of
bank lending,” BIS Working Papers 593, Bank for International Settlements December 2016.
Balgova, Maria, Michel Nies, and Alexander Plekhanov, “ The economic impact of reducing
non-performing loans,” Working Paper 193, European Bank for Reconstruction and Development
October 2016.
Cerqueiro, Geraldo, Steven Ongena, and Kasper Roszbach, “Collateralization, Bank Loan
Rates, and Monitoring,” The Journal of Finance, 2016, 71 (3), 1295–1322.
Chiesa, Gabriella and José Manuel Mansilla-Fernández, “Non-Performing Loans, Cost of Cap-
ital, and Lending Supply: Lessons from the Eurozone Banking Crisis,” Departmental Working
Papers 2018-05, Department of Economics, Management and Quantitative Methods at Università
degli Studi di Milano June 2018.
Constâncio, Vı́tor, “Resolving Europe’s NPL burden: challenges and benefits,” 02 2017. Keynote
speech by Vı́tor Constâncio, Vice-President of the ECB, at an event entitled ”Tackling Europe’s
non-performing loans crisis: restructuring debt, reviving growth” organised by Bruegel, Brussels, 3
February 2017 [Accessed: 2020 02 21].
Degryse, Hans, Olivier De Jonghe, Sanja Jakovljevic, Klaas Mulier, and Glenn Schepens,
“Identifying credit supply shocks with bank-firm data: methods and applications,” Working Paper
Research 347, National Bank of Belgium October 2018.
, Vasso Ioannidou, Jose Maria Liberti, and Jason Sturgess, “How Do Laws and Institutions
Affect Recovery Rates for Collateral?,” The Review of Corporate Finance Studies, 12 2019, 9 (1),
1–43.
DJE, “Report of the Expert Group on Repossessions,” Technical Report, Department of Justice and
Equality 2013.
Fabbri, Daniela and Mario Padula, “Does poor legal enforcement make households credit-
constrained?,” Journal of Banking and Finance, 2004, 28 (10), 2369 – 2397.
16Gupta, Arpit and Christopher Hansman, “Selection, Leverage, and Default in the Mortgage
Market,” Technical Report, Available at SSRN: https://ssrn.com/abstract=3315896 2019.
IMF, “Ireland: Eighth Review under the Extended Arrangement,” Technical Report 12/336, Interna-
tional Monetary Fund December 2012.
Jappelli, Tullio, Marco Pagano, and Magda Bianco, “Courts and Banks: Effects of Judicial
Enforcement on Credit Markets,” Journal of Money, Credit and Banking, 2005, 37 (2), 223–244.
Khwaja, Asim Ijaz and Atif Mian, “Tracing the Impact of Bank Liquidity Shocks: Evidence from
an Emerging Market,” American Economic Review, September 2008, 98 (4), 1413–1442.
McCann, Fergal and Conor O’Toole, “Cross-Border Macroprudential Policy Spillovers and Bank
Risk-Taking,” International Journal of Central Banking, October 2019, 15 (4), 267–311.
McGowan, Padraig, “Money and Banking in Ireland: Origins, Development and Future,” Journal
of the Statistical and Social Inquiry Society of Ireland, 1988, XXVI (I).
Mee, John, “Mortgages, Repeals and the Land and Conveyancing Law Reform Act 2009,” Commercial
Law Practitioner, 2010, 17.
O’Malley, Terry, “The Impact of Repossession Risk on Mortgage Default,” Journal of Finance, 2020.
Pence, Karen M., “Foreclosing on Opportunity: State Laws and Mortgage Credit,” The Review of
Economics and Statistics, 2006, 88 (1), 177–182.
Ponticelli, Jacopo and Leonardo S. Alencar, “Court Enforcement, Bank Loans, and Firm In-
vestment: Evidence from a Bankruptcy Reform in Brazil *,” The Quarterly Journal of Economics,
2016, 131 (3), 1365–1413.
Porta, Rafael La, Florencio Lopez de Silanes, Andrei Shleifer, and Robert Vishny, “Legal
Determinants of External Finance,” Journal of Finance, 1997, 52 (3), 1131–50.
Porta, Rafael La, Florencio Lopez de Silanes, Andrei Shleifer, and Robert W. Vishny,
“Law and Finance,” Journal of Political Economy, December 1998, 106 (6), 1113–1155.
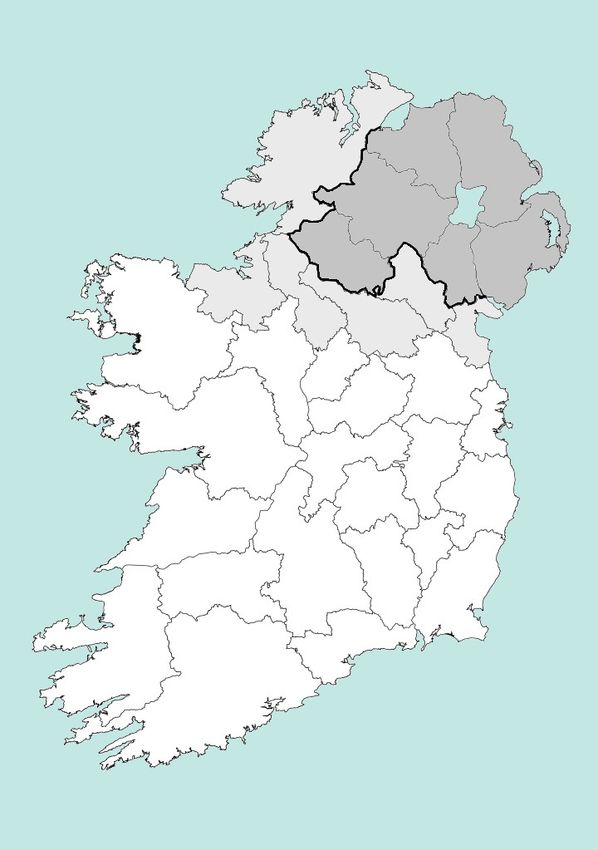
17Figure 2: Map of Ireland
Note: The thick black line materializes the border between the Republic of Ireland and Northern Ireland
(in dark gray). Counties in light gray are bordering counties from the Republic of Ireland: Cavan, Donegal,
Leitrim, Louth, Monaghan and Sligo. The Border Region spans 12,156 km2, 17.3% of the total area of the
Republic of Ireland and has a population in excess of 432,500. Northern Ireland spans 14,130 km2 and its
population was 1.8 million in 2011 according to the UK census. Note that in 2016, after our estimation window
is closed, Louth was removed from the Border region of the Republic of Ireland as part of an administrative
review.
18Table 1: Sample composition before, during and after the moratorium, across
ROI and Northern Ireland lending
FTB Detached House Borrower Age Fixed Mortgage Single Borrower
Panel A. Republic of Ireland
Pre 55.8% 50.6% 35.36 23.5% 44.4%
During 65.8% 68.2% 34.58 17.9% 43.0%
Post 57.5% 48.3% 36.33 28.2% 38.5%
Panel B. Northern Ireland
Pre 32.9% 29.1% 38.60 15.1% 29.6%
During 33.8% 30.8% 38.66 49.3% 30.3%
Post 31.8% 17.0% 39.46 77.3% 30.3%
Note: This table reports summary statistics. We report the share of first time buyers (FTB), the share of
detached houses, the average age of the borrower, the share of fixed mortgages and the share of single borrowers.
Panel A reports these data for the Republic of Ireland subsample. Panel B reports these data for the Northern
Ireland sample. For each panel, we provide values for before (January 2010 - 24 July 2011), during (25 July
2011 - 24 July 2013) and after (25 July 2013 - December 2014) the moratorium.
Table 2: Employment Shares in Northern Ireland and the ROI Border region,
2015
Sector NI Border
Agriculture, forestry and fishing (A) 4% 11%
Industry (B to E) 12% 14%
Construction (F) 6% 7%
Wholesale and retail trade, repair of motor vehicles and motorcycles (G) 16% 14%
Transportation and storage (H) 4% 4%
Accommodation and food service activities (I) 6% 7%
Information, Financial, Real Estate (J, K, L) 6% 4%
Professional, scientific and technical activities (M) 4% 4%
Administrative and support service activities (N) 7% 2%
Public administration and defence, compulsory social security (O) 6% 5%
Education (P) 9% 8%
Human health and social work activities (Q) 15% 14%
Other NACE activities (R to U) 5% 5%
Source: Office of National Statistics, Central Statistics Office, Authors’ calculations
19Figure 3: House Prices Indices and Unemployment Rates in Northern Ireland,
the Republic of Ireland and its Border Region.
(a) House Prices. (b) Unemployment Rates.
Source: Office for National Statistics for UK unemployment, Nationwide for UK house prices and Central
Statistics Office for both RoI house prices and RoI unemployment.
Note: The house price index for the Border region is for houses only. House price indices for Northern
Ireland and the Republic of Ireland are for all home types (houses and apartments).
Figure 4: New lending across the border, 2010 to 2014.
Quarterly loan origination
Sample includes Northern Irish and ROI border loans only
500
Number of loans per quarter
200 300
100 400
2010q1 2011q1 2012q1 2013q1 2014q1 2015q1
Quarter of origination
ROI UK
20Figure 5: New lending across the border (loan balances), 2010 to 2014.
Quarterly loan origination - balances
Sample includes Northern Irish and ROI border loans only
80
Million euros originated per quarter
20 40
0 60
2010q1 2011q1 2012q1 2013q1 2014q1 2015q1
Quarter of origination
ROI UK
21Table 3: Interest Rates around the Introduction of the Repossession Freeze (2011)
DiD Triple Diff
Post 2011 Q2 -0.0000871 -0.000252
-0.00625 -0.0399
Ireland 1.073∗∗∗ 1.237∗∗∗
-0.00557 -0.0294
Treatment Effect -0.000295
-0.00638
Originated Pre Dec 2009 0.321∗∗∗
-0.0285
Treatment Effect -0.00342
-0.0414
Originated Pre Dec 2009, Post 6.65E-11
-0.0403
Originated Pre Dec 2009, Irish -0.172∗∗∗
-0.0296
Triple Difference 0.00315
-0.0419
Constant 2.202∗∗∗ 1.907∗∗∗
-0.00653 -0.0286
Observations 130451 138170
R2 0.79 0.778
Note: The sample includes standard variable rate mortgages observable in all 12 quarters 2011 to 2013 and
issued in the Border region of the Republic of Ireland and in Northern Ireland. Our observation period is
the year 2011. The dependent variable is the interest rate charged on these loans every quarter. We compare
rates charged to mortgages collateralized by homes in the Border region of the Republic of Ireland, before and
after the introduction of a moratorium on repossessions in July 2011, using mortgages collateralized by homes
in Northern Ireland, with a constant repossession framework over the period, as a control group. In column
(1), we include only loans issued before December 1st, 2009, that is loans to which the repossession freeze is
relevant. Post 2011 Q2 is a dummy for quarters 2011Q3 and 2011Q4. Ireland is a dummy for the loan being
originated in the Border region of the Republic of Ireland. Treatment effect is the interaction of Post 2011
Q2 and Ireland. In column (2), we include loans originated on both sides of the December 1st, 2009 cut-off
to conduct a triple-difference strategy. We compare rates charged on loans originated in the Border region
of the Republic of Ireland before December 1st, 2009, before and after the introduction of a moratorium on
repossessions in July 2011, using loans originated on the other side of the border or the cut-off as a control
group. Originated Pre Dec 2009 is a dummy for the loan being originated before December 2009. Originated
Pre Dec 2009, Post is the interaction of Originated Pre Dec 2009 and Post 2011 Q2. Originated Pre Dec
2009, Irish is the interaction of Originated Pre Dec 2009 and Ireland. Triple Difference is the interaction of
Originated Pre Dec 2009, Ireland and Post 2011 Q2. Regressions include bank dummies, the regional rate of
unemployment and regional house prices. Standard errors in parentheses; ∗ p < .1, ∗∗ p < .05, ∗∗∗ p < .01.
22Table 4: Interest Rates around the Lifting of the Repossession Freeze (2013)
DiD Triple Diff
Post 2013 Q2 0.000295 0.0314
-0.00572 -0.0313
Ireland -0.0862∗∗∗ -0.0783∗∗∗
-0.00504 -0.0232
Treatment Effect -0.00218
-0.00582
Originated Pre Dec 2009 0.132∗∗∗
-0.0224
Treatment Effect -0.00993
-0.0325
Originated Pre Dec 2009, Post -0.0312
-0.0317
Originated Pre Dec 2009, Irish -0.00934
-0.0235
Triple Difference 0.00774
-0.033
Constant 4.612∗∗∗ 4.489∗∗∗
-0.00591 -0.0226
Observations 143903 154200
R2 0.038 0.041
Note: The sample includes standard variable rate mortgages observable in all 12 quarters 2011 to 2013 and
issued in the Border region of the Republic of Ireland and in Northern Ireland. Our observation period is
the year 2013. The dependent variable is the interest rate charged on these loans every quarter. We compare
rates charged to mortgages collateralized by homes in the Border region of the Republic of Ireland, before
and after the lifting of a moratorium on repossessions in July 2013, using mortgages collateralized by homes
in Northern Ireland, with a constant repossession framework over the period as a control group. In column
(1), we include only loans issued before December 1st, 2009, that is loans to which the repossession freeze is
relevant. Post 2013 Q2 is a dummy for quarters 2013Q3 and 2013Q4. Ireland is a dummy for the loan being
originated in the Border region of the Republic of Ireland. Treatment effect is the interaction of Post 2013 Q2
and Ireland. In column (2), we include loans originated on both sides of the December 1st, 2009 cut-off to
conduct a triple-difference strategy. We compare rates charged on loans originated in the Border region of the
Republic of Ireland before December 1st, 2009, before and after the lifting of a moratorium on repossessions in
July 2013, using loans originated on the other side of the border or the cut-off as a control group. Originated
Pre Dec 2009 is a dummy for the loan being originated before December 2009. Originated Pre Dec 2009,
Post is the interaction of Originated Pre Dec 2009 and Post 2013 Q2. Originated Pre Dec 2009, Irish is the
interaction of Originated Pre Dec 2009 and Ireland. Triple Difference is the interaction of Originated Pre Dec
2009, Ireland and Post 2013 Q2. Regressions include bank dummies, the regional rate of unemployment and
regional house prices. Standard errors in parentheses; ∗ p < .1, ∗∗ p < .05, ∗∗∗ p < .01.
23Table 5: Model of Internal Origination Credit Scores
(1) (2) (3) (4) (5) (6)
M oratorium 4.086∗ 3.972
(2.235) (3.200)
M oratoriumOn 1.300 4.622
(3.269) (3.967)
M oratoriumOf f -7.989∗∗∗ -8.305∗∗
(2.244) (3.750)
UK -5.248∗∗∗ -4.906 -7.797∗∗ -19.26 -8.305∗∗∗ -9.421
(2.027) (9.027) (3.094) (14.39) (2.051) (10.46)
Regional Unemployment 0.0548 -1.780 -0.133
(1.302) (1.970) (1.168)
Constant 624.6∗∗∗ 623.9∗∗∗ 629.6∗∗∗ 650.8∗∗∗ 653.9∗∗∗ 655.9∗∗∗
(7.739) (17.31) (7.745) (25.26) (7.130) (18.90)
Observations 5218 5218 3359 3359 3590 3590
R2 0.134 0.134 0.120 0.121 0.159 0.159
Note: We compare credit conditions for originations around the introduction (July 2011) and the lifting
(July 2013) of a repossession freeze in the Republic of Ireland. We measure credit conditions by the internal
origination credit score. We only include one bank in this model. A higher value of the credit score implies a
lower credit risk. The average score in the sample is 649, with a standard deviation of 42 points. In columns
1 and 2, we include loans originated over 2010-2014. M oratorium is set to one in the Border region of the
Republic of Ireland between 26 July 2011 and 25 July 2013. In column 3 and 4, we restrict the sample to
January 2010 to July 2013 to focus on the introduction of the moratorium. M oratoriumOn is set to one in
the Border region of the Republic of Ireland between 26 July 2011 and 25 July 2013. In columns 5 and 6, we
restrict the sample to July 2011 to Dec 2014 to focus on the lifting of the moratorium. I M oratoriumOf f is set
to one in the Border region of the Republic of Ireland after 25 July 2013. UK is a dummy for the mortgages
originated in Northern Ireland. Regressions include the regional unemployment rate and fixed effects for 142
loan types. Loan types are combinations of First Time Buyer status; Property Type; Fixed versus Variable
rate; Borrower Age Group; Single Assessment; Self-Employed.
24Table 6: Model of Origination Loan to Value
(1) (2) (3) (4) (5) (6)
M oratorium -2.988∗∗∗ -2.763∗
(1.127) (1.556)
M oratoriumOn 0.174 0.373
(1.352) (1.831)
M oratoriumOf f 5.870∗∗∗ 8.191∗∗∗
(1.343) (2.037)
UK -4.901∗∗∗ -5.574∗ -3.548∗∗∗ -4.215 -0.535 7.779
(0.797) (3.072) (1.031) (4.097) (1.118) (5.232)
Regional Unemployment -0.108 -0.104 0.996
(0.480) (0.620) (0.608)
Constant 54.13∗∗∗ 55.38∗∗∗ 51.28∗∗∗ 52.49∗∗∗ 58.45∗∗∗ 43.52∗∗∗
(2.669) (6.196) (3.075) (7.881) (3.649) (9.843)
Observations 7709 7709 5141 5141 4906 4906
R2 0.241 0.241 0.252 0.252 0.238 0.239
Note: We compare credit conditions for originations around the introduction (July 2011) and the lifting (July
2013) of a repossession freeze in the Republic of Ireland. We measure credit conditions by the origination loan
to value. In columns 1 and 2, we include loans originated over 2010-2014. M oratorium is set to one in the
Border region of the Republic of Ireland between 26 July 2011 and 25 July 2013. In column 3 and 4, we restrict
the sample to January 2010 to July 2013 to focus on the introduction of the moratorium. M oratoriumOn
is set to one in the Border region of the Republic of Ireland between 26 July 2011 and 25 July 2013. In
columns 5 and 6, we restrict the sample to July 2011 to Dec 2014 to focus on the lifting of the moratorium.
I M oratoriumOf f is set to one in the Border region of the Republic of Ireland after 25 July 2013. UK is
a dummy for the mortgages originated in Northern Ireland. Regressions include the regional unemployment
rate, bank fixed effects and fixed effects for 142 loan types. Loan types are combinations of First Time Buyer
status; Property Type; Fixed versus Variable rate; Borrower Age Group; Single Assessment; Self-Employed.
25You can also read