Living in Boston During COVID-19: Vaccination Planning and Hesitancy - Report #5 in a Series
←
→
Page content transcription
If your browser does not render page correctly, please read the page content below
Living in Boston During COVID-19:
    Vaccination Planning and
           Hesitancy

           Report #5 in a Series
Partnering Institutions
The Boston Area Research Initiative is an interuniversity partnership based at Northeastern University
that convenes researchers, policymakers, practitioners, and community leaders to envision and realize the
future of the city. Our primary goal is to leverage data and technology to better understand and serve
cities, with a focus on enhancing equity, justice, and democracy.
The Center for Survey Research (CSR) at the University of Massachusetts Boston is a full-scale
academic survey research center. CSR conducts basic and applied research that contributes to knowledge
and understanding of important social issues and supports public and private agencies and university
scholars in carrying out high quality policy-related research. Its projects include BEACON, a panel study
on Boston neighborhoods
Boston Public Health Commission, the country’s oldest health department, is an independent public
agency providing a wide range of health services and programs. Public service and access to quality
health care are the cornerstones of our mission—to protect, preserve, and promote the health and well-
being of all Boston residents, particularly those who are most vulnerable.

                                       The Team for this Report
Lee Hargraves, PhD, Interim Director, Center for Survey Research, University of Massachusetts Boston
Russell K. Schutt, PhD, Professor, Department of Sociology, University of Massachusetts Boston;
Clinical Research Scientist I, Beth Israel Deaconess Medical Center, Harvard Medical School
Daniel T. O’Brien, PhD, Associate Professor in the School of Public Policy and Urban Affairs; Director,
Boston Area Research Initiative; Northeastern University
Dan Dooley, PhD, Director, Research and Evaluation Office, Boston Public Health Commission
Floyd (Jack) Fowler, PhD, Senior Research Fellow, Center for Survey Research, University of
Massachusetts Boston
Ryan Qi Wang, PhD, Assistant Professor of Civil and Environmental Engineering; Associate Director of
Research on Social Media, Boston Area Research Initiative; Northeastern University
Alina Ristea, PhD, Postdoctoral Associate, Boston Area Research Initiative, Northeastern University
Anthony Roman, MA, Senior Research Fellow, Center for Survey Research, University of
Massachusetts Boston
Mehrnaz Amiri, Research Assistant and Student in the Masters of Science in Urban Informatics, Boston
Area Research Initiative, Northeastern University
Sage Gibbons, Research Assistant and Student in the Masters of Science in Urban Informatics, Boston
Area Research Initiative, Northeastern University
Hannah Grabowski, Research Assistant and Student in the Graduate Program in Applied Sociology,
Department of Sociology, University of Massachusetts Boston
Nikola Kovacevic, MA, Assistant Study Director, Center for Survey Research, University of
Massachusetts Boston

                                                Funding
The survey was funded by the National Science Foundation’s Human-Environment and
Geographical Sciences (HEGS) program through a grant for rapid-response research (RAPID;
Award #2032384 ).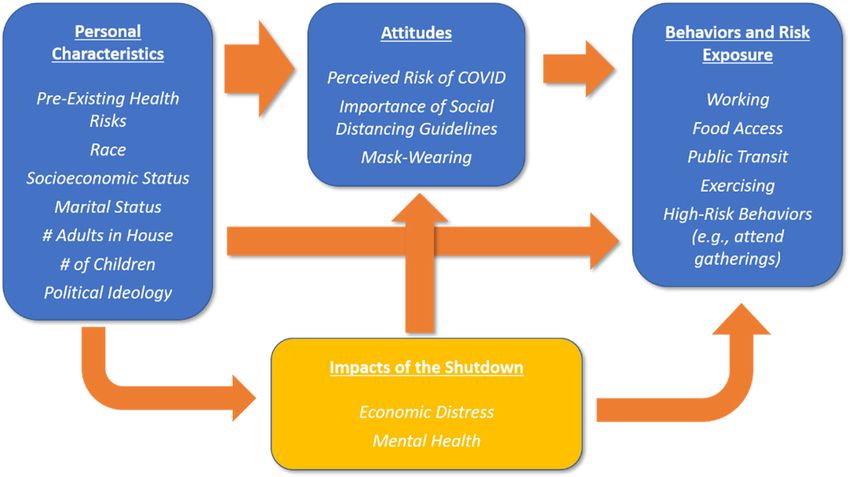
i
Executive Summary
In the summer of 2020, the Boston Area Research Initiative (BARI) at Northeastern
University, the Center for Survey Research (CSR) at University of Massachusetts Boston,
and the Boston Public Health Commission (BPHC) conducted a survey among 1626
Bostonians about their experiences of during the first months of the COVID-19 pandemic,
including: their ability and tendency to follow social distancing recommendations; attitudes
toward regulations; and the economic and personal impacts of the pandemic. In the fall, we
followed up with an additional web-based and mailed survey that asked about continued
employment, plans for getting the vaccine, mental health, and respondents’ perceptions
about life in their neighborhood.
This fifth report in a series describes Boston respondents’ intentions to get the COVID-19
vaccine, when available. In a mail and web-based survey conducted in the September 2020,
we asked if respondents plan to get vaccinated—definitely, probably, probably not, or
definitely not. In this report, we explore personal characteristics associated with
Bostonians’ hesitancy to get the vaccine (probably not/definitely not). We also provide
information about which respondents are definitely planning to get the COVID-19 vaccine.
This information may help identify people who are reluctant to get the vaccine and assist
efforts to tailor messages to Boston residents who have reservations about the coronavirus
vaccine.
Main Findings
One in five Bostonians do not plan to get vaccinated.
Black and Latinx Bostonians are more hesitant to get vaccinated than Whites.
o Almost 50% of Black respondents stated they definitely do not or probably
do not plan to get the vaccine.
o Over 1 in 4 Latinx respondents said they do not plan to get the vaccine.
o Over 90% of White and Asian/Pacific Islanders are probably or definitely
planning to get vaccinated.
Respondents with less formal education have less enthusiasm regarding their
plans to get vaccinated, compared to those with college education.
o About one-half of college educated respondents plan to get vaccinated.
o Over 1 in 4 respondents with less than a college education report that they
do not plan to get the vaccination.
Men and women have different plans to get vaccinated.
o Over 1 in 4 women do not plan to get vaccinated, while about 1 in 6 men do
not plan to get vaccinated.
o About one-half of men “definitely” plan to get the vaccine, compared to 36%
of women.
ii
For the most part, the more worried Boston respondents are about COVID-19
infection for themselves or family members, the more likely they are to get the
vaccine, but among people who are extremely worried about COVID-19. about one-
third probably or definitely do not plan on getting the vaccine. For these people,
worry about the virus and worry about the vaccine may go together.
Conclusions and Next Steps
Efforts to encourage vaccination for the COVID-19 coronavirus will be facilitated by public
health efforts that are sensitive to differences in people’s fears about the coronavirus as
well as vaccines. As the spring of 2021 approaches, more people will likely have some
personal contact with someone who has been vaccinated and that will help get to the
proportion of the population vaccinated needed to stop the rapid spread of COVID-19
infection. However, there are some neighborhoods, particularly communities of color,
where trusted members of the community may be the best resources to listen to people’s
concerns and provide information tailored to diverse audiences.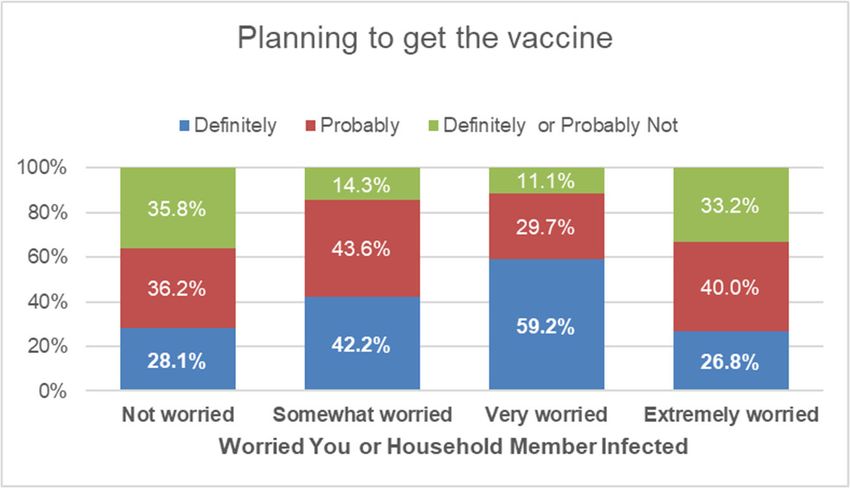
1

                                                                      Table of Contents
1. Living in Boston During COVID-19: A Neighborhood Survey...................................................................... 2
2. Who’s Planning to Get Vaccinated? ........................................................................................................................ 3
3. People Who are Not Worried about Infection Do Not Plan to Get Vaccine ............................................ 7
4. Efforts to Encourage Vaccination Must Focus on Neighborhoods ............................................................ 9
5. Conclusions .................................................................................................................................................................... 10
6. Appendix A. NSF Beacon Survey Methodology................................................................................................ 12
7. Appendix B: Worries about coronavirus infection by gender, age, level of education, and
   race/ethnicity ................................................................................................................................................................ 17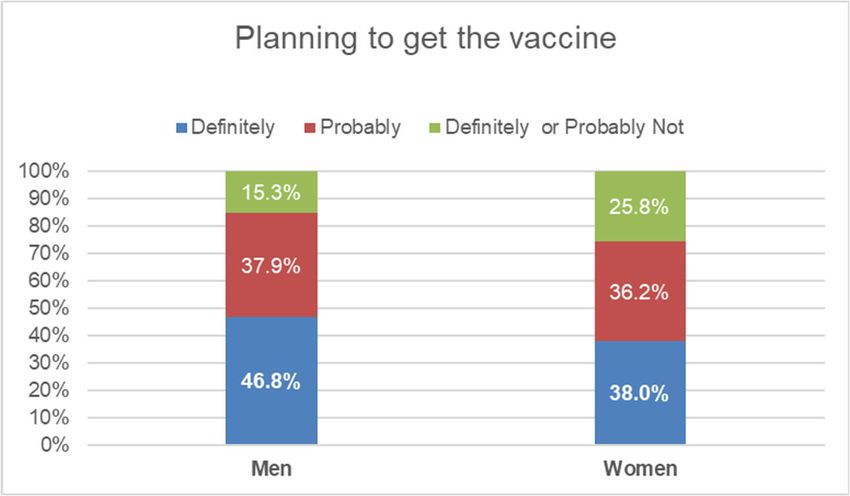
2

1. Living in Boston During COVID‐19: A Neighborhood Survey
The NSF-Beacon survey captures the experiences of 1626 Bostonians during the first
months of the COVID-19 pandemic, including: their ability and tendency to follow social
distancing recommendations; attitudes toward regulations; and the economic and personal
impacts of the pandemic. It provides unique insights into how these factors varied across
the populations and neighborhoods of a single city—something not currently available
from any other source, in Boston or otherwise.
        The Center for Survey Research (CSR) at University of Massachusetts Boston
conducted the survey over the summer, in collaboration with the Boston Area Research
Initiative (BARI) at Northeastern University, and the Boston Public Health Commission
(BPHC). The National Science Foundation’s Human-Environment and Geographical
Sciences (HEGS) program provided funding through a grant for rapid-response research
(RAPID). The survey used a probability-based random sample stratified by 25
neighborhoods and the results presented here were weighted to match the demographic
composition of the city. See Appendix A for more detail on the survey methodology.
        In September 2020, we invited respondents to the NSF-Beacon survey to complete a
follow-up questionnaire, either by mail or internet. The purpose of this survey was to
collect more information about the effects of the pandemic on health, behaviors, and
attitudes, including plans to get a vaccination.
         This is the
fifth in a series of
reports describing
key insights from the
survey. The series
focuses especially on
the racial and
socioeconomic
inequities that have
exacerbated—and
may continue to
exacerbate—
differential impacts
of the pandemic and
the associated         Figure 1. Model for Understanding the Effects of the COVID-19 Pandemic
shutdown. In doing so, on Boston Residents.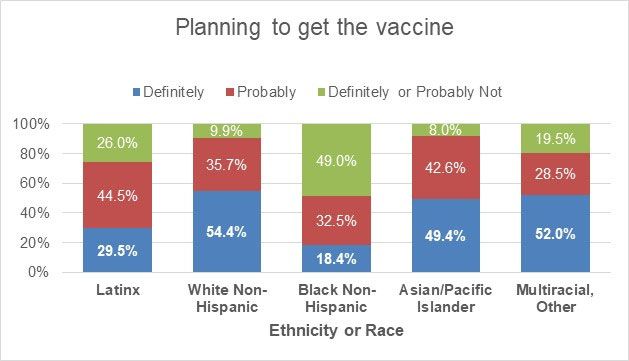
3

we consider four crucial classes of factors. The first class is personal characteristics,
including race, ethnicity, socioeconomic status, pre-existing health, family structure (e.g.,
number of children), and political ideology. Second are attitudes about the risk of infection
and social distancing guidelines, such as mask-wearing. Third are the types of activities
that might expose a person to infection. For instance, how often a person goes to work, the
grocery store, rides public transit, or visits in other people’s houses influences their
exposure risk. Fourth, the survey included items on the impacts of the pandemic:
employment, economic insecurity, and mental health.
        We have designed the series to walk through the relationship between these
features, as illustrated in Figure 1. Our first report described inequities in how Bostonians
of different racial and socioeconomic backgrounds engaged in necessary day-to-day
activities in April and the summer. The second report examined how attitudes, beliefs and
risky behaviors were distributed across communities. In our third report, we described
economic impacts—job and income loss—across individuals and neighborhoods, revealing
inequities in relation to race and ethnicity, socioeconomic status, and family composition,
as well as variation between neighborhoods. A fourth report provided a detailed
description of the factors that influenced attitudes toward and knowledge about the
pandemic, infection risk, and social distancing guidelines.
       This report focuses on survey respondents’ acceptance or hesitancy in getting a
COVID-19 vaccine. The analysis is based on results of a second survey among all people
who responded to our summer survey. To follow-up on Bostonians who responded to our
survey, we conducted a survey in the fall of 2020 using mailed questionnaires and a web-
based survey sent to those who provided email addresses. In this survey, 932 residents
responded. The results in this vaccination report are weighted to represent Boston
residents in terms of age, ethnicity, gender, and level of education.
       Future reports will continue relate to the content of other data sets, such as mobility
patterns, administrative records, and social media activity, collected as part of this project.1

2. Who’s Planning to Get Vaccinated?
       In our follow-up survey, 921 Boston residents answered the following question: “If a
vaccine against the coronavirus becomes available, do you plan to get vaccinated?” Figure 2
shows that 1 in 5 respondents stated they are not planning to get vaccinated: almost 9%
stated they were “definitely not” planning to get vaccinated and about 12% stated they
were “probably not” getting vaccinated. A little over 2 in 5 of respondents “definitely”

1   https://dataverse.harvard.edu/dataset.xhtml?persistentId=doi:10.7910/DVN/TDKDJJ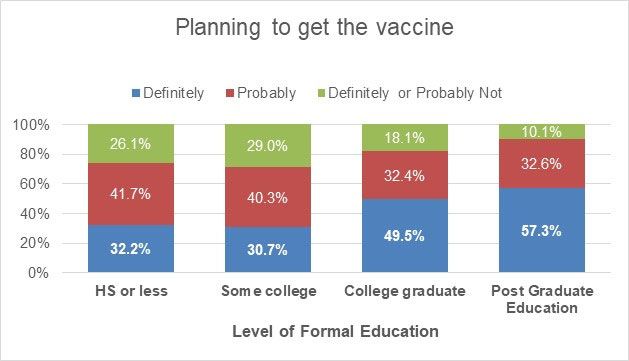
4

planned to get vaccinated and another 2 in 5 said they probably would, making the overall
rate of people saying they are likely to get vaccinated at nearly 80%.

Figure 2. The distribition of respondents who planned to get a COVID-19 vaccine (n=921) in
percentages

For the following analyses exploring who is planning to get the vaccine, the responses of
either “definitely not” or “probably not" (green bars in the figure) are combined.
       Willingness to be vaccinated varied considerably by age. Over one-third of
respondents 65 years of age and older in Boston stated they are unlikely to get vaccinated
(Figure 3). The age group most at risk of serious illness due to the virus, those 65 or older,
contained the highest proportion of respondents disinterested in vaccination as well as a
considerable proportion who definitely planned to be vaccinated In contrast, younger
respondents—those who were 18 to 34 years old—appear enthusiastic in their plans to get
a vaccine with fewer than 1 in 6 respondents saying they do not plan to get vaccinated.
Interest in being vaccinated was highest in this younger group, with over one half saying
they definitely plan to get vaccinated, while about one-third of the three older groups were
definitely planning on vaccination.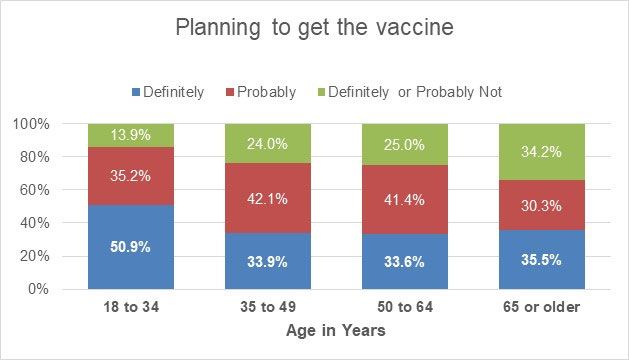
5

Figure 3. Planning to get a vaccine among responents in four age groups
       Men were more likely than women to state they definitely planned to get a vaccine
(Figure 4). About the same percentage of men and women said they probably would get the
vaccine (38 and 36% respectively). Hesitancy in planning to get a vaccine was much more
prevalent among women respondents with over 1 in 4 women stating they did not plan to
get a COVID-19 vaccine, compared to fewer than 1 in 6 men.

Figure 4. Difference in plans to get a vaccine by gender 2
       Respondents with a child in the household were much more hesitant to get a vaccine
(Figure 5). One third of respondents with children reported definitely or probably not
planning for COVID-19 vaccination. Only 1 in 5 respondents with a child in their household

2   This figure excludes 4 respondents who identify with a non-binary gender.
6

definitely planned to get the vaccine, compared to almost one half of respondents without
children. This pattern of hesitancy among those with children is present among men and
women: 41% of women with no child in the household definitely planned to get vaccinated,
compared to 18% of women living with a child; the corresponding percentages for men
were 49% without a child in the household compared to 24% of men living with a child.

Figure 5. Plans to get a COVID-19 vaccine in relation to having children in the household
       Intention to get the vaccine also increased sharply in relation to education
completed, with the percentage of respondents definitely planning to get vaccinated much
higher among those with a college education than those with less education (Figure 6).

Figure 6. The association between level of formal education and plans to get the vaccine
7
Differences in plans to get a vaccine were evident among different ethnic and racial
groups living in Boston. Latinx and particularly Black Bostonians had significant
reservations about vaccination. This hesitancy is most likely related to general mistrust in
government and the health care system in particular.3 Figure 7 shows that almost one-half
of Black respondents stated they probably or definitely were not planning to get the
vaccine. One-quarter of Latinx respondents indicated they do not plan to get the vaccine.
Fewer than 1 in 10 White and Asian/Pacific Islanders probably or definitely did not plan to
get vaccinated.
Figure 7. Ethnic and racial differences in plans for COVID-19 vaccination
3. People Who are Not Worried about Infection Do Not Plan to Get Vaccine
In our initial survey conducted in the summer of 2020, we asked respondents, “How
worried are you about you or someone in your family being infected with the COVID-19
coronavirus?” We expected respondents who expressed more worry about COVID19
infection would have definite plans to get the vaccine. This section of the report presents
information about Boston respondents’ worries overall and by gender, age, level of
education, and race/ethnicity. Then, we explore the association between levels of worry
and plans to get vaccinated.
Figure 8 shows the association of worries about being infected with the coronavirus
with plans to get the vaccine with the two responses (“Not at all worried” and “Not too
worried”) combined—two patterns emerge. First, an increasing percentage of respondents
3 Boulware, L. E., Cooper, L. A., Ratner, L. E., LaVeist, T. A., & Powe, N. R. (2003). Race and trust in the health
care system. Public health reports (Washington, D.C. : 1974), 118(4), 358–365.
https://doi.org/10.1093/phr/118.4.3588
“definitely” planning to get the vaccine appears to be associated with respondents’
expression of being not worried to very worried, from 28% to 59%, respectively. However,
a second finding is that respondents who are “extremely worried” about either them or
family members getting the coronavirus are less likely to “definitely” plan to get vaccinated.
Apparently, being extremely worried about infection does not directly lead to plans to get
vaccination. Respondents who were extremely worried were more ambivalent about the
vaccine. It may be that some respondents’ worries are about more than the infection and
they may be worried about vaccines as well.
Figure 8. Worried about COVID-19 infection and plans to get the vaccine
Appendix B on page 16 presents a table showing responses to the question about
COVID-19 worries for all respondents and cross tabulated by respondents’ age, gender,
level of education, and race or ethnicity. Respondents who were “extremely worried” about
COVID-19 infection were likely to have high school education or less, be older, or Black.
Overall, 1 in 4 Boston respondents were “extremely worried” and almost 1 in 3 were “very
worried” about COVID-19 infection, either for themselves or family members. Women were
more likely than men to be extremely worried (29.4% compared to 22.8%). Age is
associated with extreme worries about infection. Respondents with a high school education
or less are much more worried than those with more education (48.6% extremely worried,
compared to less than 26% among more educated respondents). Black and Latinx
respondents stated that they were extremely worried at much higher rates than Whites.
One in three Latinx respondents, one-half of Black respondents, and only 11% of Whites
were extremely worried.9
Note that the four groups that are most worried about the virus—women, those
over 65, those with less formal education, and those who are Black—also reported in the
figures above that they were less likely than average to want to get the vaccine.
4. Efforts to Encourage Vaccination Must Focus on Neighborhoods
The most difficult task for getting to what public health leaders call “herd immunity”
will require significant proportions of neighborhood residents getting the COVID-19
vaccine. Boston neighborhoods historically have differed in terms of where racial and
ethnic minorities reside; thus, efforts to encourage vaccination may need to be tailored by
neighborhood. We found that greater percentages of Black and Latinx residents are
hesitant to get the COVID-19 vaccine, compared to Whites. And since Latinx and Black
residents represent majorities in multiple Boston neighborhoods, it is likely that some
neighborhoods will have very few residents looking to be first in line to get the COVID-19
vaccine. This could severely slow the pursuit of herd immunity in these communities.
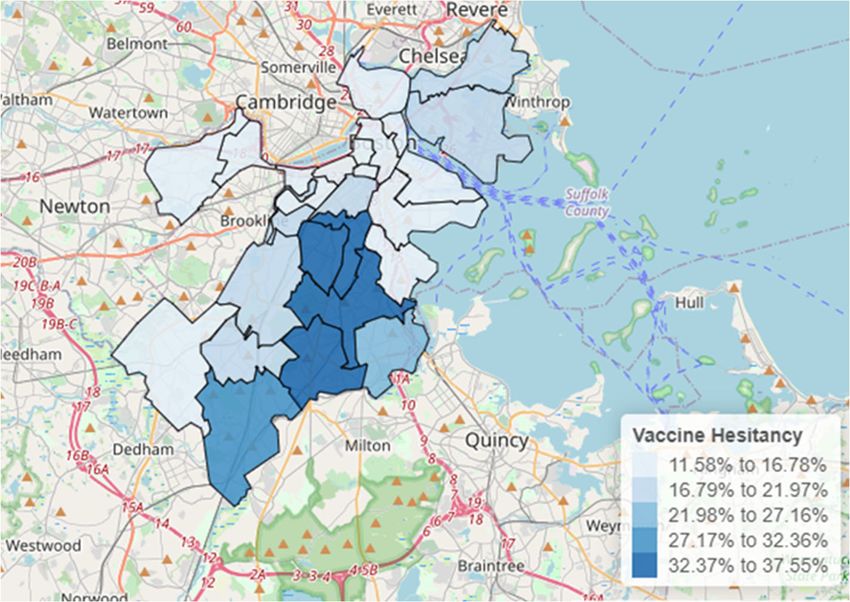
Using the rates of hesitancy presented in Figure 7 by race and ethnicity and
American Community Survey data for race and ethnicity in each neighborhood, we
extrapolated what percentage of the 25 Boston neighborhoods’ adult population may be
likely to “probably not” or “definitely not” get the coronavirus vaccine. Figure 9 estimates
the percentage of adult residents in each neighborhood who are likely to avoid vaccination.
Given the rates of hesitancy expressed by Black and Latinx respondents in the Living in
Boston during COVID‐19 survey, it can be expected that vaccination may be slower in some
neighborhoods. The figure shows that vaccine hesitancy rates last fall are highest in
neighborhoods with greater concentration of Black and African American residents—
Mattapan, Roxbury, Dorchester Central, and Hyde Park.10
Figure 9. Percentage of respondents “Definitely not” or “Probably not” planning to get the vaccine
in Boston neighborhoods extrapolated from Living in Boston during COVID‐19 survey data to
American Community Survey race and ethnicity data for each neighborhood
5. Conclusions
The Living in Boston during COVID‐19 follow-up survey provides information about
which Boston residents are clearly likely to get vaccinated and those who are more likely to
hesitate. Personal characteristics, such as gender, age, and ethnicity, are clearly associated
with plans to get the COVID-19 vaccine.
Our findings for Boston mirror nationally representative surveys. For example, we
found that almost 80% of Boston respondents were planning to get the coronavirus vaccine
with slightly more than 40% having definite plans for vaccination. This compares to more
than 2/3rds of the nationally-representative Understanding Coronavirus in America
tracking survey respondents saying they will likely get the vaccine.4
Our results related to race and ethnicity are also similar to national estimates with
Whites more likely to want to get the vaccine, Blacks less likely, and Latinos in between.
Nationally, men are more likely than women to plan to get the vaccine. Another
observation from national surveys is a slight trend in more people being willing to get the
vaccine as time passes and people hear more about it. For example, the Understanding
Coronavirus in America September survey, that was done at about the same time as our
4
https://covid19pulse.usc.edu/, accessed 31 December 202011
COVID in Boston survey found 60% willing to get the vaccine. In a more recent survey, that
number is now somewhat higher, around 65%.5 This uptick in the percentage of people
wanting to get a vaccine is likely due to people’s observations of the rollout of vaccinations
among larger groups of people.
However, even though more people are willing to get the vaccine, there are still
some groups of people who are less willing to get the coronavirus vaccine. The most
serious finding relates to race and ethnicity. We know that neighborhoods continue to be
characterized by race and ethnicity. If some groups are less likely to get vaccines and they
tend to live in majority-minority neighborhoods, it may take longer to get vaccination
levels to the percentage of people needed to mitigate spread of the COVID-19 coronavirus.
Our neighborhood-level estimates are based on survey responses from fall 2020.
The COVID-19 vaccine began distribution in December 2020.5 As vaccination rolls out
throughout the Commonwealth of Massachusetts, rates of acceptance among Boston
residents in communities of color may shift in a positive direction.
Efforts to encourage vaccination will require tailored messages from trusted
members of communities to achieve herd immunity, especially at the neighborhood level.
And since Boston, like many U.S. cities, has neighborhoods that have ethnic and racial
identities, efforts to get over 70% of residents immunized need to come from community-
level influencers and leaders. Furthermore, these efforts must overcome hesitancy that is
clearly associated with age, gender, and having children in the household.
5 https://www.mass.gov/covid-19-vaccine-in-massachusetts, accessed 5 January 202112 6. Appendix A. NSF Beacon Survey Methodology The NSF-Beacon survey is a collaboration of the Boston Area Research Initiative (BARI) at Northeastern University, the Center for Survey Research (CSR) at University of Massachusetts Boston, and the Boston Public Health Commission (BPHC), funded by the National Science Foundation’s Human-Environment and Geographical Sciences (HEGS) program through a grant for rapid-response research (RAPID) for collecting ephemeral data during or following a crisis. The survey captures the experiences of 1370 Bostonians during the first months of the COVID-19 pandemic, including ability and tendency to follow social distancing recommendations, attitudes towards regulations, and economic and personal impacts of the pandemic. The design allows for a unique observation of neighborhood-level estimates for these factors. I. Sample Design and Final Sample The NSF-Beacon survey used a stratified random sample that divided the city of Boston into 25 distinct neighborhoods. The neighborhoods were defined in collaboration with members of the Mayor’s Office and other experts based on social, demographic, and historical salience. They were constructed to conform to census block group boundaries, meaning that metrics associated with census geographies (including from the U.S. Census Bureau) could be linked with the data. The Marketing Systems Group (MSG) was contracted to draw a simple random sample of residential addresses from within each neighborhood. They used the most recent United States Postal Service Computerized Delivery Sequence File (CDSF) to draw Address-Based Samples (ABS) of residential addresses. Four neighborhoods with a higher proportion of Black or Latinx populations were oversampled (Hyde Park, Mattapan, Lower Roxbury, and East Boston-Eagle Hill). As shown in Table 1, there were unbalanced sample sizes and selection probabilities across neighborhoods, meaning analysis of the data requires survey weights to correct for these differences. In addition to the survey being administered to the sample obtained for the NSF-Beacon study, we also invited participants in the previously constructed Beacon panel, which had been recruited using the same 25 neighborhood stratified sample design. II. Data Collection Methodology Paper copies of the survey, plus instructions for completing and returning, and a $2 cash incentive were mailed to all sampled addresses. For three neighborhoods known to have higher percentages of Hispanic households, the materials mailed, including the survey instrument, were in both English and Spanish. All recipients were also given the option of completing the survey online and an associated URL. A randomly assigned half of the mailed questionnaires had instructions for the oldest adult 18+ in the household to complete the survey while the other random half had instructions for the youngest adult 18+ to complete the survey. In this manner, an attempt was made to randomize the age of the respondent within the household completing the survey. Approximately two weeks after the initial mailing of materials, a second mailing was sent to nonrespondents, though with no additional incentive.
13

Table 1. Survey neighborhood sampling specifications and data collection results by
          neighborhood
                                  Number of                       Number of
                                   Sampled      Probability of    Completed         Response
          Neighborhood            Addresses       Selection    Questionnaires         Rate
  1 Hyde Park                       364          0.02967               59            17.10%
  2 West Roxbury                    189          0.01407               59            32.24
  3 Roslindale                      188          0.01820               73            40.11
  4 Mattapan                        362          0.02704               61            17.58
  5 Dorchester Central              189          0.01042               39            21.08
  6 Dorchester South                191          0.01671               60            32.97
  7 Dorchester North                188          0.02661               42            23.86
  8 Lower Roxbury                   372          0.05977               57            17.59
  9 Roxbury                         188          0.01511               37            20.67
  10 Jamaica Plain                  188          0.01138               71            39.66
  11 Jamaica Plain-Mission Hill     191          0.02737               55            30.73
  12 South End                      188          0.01070               57            32.02
  13 Fenway/Kenmore                 195          0.01169               39            21.91
  14 Allston                        192          0.01702               51            28.81
  15 Brighton                       187          0.00839               58            31.87
  16 Back Bay                       194          0.01871               53            31.36
  17 Beacon Hill                    204          0.03593               53            30.11
  18 South Boston                   191          0.01150               45            24.86
  19 Seaport                        192          0.04554               40            22.47
  20 Central                        198          0.06119               50            27.78
  21 Central Northeast              196          0.02839               58            33.14
  22 Central West                   200          0.01665               55            32.35
  23 Charlestown                    190          0.02286               62            34.25
  24 East Boston                    189          0.02501               43            24.29
  25 East Boston-Eagle Hill         355          0.04189               93            27.84
  TOTAL                            5481                             1370             26.88%
1
  Response rates computed using AAPOR Method 3.
14 III. Data Collection Results The final sample included 1370 completed surveys (1208 paper, 162 online; 30 were completed in Spanish). The number of completed surveys ranged from 37 in Roxbury to 93 in East Boston-Eagle Hill. Overall response rate was 26.88% and ranged from a low of 17.10% in Hyde Park to a high of 40.11% in Roslindale. Full details on each neighborhood sample are presented in Table 1. An additional 256 completed surveys were obtained from members of the previously constructed Beacon panel, bringing the total number of completed surveys to 1626. IV. Weighting of survey data The sample requires weighting to account for both differing probabilities of selection and response rates across neighborhoods, especially insofar as these differences create a sample that is demographically and geographically non-representative. We created two survey weights, one for sample design factors including probability of selection and number of adults in the household adjusted for nonresponse bias across neighborhoods, the other which adds a post-stratified weight to account for demographic non-representativeness. Additionally, we conducted this process twice. First, we did it only for respondents to the NSF-Beacon survey. Second, we replicated the procedures for the dataset that combined the NSF-Beacon survey responses with respondents from the previously constructed Beacon panel (values reported in Table 2 for weighting are highly similar for the NSF-Beacon responses alone and the merged data set). Weights for Nonresponse Bias Weighting for nonresponse began by neighborhood with the inverse of the probabilities of selection adjusted for the response rates displayed by neighborhood according to the equation (see Table 1 for values): Wb = (Inverse of probability of selection) / (neighborhood response rate) The final nonresponse adjusted weight further multiplies the base weight by the number of adults 18+ in the household (capped at 4 to prevent excessively large weights). Finally, these weights are adjusted so that the percentage of the total 18+ population in Boston that belongs in each neighborhood agreed with control percentages computed from the 2014-2018 5-year American Community Survey (ACS) data from the Census Bureau. These weights sum to the ACS estimate of the total 18+ population in the city of Boston. Therefore, the final nonresponse adjusted weight can be defined as: WNR = (Wb)(number of adults in household)(ACS population adjustment factor) 16
15

Post-Stratified Weights

As shown in Table 2, even after nonresponse weights, the respondents to the survey were not
demographically representative of Boston’s population. Most notably, people with education beyond
4-year college degrees were overrepresented and those with a high school education or less were
underrepresented. Women were also overrepresented relative to men and White non-Hispanics were
overrepresented relative to Blacks and Hispanics. There was also a smaller age bias with too many
65+ people and too few 18-34. A final adjustment to the survey weights was implemented to adjust
for differential survey nonresponse by age, gender, race/Hispanic origin, and education. Control
percentages for these categories were computed from the 2014-2018 5-year ACS data. Post-
stratification factors were then computed to match weighted survey data to citywide percentages. The
final post-stratified weight can be expressed as:

WPS = (WNR)(post-stratified factors)

It should be noted, though, that a small amount of trimming of weights, less than one percent of all
sample cases, was employed to prevent some extreme values in the post-stratified weights. As shown
in Table 2, this additional adjustment process brought the weighted survey estimates much more in
line with ACS citywide estimates.

Weights for the second mail and web-based survey.

For the follow-up survey, where 932 of the original 1626 respondents answered questions, new post-
stratification factors were developed to again match weighted survey data to the 2014-2018 5-year
ACS.
16

Table 2. Comparison of ACS controls to nonresponse and post-stratified weights
                                        ACS     Nonresponse        Post-stratified
    Respondent Characteristics         Controls   Weight              Weight
 Age
  18-34                                   46.9%       38.4%            46.2%
  35-49                                   21.3        20.1             21.5
  50-64                                   18.4        22.1             18.6
  65+                                     13.4        19.4             13.7
 Gender
  Male                                    47.6%       38.0%            47.6%
  Female                                  52.4        62.0             52.4
 Education
  High School including GED or less       33.6%       16.4%            32.5%
  Some college or 2-year degree           17.8        14.8             18.0
  4-year college degree                   26.5        29.3             27.0
  Beyond 4-year college degree            22.1        39.5             22.5
 Race/Hispanic origin
  White non-Hispanic                      49.4%       57.5%            49.4%
  Black non-Hispanic                      20.6        15.8             20.6
  Hispanic                                16.9        12.4             16.9
  Other                                   13.1        14.3             13.1
17
7. Appendix B: Worries about coronavirus infection by gender, age, level of
education, and race/ethnicity
How worried about self or someone in family being infected?
TOTAL %
Not at all Unweighted
or Not too6 Somewhat Very Extremely n
All Respondents 12.9% 29.8% 30.4% 26.9% 100% (924)
Gender
Men 12.5% 35.1% 29.6% 22.8% 100% (363)
Women 12.9% 25.4% 32.3% 29.4% 100% (541)
Age
18 to 34 13.6% 37.2% 37.4% 11.9% 100% (281)
35 to 49 15.8% 28.7% 26.4% 29.2% 100% (204)
50 to 64 7.8% 23.3% 31.9% 37.0% 100% (201)
65 or older 12.6% 16.8% 16.1% 54.5% 100% (207)
Education
High school or less 10.8% 10.7% 29.9% 48.6% 100% (113)
Some college 18.2% 25.6% 30.8% 25.4% 100% (107)
College graduate 11.6% 46.2% 29.4% 12.8% 100% (271)
Post graduate 11.7% 41.3% 33.4% 13.5% 100% (409)
education
Race or ethnicity
Latinx 13.3% 27.2% 26.7% 32.8% 100% (70)
White non-Hispanic 15.3% 38.6% 35.0% 11.2% 100% (624)
Black/African American 11.0% 13.4% 21.8% 53.8% 100% (84)
Asian/Pacific Islander 2.2% 27.0% 35.1% 35.7% 100% (17)
Multiracial or other 10.1% 25.6% 44.7% 19.6% 100% (31)
6
Only 23 respondents selected “Not at all worried.” They are combined with the 96 respondents stating they were
“Not too worried.”You can also read