Long-Term Observations of Thickness Changes of Each Retinal Layer following Macular Hole Surgery - Hindawi.com
←
→
Page content transcription
If your browser does not render page correctly, please read the page content below
Hindawi
Journal of Ophthalmology
Volume 2021, Article ID 4624164, 10 pages
https://doi.org/10.1155/2021/4624164

Research Article
Long-Term Observations of Thickness Changes of Each Retinal
Layer following Macular Hole Surgery

          Atsushi Tada, Shigeki Machida , Yuji Hara, Satoshi Ebihara, Masahiko Ishizuka,
          and Mana Gonmori
          Department of Ophthalmology, Dokkyo Medical University, Saitama Medical Center, 2-1-50 Minamikoshiagya, Koshigaya,
          Saitama 343-8555, Japan

          Correspondence should be addressed to Shigeki Machida; smachida57@gmail.com

          Received 7 June 2021; Revised 28 September 2021; Accepted 7 October 2021; Published 19 October 2021

          Academic Editor: Takeshi Iwase

          Copyright © 2021 Atsushi Tada et al. This is an open access article distributed under the Creative Commons Attribution License,
          which permits unrestricted use, distribution, and reproduction in any medium, provided the original work is properly cited.
          Purpose. To determine the long-term changes of the thickness of each retinal layer following macular hole (MH) surgery combined
          with internal limiting membrane (ILM) peeling. Method. The medical records of 42 eyes of 42 patients (41 to 86 years of age) who
          underwent MH surgery with ILM peeling between February 2016 and October 2018 were reviewed. A single surgeon operated on
          all patients, and all were followed for at least 24 months postoperatively. Spectral-domain optical coherence tomography (OCT)
          was performed to obtain retinal thickness maps of the parafoveal region corresponding approximately to the ILM peeled area.
          Each retinal layer was automatically segmented by the embedded software, and thickness maps were constructed for the total
          retinal layer (TRL), inner RL (IRL), middle RL (MRL), and outer RL (ORL). The averaged value of each retinal layer thickness was
          analyzed in the temporal/upper, temporal/lower, nasal/upper, and nasal lower quadrants. Results. The TRL thickness was
          significantly decreased in the temporal areas postoperatively. The IRL thickness thinned progressively and significantly until 6
          months without further thinning in the temporal quadrants. The MRL thickness of all areas was significantly thicker than the
          baseline values at 0.5 months and then gradually decreased in the temporal regions. However, the thickening in the nasal regions
          returned to the baseline values after 1.5 months. The ORL decreased transiently relative to the baseline values at 0.5 months in all
          areas. Conclusions. The ILM peeling does not affect only the thickness of the inner retina but also the middle and outer retinae in
          the parafoveal region. The chronological changes of the thickness after surgeries varied among the retinal layers and
          macular regions.

1. Introduction                                                          acetonide (TA) [16–18] have been used to make the ILM more
                                                                         visible to facilitate the surgical grasping of the ILM. At
A macular hole (MH) is caused by vitreoretinal traction that             present, ILM peeling during MH surgery has become the gold
results from a perifoveal posterior vitreous detachment                  standard surgical method for closing an MH.
[1–6]. This traction causes a disruption or loss of the “Müller             A large body of evidence has accumulated to show al-
cell cone” in the foveola that precedes the development of a             terations of the retinal structure after ILM peeling during the
full-thickness MH [6, 7]. Surgical repair of an MH can be                MH surgery. Initially, Tadayoni et al. reported that a dis-
achieved by vitrectomy and gas tamponade that leads to an                sociation of the optic nerve fiber layer developed after ILM
improvement of the visual function [8, 9].                               peeling, and it could affect the visual function [19–22].
     To improve the anatomical success and decrease the re-              Second, a thinning of the temporal retina and thickening of
currence rates, Brooks et al. advocated peeling the internal             the nasal retina have been reported to occur after ILM
limiting membrane (ILM) around the MH [10, 11]. Several                  peeling by using optical coherence tomography (OCT)
vital dyes and drugs including indocyanine green (ICG)                   [23–25]. The thinning of the temporal retina has been re-
[12, 13], brilliant blue green (BBG) [14, 15], and trimacinolone         ported to occur predominately in the inner retina as detected
2                                                                                                    Journal of Ophthalmology

in the ganglion-cell complex (GCC) map [26–28]. Third, a          2.2. Surgical Procedures. Standard 3-port, 25-gauge pars
retinal displacement toward the optic nerve head after ILM        plana vitrectomy combined with phacoemulsification and
peeling has been shown by tracking the retinal vessels before     aspiration with an implantation of an intraocular lens (NX-
and after the surgery [29–32].                                    70, Advanced Vision Science, Inc., Coleta, CA, USA) was
    Spectral-domain OCT (SD-OCT) allows a layer-by-layer          performed on all patients using the Constellation Vision
analysis of the structure of the retina using thickness maps      SystemⓇ (Alcon Inc., Geneva, Switzerland). Preservative-
because high-resolution retinal images can be obtained            free triamcinolone acetonide (TA; MaQaid, Wakamoto
quickly. Ohta et al. [25] and Faria et al. [33] used retinal      Pharmaceutical Co., Ltd, Tokyo, Japan) was suspended in
thickness maps to demonstrate a thinning of the inner retina      4 ml balanced salt solution (BSS plus, Alcon Japan, Tokyo,
and a thickening of the outer retina at certain postoperative     Japan) and injected intravitreally during vitrectomy to make
times. These findings indicated that the structural changes        the posterior hyaloid membrane more visible. BBG was
were not confined to the inner retina where the surgical           dissolved in BSS plus to a concentration of 0.025%, and
procedures were performed. However, a long-term study of          approximately 0.2 ml of the dye solution was injected
the chronological changes of thickness of the different retinal    intravitreally with a gentle stream directed toward the
layers after MH surgery has not been done.                        posterior pole of the eye. The dye was removed from the
    Thus, the purpose of this study was to determine long-        vitreous cavity by infusion and aspiration.
term changes of the thickness of each retinal layer using the         Then, the ILM was grasped with an ILM forceps, and the
thickness map obtained by SD-OCT following MH surgery             ILM was peeled around the macular hole with a size of ap-
combined with ILM peeling. We shall show that the ILM             proximately 3-disc diameters. Air-fluid exchange was per-
peeling affected not only the inner retina but also the middle     formed followed by an injection of 20% sulfur hexafluoride
and outer retinal layers in the parafoveal region. In addition,   (SF6). All surgical procedures were performed by one of the
we also found that the changes varied with the postoperative      authors (SM). All patients were instructed to maintain a face-
time.                                                             down position for at least 2 days after the surgery.

2. Methods                                                        2.3. Optical Coherence Tomography (OCT). OCTscan images
                                                                  were acquired with a spectral-domain OCT instrument (SD-
2.1. Study Patients. Forty-two eyes of 42 patients underwent
                                                                  OCT, RS-3000 Advance, Nidek Co. LTD., Gamagori, Aichi,
the MH surgery combined with ILM peeling between
                                                                  Japan; Figure 1(a)). The retinal thickness was measured at
February 2016 and September 2018 in the Dokkyo Medical
                                                                  512 × 128 points in the posterior pole of the eye (Figure 1(b)).
University Saitama Medical Center. There were 22 women
                                                                  The tracking system of the OCT system reduced the effects of
and 20 men whose age ranged from 41 to 86 years with a
                                                                  eye movements that allowed us to measure the thickness at
mean of 67.6 ± 7.3 years (average ± standard deviation). The
                                                                  each retinal point reliably.
patients were examined preoperatively and at 0.5, 3, 6, 9, 12,
                                                                       We used the thickness charts for the analyses. The mean
18, and 24 months postoperatively, and their medical rec-
                                                                  thickness was determined for each quarter of an annulus
ords were reviewed. We included patients whose MHs had
                                                                  with an inner diameter of 1.5 mm and an outer diameter of
been confirmed to be closed by SD-OCT at 0.5 months after
                                                                  4.5 mm. The selected areas were marked out in squares
the surgery. All patients underwent comprehensive oph-
                                                                  (Figure 1(b)). The quarter annuli were designated as the
thalmological examinations including measurements of the
                                                                  temporal/superior (TS), temporal/inferior (TI), nasal/su-
best-corrected visual acuity (BCVA) and slit-lamp bio-
                                                                  perior (NS), and nasal/inferior (NI) quadrants.
microscopic and indirect ophthalmoscopic examinations
                                                                       All thickness measurements were made automatically by
with dilated pupils. The MHs were classified into stages
                                                                  the autosegmentation software embedded in the OCT de-
according to the SD-OCT findings: Stage 1 (n � 2), Stage 2
                                                                  vice. The total retinal layer (TRL) from the ILM to the retinal
(n � 17), Stage 3 (n � 15), and Stage 4 (n � 8) [1–6]. The base
                                                                  pigment epithelium (RPE), the inner retinal layer (IRL) from
diameter of the MHs ranged from 105 to 1371 μm (aver-
                                                                  the ILM to the inner plexiform layer (black arrows in
age ± standard deviation dimension 599 ± 307 μm) and the
                                                                  Figure 1(a)), the middle retinal layer (MRL) from the inner
minimum diameter from 70 to 641 μm (263 ± 149 μm). These
                                                                  nuclear layer to the outer plexiform layer (gray arrows in
diameters were obtained from the vertical and horizontal
                                                                  Figure 1(a)), and the outer retinal layer (ORL) from the outer
sections through the center of the MHs and were averaged.
                                                                  nuclear layer to RPE (white arrows in Figure 1(a)) were
     The exclusion criteria included macular pathologies
                                                                  measured to obtain the thickness map for each retinal layer.
other than MH, retinal vascular diseases, history of other
                                                                  Manual corrections were made when segmentation errors
ocular disorders including uveitis, severe dry eye, trauma
                                                                  were found.
and glaucoma, and systemic disorders that could affect the
retina such as diabetes, uncontrolled hypertension, in-
flammatory bowel disease, and prior ocular surgery.                2.4. Statistical Analyses. The GraphPad Prism version 8.1.2
     This research was approved by the Institutional Review       (332) (GraphPad software, San Diego, CA, USA) software was
Board of Dokkyo Medical University and conducted in               used for statistical analyses. The measured data are presented
accordance with the Institutional Guidelines, and the pro-        as the means ± standard deviations (SDs). The distribution of
cedures conformed to the tenets of the Declaration of             the measured data was examined by the Kolmogor-
Helsinki.                                                         ov–Smirnov test. The statistical significance of the differences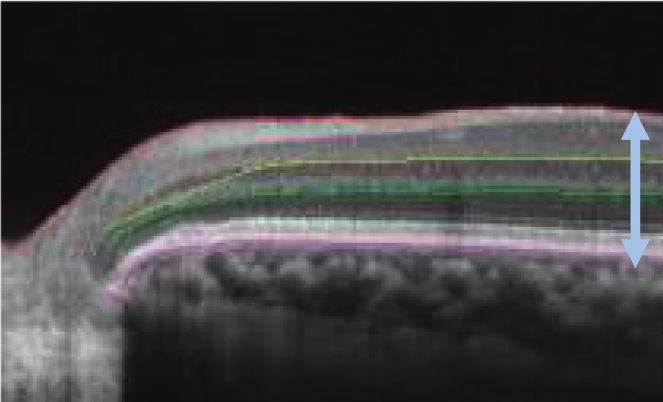
Journal of Ophthalmology 3
(a)
Map Chart
500
100
400
307 270
99
NS TS
300 354 319
4.5 mm
95
296
1.5 mm
200 337 316 5
NI TI
298 261
1
100
[μm]0
[%]
[μm]
(b)
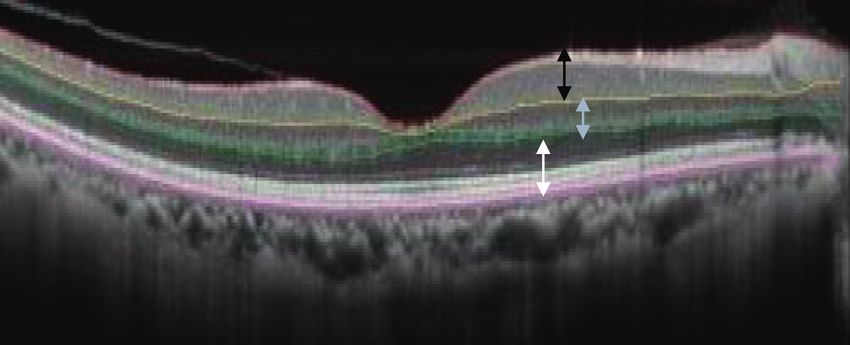
Figure 1: Cross-sectional images obtained by SD-OCT showing how measurements of the retinal thickness of the inner (black arrow),
middle (gray arrow), and outer retinal layers (white arrow) were made. (a) Retinal thickness map of the inner retinal layer. (b) Inner and
middle circles of 1.5 and 4.5 mm diameters were placed on the center of the fovea. Averaged thicknesses for the temporal/superior (TS),
temporal/inferior (TI), nasal/superior (NS), and nasal/inferior (NI) quadrants of the middle circle are presented in the thickness chart
(encompassed by squares). SD-OCT, spectral-domain optical coherence tomography.
for diseased eyes at 0.5, 3, 6, 9, 12, 18, and 24 months following decreased with time (P < 0.0001) with a significant reduction
the surgery was evaluated by the repeated-measures one-way compared to that of the baseline at 3, 6, 9, 12, 18, and 24
ANOVA tests. In addition, the Turkey’s multiple comparison months (P < 0.05 to 0.0001). In the nasal quadrants
tests were performed after the ANOVA as post hoc tests. (Figures 3(c) and 3(d)), the TRL thicknesses did not change
Bartlett’s test was used to correct the P values. A statistical level significantly with time.
of significance was accepted at P < 0.05.
3. Results 3.3. Mean Thicknesses of Inner Retinal Layer (IRL). The mean
thicknesses of the IRL are plotted against the postoperative
3.1. Representative Case. B-scan SD-OCT images from an eye times for each quadrant to assess chronological changes
with an MH at the preoperative baseline, 0.5, and 24 months (Figure 4). In the temporal quadrants (Figures 4(a) and 4(b)),
postoperatively are shown in Figure 2. The thickness of the the IRL thickness was not significantly different from the
parafoveal nasal retina appears to be unchanged (gray arrows) baseline values at 0.5 months, and it progressively decreased
relative to that of the baseline image (Figure 2(a)) until 24 until 6 months and then remained unchanged throughout the
months (Figure 2(c)). However, the temporal retina was thinner remaining study period (P < 0.0001). The IRL was significantly
than the baseline at 0.5 (Figure 2(b)) and 24 months (black thinner after 1.5 months than that of the baseline
arrows). The arrows were placed at 1.0 mm from the fovea. (P < 0.005 − 0.0001). In the nasal quadrants, the IRL thickness
was slightly increased and then decreased postoperatively, but
the difference from that of the baseline was not significant.
3.2. Mean Thickness of Total Retinal Layer (TRL). The mean
thickness of the TRL is plotted against the postoperative
times for each quadrant to assess the chronological changes 3.4. Mean Thickness of Middle Retinal Layer (MRL). The
(Figure 3). In the temporal quadrants (Figures 3(a) and mean thicknesses of the MRL are plotted against the
3(b)), the TRL thickness gradually and significantly postoperative time for each quadrant (Figure 5). In the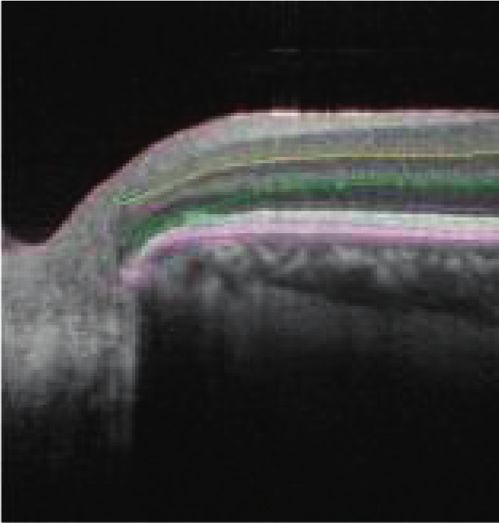
4                                                                                                                                                              Journal of Ophthalmology

                                                                                                                             200 μm
                                           Nasal                                                                                                         Temporal

                                                                                           (a)

                                           Nasal                                                                                                         Temporal

                                                                                           (b)

                                          Nasal                                                                                                          Temporal

                                                                                           (c)

Figure 2: Representative cross-sectional SD-OCT images obtained by horizontal scans from eyes with a MH preoperatively (baseline, (a))
and postoperatively at the 0.5 (b) and 24 (c) months. The arrows placed at 1.0 mm from the fovea indicate the total retinal thickness in the
nasal (gray arrows) and temporal (black arrows) retina. SD-OCT, spectral-domain optical coherence tomography; MH, macular hole.

                          360                          TS                                                             360
                                                                                                                                                          TI
     TRL thickness (μm)

                                                                                                 TRL thickness (μm)

                          340                                                                                         340

                                                      **     ***                                                                                  ***
                          320                                      ***   ***   ***                                    320                                ***    ***
                                                                                     ***                                                                              ***   ***   ***

                          300                                                                                         300

                          280                                                                                         280

                                Baseline 0.5    1.5    3      6     9    12   18     24                                     Baseline 0.5    1.5    3      6     9    12   18      24
                                               Post-operative period (months)                                                              Post-operative period (months)
                                                       (a)                                                                                         (b)
                                                                                Figure 3: Continued.
Journal of Ophthalmology                                                                                                                                                                    5

                              360                                                                                        360

                                                                                                    TRL thickness (μm)
                                                                                                                         340
     TRL thickness (μm)

                              340

                              320                                                                                        320

                              300                                 NS                                                     300                                   NI

                              280                                                                                        280

                                    Baseline 0.5    1.5    3      6     9    12   18          24                               Baseline 0.5    1.5    3      6     9    12   18        24
                                                   Post-operative period (months)                                                             Post-operative period (months)

                                                           (c)                                                                                         (d)

Figure 3: Mean thicknesses of the total retinal layer (TRL) are plotted for the MH eyes that had undergone vitrectomy with ILM peeling. In
the temporal/superior (a) and temporal/inferior (b) quadrants, the TRL thickness decreases significantly with postoperative time. A
significant thinning of the TRL was found between the baseline (preoperative eyes) and postoperative eyes at 3 months and thereafter. MH,
macular hole; ILM, internal limiting membrane; TS, temporal/superior; TI, temporal/inferior; NS, nasal/superior; NI, nasal/inferior.
Asterisks represent significant differences between the control and operated eyes. ∗∗P < 0.005, ∗∗∗P < 0.0001.

                              140                                                                                        140
                                                                TS                                                                                                 TI
                                                                                                    IRL thickness (μm)
         IRL thickness (μm)

                              120                                                                                        120

                                                     **                                                                                        ***
                                                          ***        ***   ***   ***   ***   ***                                                     ***     ***    ***   ***   ***   ***
                              100                                                                                        100

                               80                                                                                         80

                                    Baseline 0.5    1.5    3      6     9   12    18         24                                Baseline 0.5    1.5    3      6     9   12    18       24
                                                   Post-operative period (months)                                                             Post-operative period (months)
                                                            (a)                                                                                       (b)
                              140                                                                                        140
                                                                                                   IRL thickness (μm)
       IRL thickness (μm)

                              120                                                                                        120

                              100                                                                                        100
                                                                NS                                                                                                 NI

                               80                                                                                         80

                                    Baseline 0.5    1.5    3      6     9    12   18         24                                Baseline 0.5    1.5    3      6     9    12   18       24
                                                   Post-operative period (months)                                                             Post-operative period (months)

                                                            (c)                                                                                       (d)

Figure 4: Mean thicknesses of the inner retinal layer (IRL) are plotted for the MH eyes treated with ILM peeling. In the temporal/superior
(a) and temporal/inferior (b) quadrants, the IRL thickness significantly decreases with postoperative time up to 6 months with subsequent
stability. Significant thinning of the IRL was found between the baseline (preoperative eyes) and postoperative eyes at 1.5 months and
thereafter. MH, macular hole; ILM, internal limiting membrane; TS, temporal/superior; TI, temporal/inferior; NS, nasal/superior; NI, nasal/
inferior. Asterisks represent significant differences between the control and operated eyes. ∗∗P < 0.005; ∗∗∗P < 0.0001.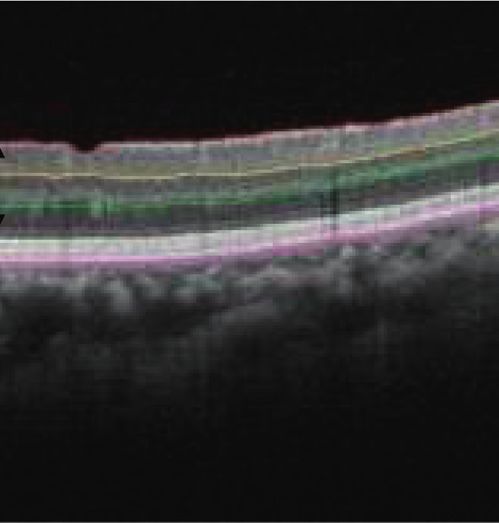
6                                                                                                                                                     Journal of Ophthalmology

                           100                                                                                  100
                                                                TS                                                                                   TI

                            90                                                                                  90

                                                                                           MRL thickness (μm)
      MRL thickness (μm)

                                                                                                                               **
                                           *
                            80                                                                                  80
                                                                                 *    **                                                                            **   **
                            70                                                                                  70

                            60                                                                                  60
                                 Baseline 0.5     1.5    3      6     9   12     18   24                              Baseline 0.5    1.5    3      6     9    12   18   24
                                                Post-operative period (months)                                                       Post-operative period (months)
                                                         (a)                                                                                 (b)
                           100                                                                                  100
                                           *                                                                                   **

                           90                                                                                   90
      MRL thickness (μm)

                                                                                           MRL thickness (μm)
                           80                                                                                   80

                           70                                                                                   70
                                                           NS                                                                                       NI

                           60                                                                                   60
                                 Baseline 0.5    1.5    3      6     9    12   18     24                              Baseline 0.5    1.5    3      6     9    12   18   24
                                                Post-operative period (months)                                                       Post-operative period (months)
                                                         (c)                                                                                 (d)

Figure 5: Mean thicknesses of the middle retinal layer (MRL) are plotted for the MH eyes treated with ILM peeling. In the temporal/
superior (a), temporal/inferior (b), nasal/superior (c), and nasal/inferior quadrants (d), the MRL of the treated eyes is thicker at 0.5 months
with significant difference from that of the baseline (preoperative eyes). In the temporal quadrants, the MRL is thinner with significant
difference from that of the baseline after the month 18. MH, macular hole; ILM, internal limiting membrane; TS, temporal/superior; TI,
temporal/inferior; NS, nasal/superior; NI, nasal/inferior. Asterisks represent significant differences between the control and operated eyes.
 ∗
   P < 0.05, ∗∗P < 0.005.

temporal quadrants (Figures 5(a) and 5(b)), the MRL was                                                To investigate how MH sizes affected the changes of the
significantly thicker than that of the baseline values at 0.5                                       retinal thicknesses postoperatively, we conducted same
months (P < 0.05 − 0.005). Then it gradually decreased with                                        analysis after classifying the patients into two groups: the
a significant reduction at 18 and 24 months compared to that                                        large MH group (>400 μm minimum diameter) and the
of the baseline (P < 0.05 − 0.005.                                                                 small MH group (≦400 μm). We could not find any sig-
     In the nasal quadrants (Figures 5(c) and 5(d)), there was                                     nificant differences in the thickness changes in the TRL, IRL,
a significant increase of the MRL thickness at 0.5 months                                           MRL, and ORL between the two groups.
(P < 0.05 − 0.005). Thereafter, the MRL thickness decreased
for 1.5 months without a sequential thinning.                                                      4. Discussion
                                                                                                   To the best of our knowledge, the present study is the first to
3.5. Mean Thickness of Outer Retinal Layer (ORL). The mean                                         determine the sequential and long-term changes in thickness
ORL thicknesses are plotted against the postoperative times                                        of each retinal layer using thickness maps of the macular area
for each quadrant to assess chronological changes (Figure 6).                                      following MH closure with ILM peeling. The results dem-
There was a significant decrease of the ORL thickness that                                          onstrated that the thickness of each retinal layer changed
peaked at 0.5 months in all quadrants except for the NS                                            with increasing postoperative times.
quadrant (P < 0.05 for NI; P < 0.0001 for TS and TI) followed
by a quick return to the baseline values. The ONL thicknesses                                      4.1. Thinning of Temporal Retina. Baba et al. reported a
were slightly thicker than the baseline values at 1.5 months                                       thinning of the GCC after MH surgery and showed that the
without statistical significance.                                                                   thinning progressed until 6 months postoperatively [26]. Our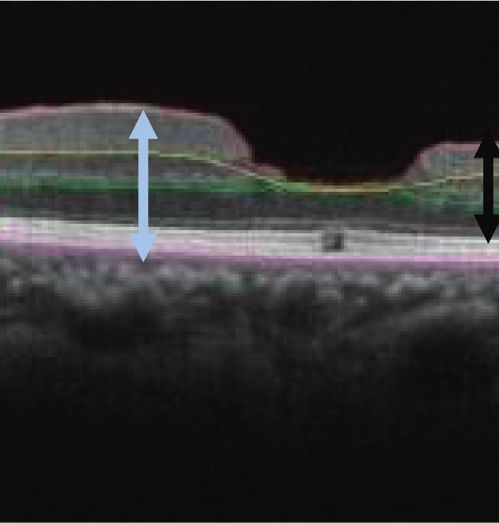
Journal of Ophthalmology                                                                                                                                                    7

                           160                                                                                160
                                                          TS                                                                                       TI

                           150                                                                                150
      ORL thickness (μm)

                                                                                         ORL thickness (μm)
                           140            ***                                                                 140            ***

                           130                                                                                130

                           120                                                                                120

                           110                                                                                110
                                 Baseline 0.5    1.5    3      6     9    12   18   24                              Baseline 0.5    1.5    3      6     9    12   18   24
                                                Post-operative period (months)                                                     Post-operative period (months)
                                                        (a)                                                                                (b)
                           160                                                                                160

                           150                                                                                150
      ORL thickness (μm)

                                                                                         ORL thickness (μm)
                           140                                                                                140             *

                           130                                                                                130

                           120                                                                                120
                                                          NS                                                                                       NI
                           110                                                                                110
                                 Baseline 0.5    1.5    3      6     9    12   18   24                              Baseline 0.5    1.5    3      6     9    12   18   24
                                                Post-operative period (months)                                                     Post-operative period (months)
                                                        (c)                                                                                (d)

Figure 6: Mean thicknesses of the outer retinal layer (ORL) are plotted for the MH eyes treated with ILM peeling. In the temporal/superior
(a), temporal/inferior (b), nasal/superior (c), and nasal/inferior quadrants (d), the ORL thickness of the treated eyes decreased at the month
0.5 with significant difference from that of the baseline (preoperative eyes) in all quadrants except for the NS. MH, macular hole; ILM,
internal limiting membrane; TS, temporal/superior; TI, temporal/inferior; NS, nasal/superior; NI, nasal/inferior. Asterisks represent
significant differences between the control and operated eyes. ∗P < 0.05, ∗∗P < 0.0001.

long-term observations demonstrated that the temporal IRL                                        [31, 32], which suggests that not only the IRL but also the
thickness progressively decreased until 6 months and then                                        ORL and MRL are displaced toward the optic nerve head.
remained stable for 24 months. Because a progressive thin-                                           The ILM plays an important role in maintaining the
ning was also seen in the MRL for at least 6 months, the                                         rigidity of the retina [34, 35]. After ILM peeling, the loss of
thinning of the TRL in the temporal retina was due to a                                          the retinal rigidity is supposed to contribute to the shrinkage
thinning of both the IRL and MRL. Because the ILM is the                                         of the retinal nerve fibers resulting in the retinal displace-
basement membrane of the Müller cells, Spaide suggested that                                    ment toward the optic nerve head. Because the displacement
the trauma and healing process of the Müller cells may result                                   toward the optic nerve head is greater for the temporal retina
in a dimpling of the inner retina [28]. However, this cannot be                                  than the nasal retina [29, 32], there should be a displacement
the sole reason why the retinal thinning takes place pre-                                        of the retinal cells toward the optic nerve head possibly
dominantly in the temporal retina in spite of the peeling of the                                 resulting in the thinning of the temporal retina. Imamura
ILM completely around the fovea. There may be other factors                                      and Ishida have demonstrated that the size of the MH was
that contribute to the thinning of the temporal retina.                                          correlated with the temporal retinal thinning, and they
    Recent studies have tracked the postoperative move-                                          suggested that the retinal movement toward the optic disc
ments of the retinal vessels, and the results showed that the                                    contributed to the thinning of the temporal retina [36]. It
retina was displaced toward the optic nerve head after ILM                                       would be interesting to investigate the relationship between
peeling [29–32]. In addition, there are also reports that the                                    retina movement and changes of the retinal thickness in
fovea is displaced toward the optic disc after ILM peeling                                       more detail even though we could not find any significant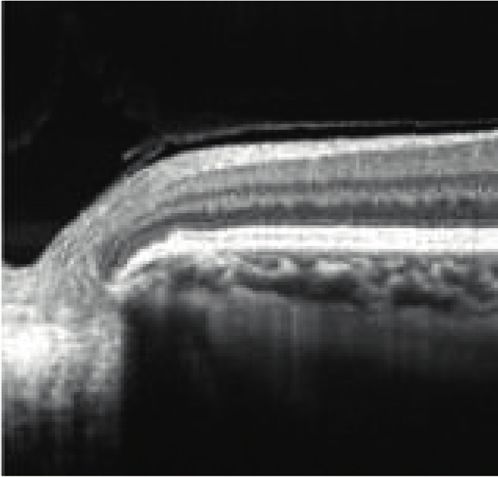
8                                                                                                             Journal of Ophthalmology

differences in the thickness changes of each retinal layer               maps demonstrated that the IRL and MRL thinning con-
between the large and small MH groups.                                  tributes to the total thickness reduction in the temporal
                                                                        parafoveal region following ILM peeling. Transient changes
                                                                        of the MRL and ORL thicknesses were seen as early as 2
4.2. Transient Increase and Decrease of Retinal Thicknesses.            weeks postoperatively. The ILM peeling affects not only the
A transient increase of the retinal thickness relative to the           inner retina but also the middle and outer retinae in the
baseline values was found for the MRL at the early post-                parafoveal region.
operative times that corresponded to the transient thinning
of the ORL at 0.5 months. It has been reported that it takes at
least 12 months for the foveal microstructures to be restored
                                                                        Data Availability
following MH surgery [37]. Therefore, the restoration                   The data used to support the findings of this study are
cannot explain the transient changes of the ORL and MRL at              available from the corresponding author upon request.
the earlier postoperative periods. The ILM is the basement
membrane of the Müller cells that extend from the inner to
                                                                        Ethical Approval
the outer retina. Therefore, physical stress induced by sur-
gical procedures such as ILM peeling could influence the                 In a statement about the conformity with authors infor-
Müller cell throughout all retinal layers possibly causing             mation, Institutional Review Board of Dokkyo Medical
inflammation and gliosis. These pathological changes may                 University Saitama Medical Center approved this study.
contribute to the transient changes of the retinal thickness of
all retinal layers.                                                     Conflicts of Interest
                                                                        The authors have no financial support or financial conflicts
4.3. Differences from Previous Studies. The results of earlier
                                                                        of interest in design and conduct of study, collection,
studies demonstrated that the outer retina thickened at 6
                                                                        management, analysis and interpretation of data, and
months after ILM peeling in the parafoveal and perifoveal
                                                                        preparation, review, or approval of the paper.
regions in the temporal retina [25, 33]. In contrast, our results
showed a transient decrease of the ORL thickness at 0.5 months
followed by a slight nonsignificant increase at 1.5 months, and          Authors’ Contributions
it returned to the baseline level thereafter. In earlier studies, the   This study was conducted by Atsushi Tada. Atsushi Tada,
transient and slight increase of the ORL thickness may have             Shigeki Machida, Yuji Hara, Satoshi Ebihara, Masahiko
been detected. Alternatively, in these studies, the borders of the      Ishizuka, and Mana Gonmori participated in data analysis
outer nuclear layer thickness may have been different from               and discussion on drafting the manuscript. All patients were
what we designated the ORL thickness as the thickness from              operated and followed up by Shigeki Machida. The study was
the outer nuclear layer to the RPE.                                     designed by Shigeki Machida.

4.4. Limitations of This Study. Several limitations of this study       Acknowledgments
can be raised. First, because this study was conducted at a
single center, we were able to study only a small number of             The authors thank Professor Emeritus Duco Hamasaki of the
patients. However, as surgical devices and surgeons remained            Bascom Palmer Eye Institute for discussions and for editing
unchanged throughout the study, variations in the surgical              the manuscript.
procedures were minimal. Second, the retrospective nature of
the study may have weakened the strength of the evidence                References
although the patients were followed periodically. Third, the
                                                                         [1] J. D. M. Gass, “Idiopathic senile macular hole. its early stages
retinal area of the ILM peeling was different among the pa-                   and pathogenesis,” Archives of Ophthalmology, vol. 106, no. 5,
tients, while the diameter of the ILM peeled area was intended               pp. 629–639, 1988.
to be 3-disc diameters. Finally, we did not evaluate the retinal         [2] J. D. M. Gass, “Reappraisal of biomicroscopic classification of
function along with retinal morphology. It would have been                   stages of development of a macular hole,” American Journal of
interesting to determine the functional changes using the focal              Ophthalmology, vol. 119, no. 6, pp. 752–759, 1995.
macular electoretinography (fmERG) and determine the sig-                [3] M. R. Hee, C. A. Puliafito, C. Wong et al., “Optical coherence
nificance of the correlations between the retinal thickness of                tomography of macular holes,” Ophthalmology, vol. 102, no. 5,
each retinal layer and the fmERG. This is especially important               pp. 748–756, 1995.
because the fmERGs can assess the function of the macular                [4] A. Gaudric, B. Haouchine, P. Massin, M. Paques, P. Blain, and
                                                                             A. Erginary, “Macular hole formation: new data provided by
region in a layer-by-layer method [38–40].
                                                                             optical coherence tomography,” Archives of Ophthalmology,
                                                                             vol. 117, no. 6, pp. 744–751, 1999.
5. Conclusions                                                           [5] S. Kishi and H. Takahashi, “Three-dimensional observations
                                                                             of developing macular holes,” American Journal of Oph-
Long-term longitudinal observations can show the changes                     thalmology, vol. 130, no. 1, pp. 65–75, 2000.
in the thickness of each retinal layer postoperatively. The              [6] M. Hangai, Y. Ojima, N. Gotoh et al., “Three-dimensional
layer-by-layer analysis using OCT-determined thickness                       imaging of macular holes with high-speed optical coherence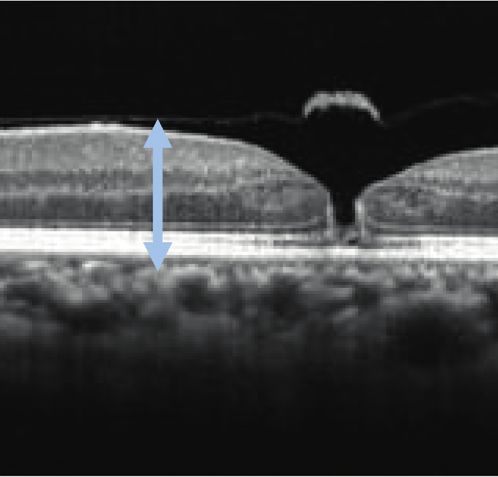
Journal of Ophthalmology                                                                                                                     9

       tomography,” Ophthalmology, vol. 114, no. 4, pp. 763–773,           [22] Y. Ito, H. Terasaki, A. Takahashi, T. Yamakoshi, M. Kondo,
       2007.                                                                    and M. Nakamura, “Dissociated optic nerve fiber layer ap-
 [7]   J. D. M. Gass, “Müller cell cone, an overlooked part of the             pearance after internal limiting membrane peeling for idio-
       anatomy of the fovea centralis: hypothesis concerning its role           pathic macular holes,” Ophthalmology, vol. 112, no. 8,
       in the pathogenesis of macular hole and foveomacular reti-               pp. 1415–1420, 2005.
       noschisis,” Archives of Ophthalmology, vol. 117, no. 6,             [23] K. Kumagai, M. Hangai, E. Larson, and N. Ogino, “Pro-
       pp. 821–823, 1999.                                                       gressive changes of regional macular thickness after macular
 [8]   N. E. Kelly and R. T. Wendel, “Vitreous surgery for idiopathic           hole surgery with internal limiting membrane peeling,” In-
       macular holes. results of a pilot study,” Archives of Oph-               vestigative Ophthalmology & Visual Science, vol. 54, no. 7,
       thalmology, vol. 109, no. 5, pp. 654–659, 1991.                          pp. 4491–4497, 2013.
 [9]   R. T. Wendel, A. C. Patel, N. E. Kelly, T. C. Salzano,              [24] K. Ohta, A. Sato, and E. Fukui, “Asymmetrical thickness of
       J. W. Wells, and G. D. Novack, “Vitreous surgery for macular             parafoveal retina around surgically closed macular hole,”
       holes,” Ophthalmology, vol. 100, no. 11, pp. 1671–1676, 1993.            British Journal of Ophthalmology, vol. 94, no. 11,
[10]   H. L. Brooks Jr, “Macular hole surgery with and without                  pp. 1545-1546, 2010.
       internal limiting membrane peeling,” Ophthalmology,                 [25] K. Ohta, A. Sato, and E. Fukui, “Retinal thickness in eyes with
       vol. 107, no. 10, pp. 1939–1948, 2000.                                   idiopathic macular hole after vitrectomy with internal lim-
[11]   N. Lois, J. Burr, J. Norrie et al., “Internal limiting membrane          iting membrane peeling,” Graefe’s Archive for Clinical and
       peeling versus no peeling for idiopathic full-thickness macular          Experimental Ophthalmology, vol. 251, no. 5, pp. 1273–1279,
       hole: a pragmatic randomized controlled trial,” Investigative            2013.
       Ophthalmology & Visual Science, vol. 52, no. 3, pp. 1586–1592,      [26] T. Baba, S. Yamamoto, R. Kimoto, T. Oshitari, and E. Sato,
       2011.                                                                    “Reduction of thickness of ganglion cell complex after internal
[12]   K. Kadonosono, N. Itoh, E. Uchio, S. Nakamura, and S. Ohno,              limiting membrane peeling during vitrectomy for idiopathic
       “Staining of internal limiting membrane in macular hole                  macular hole,” Eye, vol. 26, no. 9, pp. 1173–1180, 2012.
       surgery,” Archives of Ophthalmology, vol. 118, no. 8,               [27] T. Baba, E. Sato, T. Oshitari, and S. Yamamoto, “Regional
       pp. 1116–1118, 2000.                                                     reduction of ganglion cell complex after vitrectomy with
[13]   S. E. Burk, A. P. Da Mata, M. E. Snyder, R. H. Rosa Jr, and              internal limiting membrane peeling for idiopathic macular
       R. E. Foster, “Indocyanine green-assisted peeling of the retinal         hole,” Journal of Ophthalmology, vol. 2014, Article ID 372589,
       internal limiting membrane,” Ophthalmology, vol. 107, no. 11,            7 pages, 2014.
                                                                           [28] R. F. Spaide, ““Dissociated optic nerve fiber layer appearance”
       pp. 2010–2014, 2000.
                                                                                after internal limiting membrane removal is inner retinal
[14]   H. Enaida, T. Hisatomi, Y. Goto et al., “Preclinical investi-
                                                                                dimpling,” Retina, vol. 32, no. 9, pp. 1719–1726, 2012.
       gation of internal limiting membrane staining and peeling
                                                                           [29] M. Ishida, Y. Ichikawa, R. Higashida, Y. Tsutsumi,
       using intravitreal brilliant blue G,” Retina, vol. 26, no. 6,
                                                                                A. Ishikawa, and Y. Imamura, “Retinal displacement toward
       pp. 623–630, 2006.
                                                                                optic disc after internal limiting membrane peeling for idi-
[15]   H. Enaida, T. Hisatomi, Y. Hata et al., “Brilliant blue G se-
                                                                                opathic macular hole,” American Journal of Ophthalmology,
       lectively stains the internal limiting membrane/brilliant blue
                                                                                vol. 157, no. 5, pp. 971–977, 2014.
       G-assisted membrane peeling,” Retina, vol. 26, no. 6,
                                                                           [30] K. Kawano, Y. Ito, M. Kondo et al., “Displacement of foveal
       pp. 631–636, 2006.
                                                                                area toward optic disc after macular hole surgery with internal
[16]   E. A. Fraser, R. A. Cheema, and M. A. Roberts, “Triamcin-
                                                                                limiting membrane peeling,” Eye, vol. 27, no. 7, pp. 871–877,
       olone acetonide-assisted peeling of retinal internal limiting            2013.
       membrane for macular surgery,” Retina, vol. 23, no. 6,              [31] T. Akahori, T. Iwase, K. Yamamoto et al., “Macular dis-
       pp. 883-884, 2003.                                                       placement after vitrectomy in eyes with idiopathic macular
[17]   K. Kumagai, M. Furukawa, N. Ogino, E. Larson, and                        hole determined by optical coherence tomography angiog-
       A. Uemura, “Long-term outcomes of macular hole surgery                   raphy,” American Journal of Ophthalmology, vol. 189,
       with triamcinolone acetonide-assisted internal limiting                  pp. 111–121, 2018.
       membrane peeling,” Retina, vol. 27, no. 9, pp. 1249–1254,           [32] K. Goto, T. Iwase, T. Akahori, K. Yamamoto, E. Ra, and
       2007.                                                                    H. Terasaki, “Choroidal and retinal displacements after vit-
[18]   H. Nomoto, F. Shiraga, H. Yamaji et al., “Macular hole surgery           rectomy with internal limiting membrane peeling in eyes with
       with triamcinolone acetonide-assisted internal limiting                  idiopathic macular hole,” Scientific Reports, vol. 26, no. 9,
       membrane peeling: one-year results,” Retina, vol. 28, no. 3,             p. 17568, 2019.
       pp. 427–432, 2008.                                                  [33] M. Y. Faria, N. P. Ferreira, D. M. Cristóvao, S. Mano,
[19]   R. Tadayoni, M. Paques, P. Massin, S. Mouki-Benani, J. Mikol,            D. C. Sousa, and M. Monteiro-Grillo, “Tomographic struc-
       and A. Gaudric, “Dissociated optic nerve fiber layer ap-                  tural changes of retinal layers after internal limiting mem-
       pearance of the fundus after idiopathic epiretinal membrane              brane peeling for macular hole surgery,” Ophthalmic
       removal,” Ophthalmology, vol. 108, no. 12, pp. 2279–2283,                Research, vol. 59, no. 1, pp. 24–29, 2018.
       2001.                                                               [34] G. Wollensak, E. Spoerl, G. Grosse, and C. Wirbelauer,
[20]   R. Tadayoni, I. Svorenova, A. Erginay, A. Gaudric, and                   “Biomechanical significance of the human internal limiting
       P. Massin, “Decreased retinal sensitivity after internal limiting        lamina,” Retina, vol. 26, no. 8, pp. 965–968, 2006.
       membrane peeling for macular hole surgery,” British Journal         [35] P. B. Henrich, C. A. Monnier, W. Halfter et al., “Nanoscale
       of Ophthalmology, vol. 96, no. 12, pp. 1513–1516, 2012.                  topographic and biomechanical studies of the human internal
[21]   Y. Mitamura, T. Suzuki, T. Kinoshita, N. Miyano, A. Tashimo,             limiting membrane,” Investigative Opthalmology & Visual
       and K. Ohtsuka, “Optical coherence tomographic findings of                Science, vol. 53, no. 6, pp. 2561–2570, 2012.
       dissociated optic nerve fiber layer appearance,” American            [36] Y. Imamura and M. Ishida, “Retinal thinning after internal
       Journal of Ophthalmology, vol. 137, no. 6, pp. 1155-1156, 2004.          limiting membrane peeling for idiopathic macular hole,”
10                                                                       Journal of Ophthalmology

       Japanese Journal of Ophthalmology, vol. 62, no. 2, pp. 158–162,
       2018.
[37]   Y.-C. Chang, W.-N. Lin, K.-J. Chen et al., “Correlation be-
       tween the dynamic postoperative visual outcome and the
       restoration of foveal microstructures after macular hole
       surgery,” American Journal of Ophthalmology, vol. 160, no. 1,
       pp. 100–106, 2015.
[38]   Y. Miyake, K. Yanagida, T. Kondo, and I. Ota, “Subjective
       scotometry and recording of local electroretinogram and
       visual evoked response system with television monitor of the
       fundus,” Japanese Journal of Ophthalmology, vol. 25, no. 4,
       pp. 438–448, 1981.
[39]   Y. Miyake, “Studies on local macular ERG,” Nippon Gakkai
       Zasshi, vol. 92, no. 9, pp. 1419–1449, 1988.
[40]   S. Machida, T. Nishimura, T. Ohzeki, K.-I. Murai, and
       D. Kurosaka, “Comparisons of focal macular electroretino-
       grams after indocyanine green-, brilliant blue G-, or triam-
       cinolone acetonide-assisted macular hole surgery,” Graefe’s
       Archive for Clinical and Experimental Ophthalmology,
       vol. 255, no. 3, pp. 485–492, 2017.
You can also read