Loomis Sayles Core Plus Bond Fund: Navigating Dynamic Markets with Tactical Flexibility - Natixis Investment ...
←
→
Page content transcription
If your browser does not render page correctly, please read the page content below

Loomis Sayles Core Plus Bond Fund:
                                                Navigating Dynamic Markets with
                                                Tactical Flexibility

   WRITTEN BY                                    THE GLOBAL CREDIT CYCLE IS A PERPETUAL FORCE
                                                 INFLUENCING INTEREST RATES, CREDIT AVAILABILITY
   THE LOOMIS SAYLES CORE PLUS                   AND CAPITAL MARKETS. FOR CORE PLUS MANAGERS
   BOND TEAM                                     WHO SEEK TO GENERATE TOTAL RETURN BY BALANCING
                                                 LIQUIDITY AND RISK, THESE UNDULATIONS POSE A
                                                 CLEAR CHALLENGE.

                                                 In our view, navigating dynamic market cycles demands
                                                 a flexible mandate and the ability to combine rigorous
                                                 macroeconomic insight with security-specific fundamental
                                                 research. The Loomis Sayles Core Plus Bond Fund is a
                                                 benchmark-aware product that seeks to add return in stable-
                                                 to-improving risk markets and preserve principal during
                                                 adverse markets using tactical portfolio allocations.
      MANAGER
      INSIGHT

JULY 2021       For Institutional and Investment Professional Use Only. Not For Further Distribution.
KEY TAKEAWAYS

• The Loomis Sayles Core Plus Bond Fund is a benchmark-aware product that seeks to add return in stable-to-
   improving risk markets and preserve principal during adverse markets using tactical portfolio allocations.

• Our top-down assessment of the global macroeconomic environment is used to determine sector, security, yield
   curve and duration positions within the core portion of the portfolio, as well as plus sector exposure.

• Relative and absolute risks are monitored continuously, and our ability to position similar to or away from the
   benchmark is central to risk management efforts.

When market conditions are constructive and risk/return measures warrant, the fund typically pursues a yield
advantage over the Bloomberg Barclays US Aggregate Bond Index through allocations to “plus sectors,” such as
high yield credit and non-US dollar. During periods that call for more defensive positioning, the fund generally
adopts a higher-quality, more benchmark-like posture. The challenge lies in determining where to deploy
capital at any given time. As such, our investment process begins with a top-down assessment of the global
macroeconomic environment and capital market drivers—a view that we use to determine sector, security, yield
curve and duration positions within the core portion of the portfolio as well as exposure to the plus sectors.

With this nimble approach, the Loomis Sayles Core Plus Bond Fund has achieved strong returns through a
range of economic and market environments, as shown in the chart below.

   LOOMIS SAYLES CORE PLUS BOND FUND CLASS Y SHARES
   Average annual total returns as of 30 June 2021

     Fund        Bloomberg Barclays US Aggregate Bond Index

         ONE YEAR                                          THREE YEAR                                       FIVE YEAR                                        TEN YEAR

                                                      6.20%
                                                                     5.34%
                                                                                                       4.46%                                             4.66%
                                                                                                                       3.03%                                              3.39%
    2.28%

                   -0.33%

Performance data shown represents past performance and is no guarantee of future results. Investment return and value will vary and you may have
a gain or loss when shares are sold. Current performance may be lower or higher than quoted. For most recent month-end performance,
visit www.loomissayles.com.
Performance for other share classes will be greater or less than shown based on differences in fees and sales charges. Performance for periods greater than one year is
annualized. Returns reflect changes in share price and reinvestment of dividends and capital gains, if any. You may not invest directly in an index.
Gross expense ratio 0.47% (Class Y). Net expense ratio 0.47%. As of the most recent prospectus, the investment advisor has contractually agreed to waive fees and/or
reimburse expenses once the expense cap of the fund has been exceeded. This arrangement is set to expire on 31 January 2022. When an expense cap has not been exceeded,
the fund may have similar expense ratios and/or yields. Class Y shares are available to certain institutional investors only; minimum initial investment of $100,000.
The Class Y inception date is 30 December 1994. Class Y shares are sold to eligible investors without a sales charge; other Classes are available for purchase.
JULY 2021                       For Institutional and Investment Professional Use Only. Not For Further Distribution.                                                             2
The Importance of a Macro View
                                                                        To confidently position the portfolio, we must first understand the macroeconomic
                                                                        themes shaping the investment landscape. Drawing on Loomis Sayles’ deep
          GLOBAL CREDIT CYCLE                                           macroeconomic and sovereign research capabilities, we continuously assess key
                                                                        global macro factors (GDP growth, monetary and fiscal policy, inflation, supply/
                              RECO
                                     VER
                                                                        demand dynamics of government bond markets, credit availability and politics),
                                           Y

                                                                        which are typically driven by the world’s major developed economies. Our view of
        R
        AI

                                                                        the overall global credit cycle helps us determine a balance between the goals
     EP
 T R
CREDI

                                                                        of return maximization and capital preservation and, accordingly, how to position
                                                                        the portfolio relative to the benchmark (up or down in quality, liquidity and price
                                                              ANS EXP

                                                                        transparency).
                                                                  IO
                                                              N
                                                          to
                                                         LA

                                                    TE

                                                                        While one or two major economies tend to lead the global credit cycle, individual
                                               CY
             RN                           CL
                  TU                  E
                       DOWN

                                                                        economies do not progress through the cycle in lockstep. Our ability to identify
                                                                        “mini cycles” and assess credit conditions in individual economies is critical. We
                                                                        rely on insights from our sovereign research team, whose knowledge of local
                                                                        markets helps us pinpoint where opportunities and risks may exist.

    Tactical Sector Allocation
    Once our macro and sovereign research groups have identified credit cycle themes, tactical use of sectors—
    including out-of-benchmark exposure—allows us to target opportunities using what we believe are the right
    instruments. The fund has the flexibility to invest up to 20% in high yield (including bank loans) and up to 10%
    in non-US-dollar investments (including currencies and emerging markets debt).

    When making sector allocations, we are mindful of a cycle’s idiosyncrasies: the best strategy for one period
    of credit repair, for example, may not be optimal during the next phase of credit repair. To make informed
    decisions, we draw on our own experience and firm resources, including specialized sector teams (asset
    class strategy groups comprised of portfolio managers, traders and research analysts). We then implement
    our sector strategy through fundamental bottom-up security selection. In partnership with Loomis Sayles’
    credit, sovereign and securitized research analysts, we identify what we think are the best securities and
    appropriate position sizes based on issuer volatility, relative valuation and liquidity.

 JULY 2021                                     For Institutional and Investment Professional Use Only. Not For Further Distribution.                          3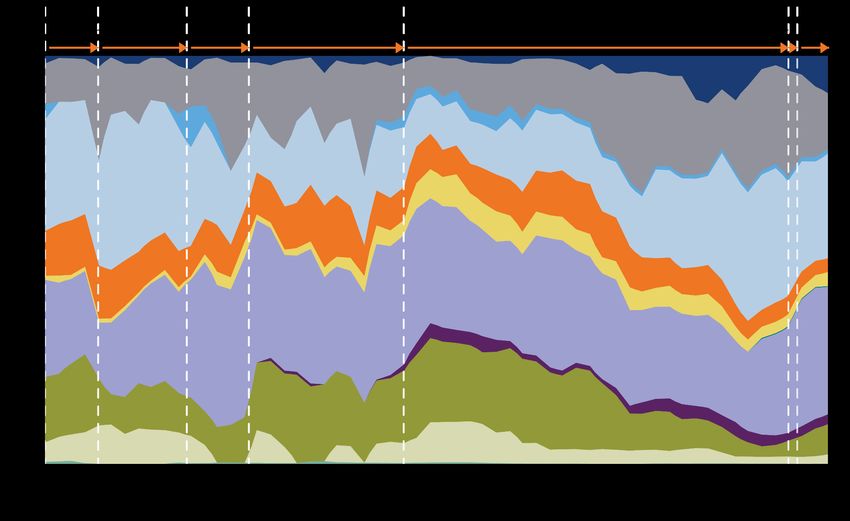
The chart below illustrates the Loomis Sayles Core Plus Bond Fund’s tactical use of sectors from 31 March
2006 until 31 December 2020. To help enhance total return potential and minimize risk, the fund is generally
positioned similar to the Bloomberg Barclays US Aggregate Bond Index during economic expansions and
downturns, while credit and non-dollar exposure is added during periods of repair and recovery.

                                                             CREDIT                                                           CREDIT
                                      EXPANSION   DOWNTURN   REPAIR    RECOVERY                          EXPANSION   DOWNTURN REPAIR
 LOOMIS SAYLES CORE
 PLUS BOND FUND
 SECTOR ALLOCATION
 OVER TIME
 Source: Loomis Sayles.
 Data as of 31 December 2020.
 Due to active management,
 characteristics will evolve
 over time.

   Cash & Equivalents
   US Treasury
   US Agency
   Agency MBS
   CMBS
   ABS / RMBS
   Investment Grade Credit
   USD $ Pay Emerging Market
   Non-US Dollar (ex CAD) Pay
   High Yield Credit
   Bank Loans
   Convertibles
   Preferred / Equity

 Plus Sectors: The Tool Kit
 Though these sectors are often thought of as increased risk/reward areas, we think plus sectors can help reduce
 portfolio risk. Overly constrained mandates can force managers to take less attractive positions because of
 limited flexibility, thereby introducing unintended risk into a portfolio. Plus sectors allow us to scour a broader
 opportunity set when seeking what we view as the best investment options for the fund. However, because these
 sectors can introduce tracking error, we require a higher potential return per unit of risk before we will invest
 out of benchmark. Allocations to plus sectors, detailed in the chart on the following page, have contributed
 approximately 40% of the fund’s total return over a market cycle.i

JULY 2021                For Institutional and Investment Professional Use Only. Not For Further Distribution.              4
PRO-CYCLICAL AND
 DEFENSIVE USE OF
 PLUS SECTORS
 Source: Loomis Sayles.
 Data as of 31 December
 2020.
 Due to active management,
 characteristics will evolve
 over time.

    Brazilian Real
    Swedish Krona
    Singapore Dollar
    New Zealand Dollar
    Australian Dollar
    Norwegian Dollar
    Icelandic Krona
    Swiss Franc
    Japanese Yen
    Uruguay Peso
    Philippine Peso
    Mexican Peso                       We employ plus sectors to construct pro-cyclical, offensive portfolio positions
    EURO
    EURO (short position)
                                       and to help defend against specific market risks, as described in the following
    Canadian Dollar                    case studies.
    TIPS
    Bank Loans
    High Yield Developed Market Debt
                                       High Yield Corporate Bonds & Bank Loans: High yield can be attractive during
    HY Emerging Market Deby            periods of the credit cycle that we characterize as repair, recovery and expansion.
    Core
                                       It generally offers a yield advantage over many other fixed income sectors and
                                       can benefit from capital appreciation when credit spreads tighten. Because high
                                       yield bonds generally have a yield cushion, they can exhibit reduced duration
                                       sensitivity and may serve as a defensive hedge against rising rates. High yield
                                       bonds are lower in the capital structure than bank loans, and their increased
                                       credit and liquidity risk make them high-beta assets. Bank loans hold a senior
                                       position in the capital structure, and while this can limit their upside potential
                                       during recoveries, it is a valuable defensive credit feature in later-stage economic
                                       expansions. Bank loans’ floating rate coupons can be beneficial when rates rise.

JULY 2021                   For Institutional and Investment Professional Use Only. Not For Further Distribution.             5
HIGH YIELD & BANK LOAN CASE STUDY: 2009-2013
2009: CREDIT REPAIR/RECOVERY 2010-2011: RECOVERY 2012-2013: LATE-STAGE RECOVERY
STRATEGY Maximize market exposure and favor Emphasize specific risk and credit- Seek to mitigate interest rate risk while
THEMES more defensive industries. sensitive industries that are typical still maximizing portfolio yield. Focus
late-cycle recovery stories. on late-cycle credits and industries.
STRATEGY Emphasized long duration, lower- Began moving up in quality. Used Increased bank loan allocation. Sought
IMPLENTATION quality HY. Focused on companies higher-quality HY issues with floating coupon as part of strategy
with stable, liquid balance sheets intermediate and shorter durations to seeking to maximize yield while
and sectors that appeared well help capture incremental yield while minimizing duration in anticipation of
positioned to benefit from recovery as reducing exposure to credit higher Treasury yields.
part of strategy to maximize duration and duration risk.
contribution, price appreciation
potential and yield.
Non-US Investments: Today, roughly 76% of global GDP comes from outside the US.ii Our guidelines allow
us to follow economic growth opportunities around the world and to take targeted exposure outside US
fixed income markets. When the risk/return prospects appear particularly compelling, we deploy non-US
investments offensively to emphasize directional themes within the global credit cycle. We can also use the
allocation defensively to offset or hedge against other risk exposures in the portfolio. The Loomis Sayles Core
Plus Bond Fund is able to invest directly in global currencies, non-dollar corporate or sovereign bonds, or
dollar-denominated bonds of non-US issuers (Yankee bonds).
– Currencies: Currencies can be utilized to express pro-cyclical or defensive views of global markets, to go
up or down in quality and liquidity, and to take advantage of price dislocations or perceived overreactions in the
market.
– Non-dollar-denominated bonds & dollar-denominated bonds of non-US issuers: We can use these
tools to invest in countries or companies whose balance sheets, bond yields, or bond market supply/demand
dynamics appear attractive.
NON-US CASE STUDY: 2004-2013
2004-2006: EXPANSION 2007-2008: DOWNTURN 2009-2013: RECOVERY
STRATEGY Gradually move away from US and into Assume a much more defensive Follow fiscal and monetary policy
THEMES markets still enjoying solid economic posture in both US and non-US portfolio responses around the globe. Focus
growth. holdings. on early-recovery stories (US) and
countries tied to cyclical recovery
(Canada and parts of Latin America and
Asia).
STRATEGY Began in US-dollar-denominated and Entered into long yen position as Sought currencies of growing
IMPLEMENTATION pro-cyclical non-US-dollar investments a partial hedge in anticipation of a economies tied to the global recovery
(Australian and New Zealand dollars, risk-off period. Yen was fundamentally (Mexican and Philippine pesos,
Swedish krona). Defensively moved into undervalued and had been used as a Canadian and Australian dollars). In
the Norwegian krone, euro and Swiss funding currency for carry trades. We later 2012 and early 2013, believed
franc as US economic fundamentals felt yen could rally sharply if investors European Central Bank support
deteriorated. unwound the carry trade. would be sufficient to help peripheral
European bond yields (Spain, Italy and
Portugal) compress toward those of
core Europe.
JULY 2021 For Institutional and Investment Professional Use Only. Not For Further Distribution. 6Risk Management
When managing a benchmark-aware strategy with the goals of preserving principal in adverse markets
and adding excess return in stable-to-improving environments, risk control and downside protection are
paramount. Relative and absolute risks are monitored continuously, and our ability to position similar to or
away from the benchmark is central to risk management efforts. While we do not manage to tracking error,
we are very mindful of the benchmark and add to tracking error only when we feel we are being compensated
to do so. The fund typically targets a minimum 20% allocation to the US government sector. This positioning
helps deliver a source of liquidity and also provides a directional link to interest rate movements, which
informs how we manage portfolio duration and yield curve exposure. In volatile environments, we typically
favor high-quality liquid government securities. During periods of economic repair and recovery, credit
and non-US-dollar exposure can be used to help shorten duration and hedge interest rate risk given their
traditionally low correlation with US Treasurys and agency mortgage-backed securities.
USING TACTICAL FLEXIBILITY TO NAVIGATE RISING RATES
Not all fixed income securities will react the same to changes in US Treasury yields, and we recognize that each bond in a portfolio contributes “sources
of duration” due to its individual characteristics. One way we assess the fund’s interest rate sensitivity is by monitoring its US Treasury holdings’
contribution to duration (Treasury CTD). During periods when we believe interest rates are headed higher, we will tend to shorten Treasury CTD by
underweighting government sectors and overweighting sectors that offer incremental yield. When we believe interest rates are approaching a peak
and may begin to decline, we typically increase Treasury CTD. The chart below shows how the fund’s Treasury CTD changed relative to the 10-year US
Treasury yield over a 18-year period.
3.0 6
-188 bps YTM
2.5 5
US Treasury CTD (LHS) 2.29 years to 2.10 years CTD
10-Year Treasury YTM (RHS) 2.0 4
1.5 3
+75 bps YTM
Source: Loomis Sayles. .38 years to 2.29 years CTD
Data as of 31 December 2020. 1.0 2
0.5 1
- 0
Dec-02
Dec-03
Dec-04
Dec-05
Dec-06
Dec-07
Dec-08
Dec-09
Dec-10
Dec-11
Dec-12
Dec-13
Dec-14
Dec-15
Dec-16
Dec-17
Dec-18
Dec-19
Dec-20
Our tactical approach in managing the Loomis Sayles Core Plus Bond Fund allows us to take advantage of changing market environments.
The chart below shows the Core Plus Bond Fund’s performance during rising rate environments since the fund’s Class Y inception.
20%
16.93%
Core Plus Bond Fund (Class Y) 15
Barclays US Aggregate Bond Index
10
10-Year Treasury Bond
5.93%
Yield Change
5 3.27% 3.52%
2.01% 1.98% 2.43%
0.48%
0
-0.61% -1.14% -0.27% -0.94%
-1.91% -1.91%
-3.24% -3.24%
-5
2.25% 1.68% 1.69% 1.62% 1.56% 1.33% 1.16% 0.65%
30-Sep-98 to 30-May-03 to 31-Jul-16 to 31-Dec-08 to 31-Jul-12 to 29-Dec-95 to 31-Oct-01 to 31-Mar-08 to
31-Jan-00 28-April-06 31-Oct-18 31-Dec-09 31-Dec-13 31-Mar-97 29-Mar-02 30-May-08
Past performance is no guarantee of future results.
The ten worst periods of rising rates have been defined as the non-overlapping periods of worst cumulative rise in 10-year US Treasury yields (Source: Bloomberg)
from the trough in yield (using a 3-year look-back period) during the period of analysis (31 December 1990 to 31 January 2021). Periods that predate the fund’s
Class Y inception of 30 December 1994 have been excluded from this exhibit. Performance for periods less than one year is cumulative, not annualized.
JULY 2021 For Institutional and Investment Professional Use Only. Not For Further Distribution. 7Conclusion Today’s ever-evolving credit cycles and complex global markets demand flexibility. Our benchmark-aware, research-intensive investment style combines macroeconomic insight, changing tactical allocations and security-specific expertise to meet this need. As a portfolio management team, we have managed through multiple global credit cycles and have experienced the dynamic behavior of bond duration, yield curves, currencies and sectors. Drawing on this experience and Loomis Sayles’ research arsenal, we seek to populate the portfolio with what we believe are the best ideas for each unique market environment and deliver principal protection and solid risk-adjusted returns to our investors. This report was originally published in November 2013. We have updated the content as necessary and otherwise believe the information is correct and relevant. About Risk Fixed income securities may carry one or more of the following risks: credit, interest rate (as interest rates rise bond prices usually fall), inflation and liquidity. Mortgage-related and asset-backed securities are subject to the risks of the mortgages and assets underlying the securities. Other related risks include prepayment risk, which is the risk that the securities may be prepaid, potentially resulting in the reinvestment of the prepaid amounts into securities with lower yields. Below investment grade fixed income securities may be subject to greater risks (including the risk of default) than other fixed income securities. Foreign and emerging market securities may be subject to greater political, economic, environmental, credit, currency and information risks. Foreign securities may be subject to higher volatility than US securities due to varying degrees of regulation and limited liquidity. These risks are magnified in emerging markets. Currency exchange rates between the US dollar and foreign currencies may cause the value of the fund’s investments to decline. Inflation-protected securities move with the rate of inflation and carry the risk that in deflationary conditions (when inflation is negative) the value of the bond may decrease. JULY 2021 For Institutional and Investment Professional Use Only. Not For Further Distribution. 8
One Financial Center Boston, MA 02111   www.loomissayles.com

 AUTHORS                        Endnotes
                                i
                                     Loomis Sayles attribution; data from 1 January 2016–31 December 2020. Market cycle
                                     defined as a three- to five-year period.
                                ii
                                     Bloomberg Pro; 2019 World Bank data.

                                Disclosure
                                Bloomberg Barclays US Aggregate Bond Index is an unmanaged index of investment
                                grade bonds with one- to ten-year maturities issued by the US government, its agencies and
                                US corporations. Indexes are unmanaged and do not incur fees. It is not possible to invest
                                directly in an index.
PETER PALFREY, CFA
VP, Portfolio Manager           This paper is provided for informational purposes only and should not be construed as
                                investment advice. Any opinions or forecasts contained herein reflect the subjective judgments
                                and assumptions of the authors only and do not necessarily reflect the views of Loomis, Sayles
                                & Company, L.P. Investment recommendations may be inconsistent with these opinions.
                                There can be no assurance that developments will transpire as forecasted and actual results will
                                be different. Data and analysis does not represent the actual or expected future performance
                                of any investment product. We believe the information, including that obtained from outside
                                sources, to be correct, but we cannot guarantee its accuracy. The information is subject to
                                change at any time without notice.
                                Past market experience is no guarantee of future results.
                                Before investing, consider the fund’s investment objectives, risks, charges, and
RICK RACZKOWSKI                 expenses. Please visit www.loomissayles.com or call us at 800-862-4863 for a
EVP, Portfolio Manager          prospectus and a summary prospectus, if available, containing this and other
                                information. Read it carefully.
                                This information is intended for institutional investor and investment professional use only.
                                It is not for further distribution.
                                Natixis Distribution, LLC (fund distributor, member FINRA|SIPC) and Loomis, Sayles &
                                Company, L.P. are affiliated.
                                LS Loomis | Sayles is a trademark of Loomis, Sayles & Company, L.P. registered in the US
                                Patent and Trademark Office.
                                CFA® and Chartered Financial Analyst® are registered trademarks owned by the CFA
                                Institute.

                                                                                                                 LSWP43-0621
                                                                                                                 Exp. 10/31/21
                                                                                                                 MALR027319
                                                                                                                 1044618.29.1

                  For Institutional and Investment Professional Use Only. Not For Further Distribution.                            9
You can also read


