Luton Food Plan 2018-2022 - www.luton.gov.uk - Luton Borough Council
←
→
Page content transcription
If your browser does not render page correctly, please read the page content below
Luton Food Plan 2018-2022

www.luton.gov.uk
Vision
The Luton Food Plan will raise awareness of the importance of a balanced diet and
good food to improve our residents’ health, the town’s food sustainability and economy.

Our vision is for Luton to be a place where good quality food is available that reflects our
world town, is promoted, provided and celebrated.
Context
Food is an integral part of family and community cohesion and an important part of Luton’s
heritage as a multi-cultural world town. Eating habits are changing with major shifts in work
patterns, food production, food sales and immigration which has led to changes regarding
where we eat, what we eat and how much we eat.

There are more meals eaten outside of the home, eating ‘on the go’, and fewer sit-down
meals, especially as families; consequently, the population consumes foods which are more
likely to be processed, that have higher calories, sugar, fat and salt. Food promotions,
advertising, pricing and product placement has contributed to this shift and has made
choosing healthier options more challenging.

This Plan aims to challenge the current eating culture taking a “systems” approach to
understand and disrupt the underlying causes of poor health and wellbeing through food.
Why do we need a Luton Food Plan?
The reasons why people eat unhealthy diets are complex and associated with issues relating
to food accessibility, affordability, knowledge and skills and culture.

In the UK, after tobacco, diet has the greatest overall impact on health. Risk factors include
diets high in sugar and trans-fats and low in fruit and vegetables. Poor diet and food
intolerances can have an impact on behaviour and affect educational performance especially
children and adolescents1. Poor diet contributes to around 50% of coronary heart disease
and 30% of all cancer deaths, the two biggest causes of death in Luton.

At reception year (4-5-year olds) 75.5% of children are a healthy weight, which drops to
56% at year 6 (10-11-year olds)2. Only 35% of local school pupils and 49.8% of adults3
report eating the recommended “5 a day”, with Luton adults eating less fruit and
vegetables per day on average compared to England (2.4 vs 2.5 respectively). Additionally,
Luton has higher density of fast food outlets 88.6 per 100,000 population compared to the
England average of 88.24.

1 Effects of diet on behaviour and cognition in children. Br J Nutr. 2004 Oct;92 Suppl 2:S227-32
2 NCMP https://fingertips.phe.org.uk/profile/national-child-measurement-
programme/data#page/3/gid/8000011/pat/6/par/E12000006/ati/102/are/E06000032
3 FingerTips PHE https://fingertips.phe.org.uk/search/fruit#page/1/gid/1/pat/6/par/E12000006/ati/102/are/E06000032
4 FingerTips PHE
https://fingertips.phe.org.uk/search/fast%20food#page/3/gid/1/pat/6/par/E12000006/ati/102/are/E06000032/iid/92937/ age/-
1/sex/-1

                                                                                                           1|Page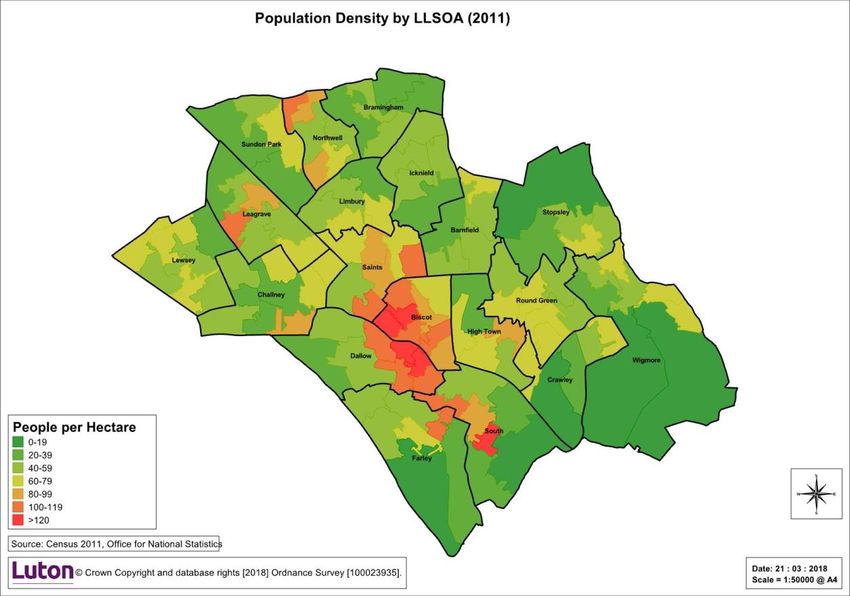
Good nutrition can support people in their educational attainment and learning through
improved concentration having a longer-term impact on employment opportunities.
Growing food to eat and eating together with friends and family is valued by many people.
Health benefits can include the benefits of eating a diet rich in fruit and vegetables, benefits
through the exercise undertaken in working a garden and improved mental wellbeing.
Access to green space is associated with a range of improved health outcomes and income-
related differences in wellbeing are reduced where people have access to green space. An
associated Health Needs Assessment can be seen in Appendix A. A JSNA chapter based on
this Health Needs Assessment will be developed in 2018.
What our residents and stakeholders have said
We undertook an online consultation followed by a range of focus groups to provide further
insight into the issues of food locally. Residents said that they intended to eat healthily
however the unhealthy food environment was too tempting to resist, although there was a
request to provide healthier options. There was a clear passion for greening the borough
and more ‘growing your own’ as a practical and desirable way of getting residents to eat
more fruit and vegetables with the request for guidance on how to do this. There was also
a strong push for reducing fast food outlets around schools, and that schools should do
more on healthy eating. Residents preferred method of communication was through Social
Media, especially YouTube.
Stakeholders agreed with the feedback from residents and felt the development of an
alliance was the best approach to delivering the Food Plan; all pledging their organisational
and individual support. Additionally, there was a strong appetite that Luton should engage
with the national Sustainable Food Cities programme.
Three Priority areas
Our challenge is to work together to make the healthy food choice the easiest choice. We
will work together to agree innovative approaches through the framework of the ‘Luton Food
Plan’ 2017-2022.
Getting our house in order
As a large employer and commissioner of local services, Luton Council and its partners will
be role model organisations for healthier food options in what we procure and offer our own
staff as well as what we procure through our purchasing power.
We will:
LBC catering to provide healthier school meals in schools
Work with schools including a commitment to encourage schools not to allow
children to leave school at lunch time without the express permission of their parents
for lunch to be provided at home
Ensure Children Centres deliver a consistent healthy eating message including a
focus on improving oral health
Deliver a communications campaign on healthy eating in Luton
2|Page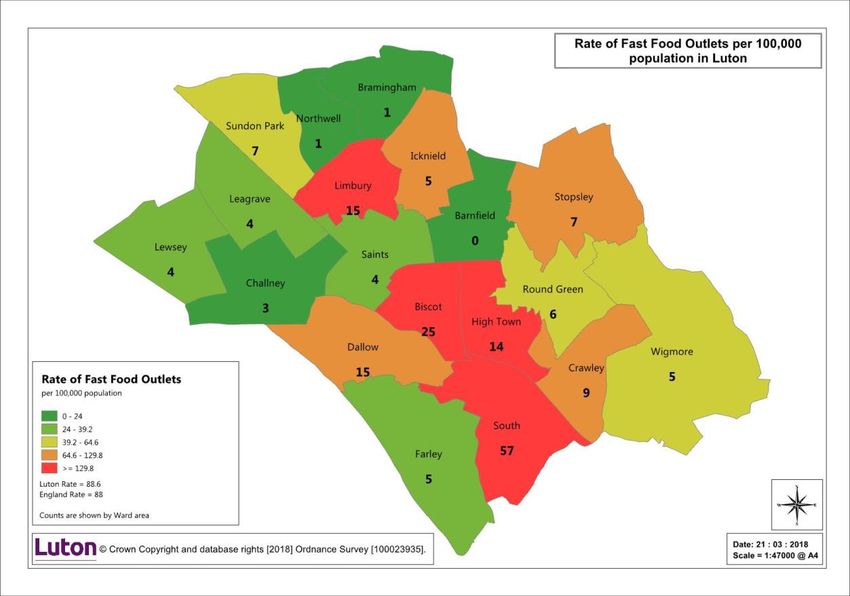
Use our spending power to influence local businesses to improve healthier food
options, for example adding Social Value through contracts
Ensure coordinated approach to messages regarding food waste and healthy eating
Remove unhealthy vending machines from council premises
Adopt food procurement guidance when purchasing food on behalf of the
council (Appendix B), including the use of Fair Trade products where possible
Access to healthier food options
A key element from our analysis and feedback from residents was to provide healthier food
options to reduce the “temptation” to eat unhealthily. The council has a key role in
influencing local businesses in the town, and this plan will state the council’s position on
Food retail (particularly Fast Food) provision in Luton and be a material consideration in
the determination of new planning/premises applications.
We will:
Work with local food outlets on a ‘healthier options’ as partners to reduce sugar, fat
and salt content as well as offering healthier food options.
Use planning and licensing as the function to manage food retail located near to
sensitive uses (Appendix C), particularly around schools and colleges and deliver
breastfeeding welcome scheme.
Greening the Borough / growing your own
This priority seeks to increase access to green space and empower residents to grow their
own fruit and vegetables as well as improving the visual impact of Luton.
We will:
Create a network across the borough to connect the pockets of great work already
happening to drive forward change
Increase the number of community food hubs (including using left over food)
and connect residents to available allotments
Work in partnership with housing to increase the amount of maintained greenspace
for our housed residents
Develop food growing and greening activities as part of the Cultural strategy
Encourage the increase in edible green infrastructure as part of new
and regeneration developments
Support the work of the Luton Food Poverty Network and connect grown produce
with the Food Bank
Governance
This Plan will be overseen by the Luton Food Plan working group and will report into the
Health Inequalities Delivery Board. Whilst all agencies, working in partnership, have a role
to play, effective leadership and coordination of effort is needed. Each partner will take the
lead on the action they have committed to as part of the development of the action plan.
3|Page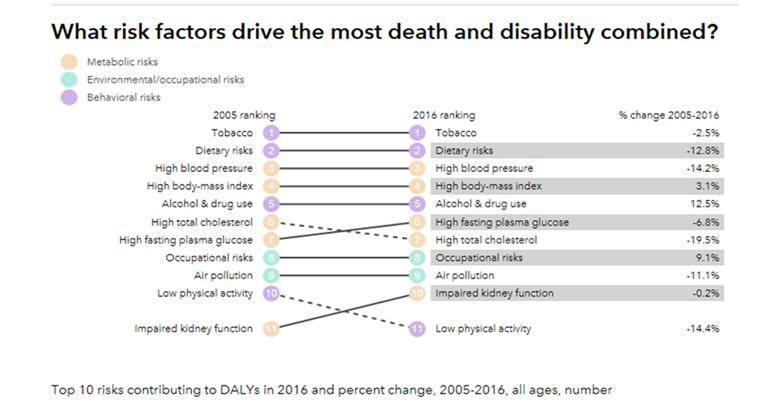
A stakeholder group will be convened annually, to bring partners together to review
progress and facilitate joint working. Our action plan will be a dynamic document
refreshed annually as we learn from our implementation and will need to be flexible to
take into account any change in resources, both financial and staff capacity.
Ways of working
The following principles describe the way in which we will take forward the Luton Food Plan:
Innovation: We will seek to be innovative in our approach to action and ensure the
programme meets the diverse needs of our town.
Enabling: We want to become an ‘enabler’ to make it as easy as possible for local groups,
organisations and businesses to undertake activities which help contribute to the
ambitions set out in this Luton Food Plan
Fairness: We will seek to reduce health inequalities and ensure that various groups have a
voice in the development of priorities through our focus groups.
Collaboration: We recognise that the food agenda is complex and will involve many
stakeholders from all sectors to work together. We will make every effort to support and
collaborate with individuals, groups and organisations across all sectors to work together to
achieve our ambition for Luton.
Flexible: We know that priorities can change; new issues can emerge, and circumstances
can shift. The plan is intended to be developmental, so we maximise new opportunities and
meet our resident’s needs. In addition, a review process with stakeholders will be conducted
annually to measure the impact of against our priorities.
Positive: To contribute towards the creation of a healthy, prosperous Luton that the Luton
Investment Framework presents and support the local population enjoying healthy,
prosperous lives we will therefore have a strong focus on positive messages and
celebration of success.
Performance
A more detailed annual action plan will be co-produced with partners to implement, monitor
and evaluate the strategy and deliver the strategic healthy eating aims for Luton. In turn
these actions will have their own project plan as required.
Many of the desired changes are complex and long term and so it is important to be
realistic about what can be achieved in the shorter term. However, by 2022 there are some
Performance Outcomes that the plan can contribute to and demonstrate impact:
Short term output
Develop a multi-agency Luton Food Plan steering group
Join the sustainable food cities national programme
Enable all council early years’ settings to implement a healthy food policy, to improve
the quality of food consumed in those premises.
4|Page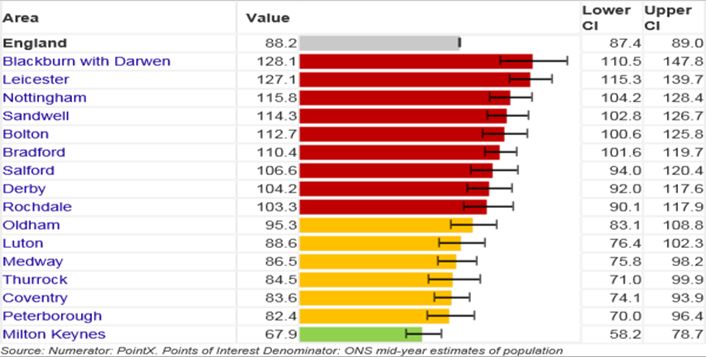
Increase the number of Breast feeding settings in Luton, specifically the
Mall, through partnership working
Develop an effective work program with Luton food outlets to improve food
quality offer to the public.
Create green borough projects in the community with residents, using local skills
and increasing the availability of local produce.
Longer-term outcomes are to increase:
Proportion of healthy weight children in year R and 6
Proportion of children with no dental decay
Number of fruit and vegetables eaten per day for children and adults
Number of healthier food outlets
Appendices:
Appendix A – Draft Food Plan Needs Assessment
Appendix B – Luton Council Food Guidance
Appendix C – The Councils position of new food retail development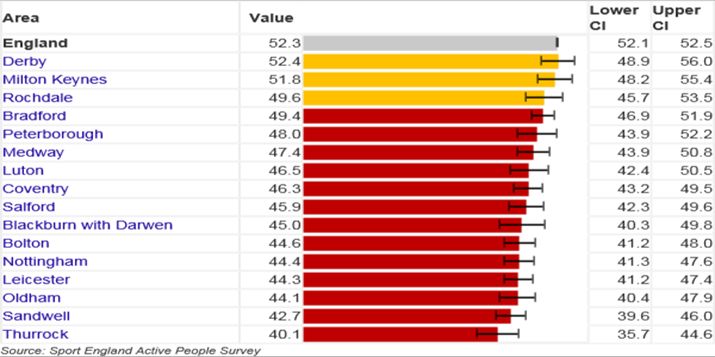
Appendix A - Health Needs Assessment – Luton Food Plan
Key Summary:
The reasons why people eat unhealthy diets are complex and associated with
issues relating to food accessibility, affordability, knowledge and skills and culture.
The ethnic composition of Luton fits a model known as ‘super-diversity’ in which
there is an increasing number of BME communities within the population each with
its own needs and cultures.
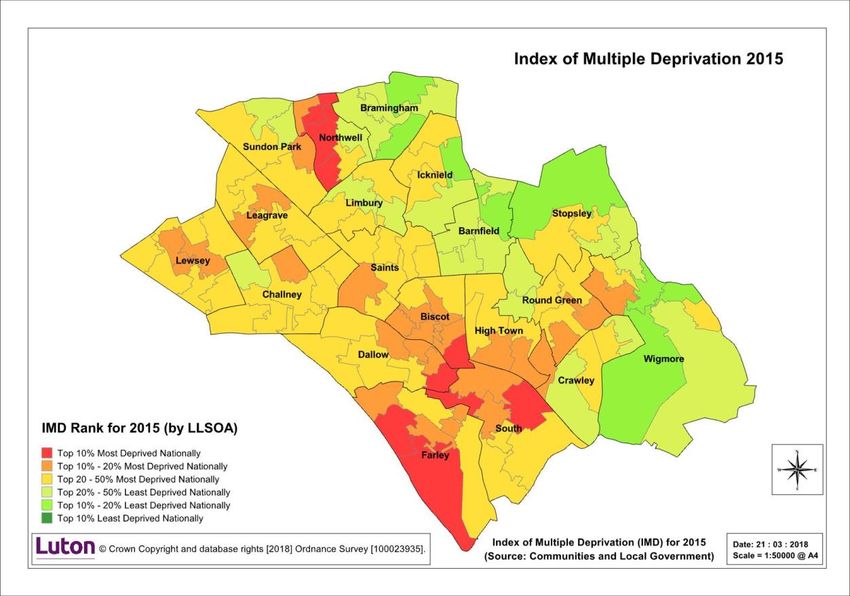
Luton is becoming relatively more deprived in comparison to the other local
authorities of England and the trend of has been happening since 2004. Luton has
nine output areas in the top ten per cent most deprived areas in the country. Three
of these are in Northwell, two in Farley and South wards and one in Biscot and
Dallow wards.
At reception year (4-5-year olds) 75.5% of children are a healthy weight, which
drops to 56% at year 6 (10-11-year olds).
Only 35% of local school pupils and 49.8% of adults report eating the
recommended “5 a day”, with Luton adults eating less fruit and vegetables per day
on average compared to England (2.4 vs 2.5 respectively).
Luton has a higher density of fast food outlets 88.6 per 100,000 population
compared to the England average of 88.2.
Resident feedback showed just over 15% of residents considered themselves to be
eating healthily all the time.
Focus group feedback showed an appetite for greening up the Borough and the
possibility of a range of local growing spaces.
1. Introduction
This Health Needs Assessment has been developed to provide information and intelligence about
the need for a Luton Food Plan and relevant demographics, data and insight from residents. A JSNA
chapter looking at the Luton Food Plan will be published in 2018.
2. Luton Demographics
The health of the population of Luton tends to be slightly poorer than the England average. The
poorer health outcomes are linked primarily to the levels of socioeconomic deprivation experienced
by a significant segment of the population. This section will describe the numbers and projected
growth of the population; demographics (e.g. age, gender, and ethnicity); population movement in
and out of the borough; deprivation and poverty.
The latest (2014) Office for National Statistics (ONS) Mid-Year Population Estimate for Luton was
211,000.Figure 1 shows the most densely populated areas of Luton are in the centre of the town. With an area of 4,336 hectares, the official (ONS) population figure translates into a population density of 48 people per hectare. This figure is greater than many London Boroughs. Figure 1: There is a broad ethnic groups in the Luton population, with approximately 45% of the population being of Black and Minority Ethnic Origin (BME) or non-white. The ethnic composition of Luton fits a model known as ‘super-diversity’ in which there is an increasing number of BME communities within the population each with its own needs and cultures. Luton has a long history of migration into the area both from elsewhere in the UK and overseas. Analyses of translation service data also highlighted the levels of diversity in the town by identifying more than 120 languages or dialects being spoken by residents. This provides corroborating evidence of Luton being super diverse. 5% of the total population of Luton are Black African or Black African heritage (England 2.1%) and 5.9% Black Caribbean or Black Caribbean heritage (England 1.9%). 14.4% of the population are Pakistani (England 2.1%), 6.7% Bangladeshi (England 0.8%) and 5.2% Indian (England 2.6%). Luton is ranked as the 59th (out of 326) most deprived local authority. In 2010 Luton was ranked as the 69th most deprived local authority, in 2007 as the 87th (out of 354 authorities) and in 2004 the 101th most deprived local authority. This indicates that Luton is becoming relatively more deprived in comparison to the other local authorities of England and the trend of has been happening since 2004. Luton has nine output areas in the top ten per cent most deprived areas in the country. Three
of these are in Northwell, two in Farley and South wards and one in Biscot and Dallow wards as seen
in Figure 2.
Figure 2: Map showing levels of deprivation
Luton Population Change
The population of Luton continues to change and using various data sources it is estimated
that approximately 30 to 50 per cent of the current population were either not born or not
living in Luton at the time the 2011 Census.
Internal migration is showing the impact of welfare reform with an increase of people
moving from London boroughs to Luton.
International migration has grown since 2011 and the population of Luton has become more
diverse
National Insurance records shows a growing number of Romanians coming to Luton
School census records show Luton’s population becoming more diverse with the number of
children whose first language is not English now out numbering pupils with English as a first
language.
South, Farley and High Town are the areas where population turnover is the fastest. Biscot and Dallow wards have the highest birth rates.
3. Why do we need a Luton Food Plan?
The reasons why people eat unhealthy diets are complex and associated with issues relating to food
accessibility, affordability, knowledge and skills and culture.
The evidence from the Global Burden of Disease is that diet is an important risk factor in many
health issues and dietary risks are the second highest factor, the highest being Tobacco, affecting
Disability Adjusted Life years (DALYs) as shown in Figure 3.
Figure 3:
Risk factors include diets high in sugar and trans-fats and low in fruit and vegetables. Poor diet
contributes to around 50% of coronary heart disease and 30% of all cancer deaths, the two biggest
causes of death in Luton.
Concerns relating to food retail outlets
We live in an increasingly obesogenic environment which is selling high energy, cheap, fast food.
Research conducted in Leeds sought to analyse the association between childhood overweight and
obesity prevalence and the density and proximity of fast food outlets in relation to the child's
residential postcode.
Concerns are raised regarding the proximity of fast-food outlets to schools, parks and other land
uses where there is a concentration of young people and/ or a focus on services that facilitate
healthy living. Purchases from shops around the fringe of schools were found to provide at least 23%
of recommended energy intakes for school children and an average 38% of calories from fat,
compared with the recommended 35% 3. Food purchased by children from such outlets also
provided them with more than a third above the recommended NMES intake.
It found that there is a significant correlation between the density of fast food outlets and levels of
deprivation. A higher density of fast food outlets was also significantly associated with the child
being overweight/ obese. No significant association between distance to the nearest fast food outlet
and overweight/ obese status was found.Research in the US among young to middle-aged adults considered distance to food retail outlets against the consumption of food types 2. This found that fast food consumption among low-income respondents was related to fast food availability, particularly within 3 km of home. There were no significant relationships between the availability of supermarkets/ grocery stores and diet outcomes. It is not just fast food outlets that are of concern. Energy dense foods are also sold through restaurants, vending machines and mobile food vans. Other food retail outlets such as corner shops, supermarkets and bakeries sell high fat, high sugar items such as cakes, crisps, chocolate, sweets and drinks. Purchases from fast food outlets are often consumed ‘on the move’ and are therefore also a source of litter from both food and non-food waste. Food waste in particular attracts pests (e.g. rats and pigeons). Litter can also form blockages to urban drainage systems (increasing the risk of localised surface-water flooding) and settle in natural features such as rivers and hedges. Figure 4: Map showing Rates and Count of Fast Food Outlets by Ward Improving oral health Consuming too many foods and drinks high in sugar can lead to weight gain and related health problems and plays a major role in the development of dental decay. Consumption of sugar sweetened drinks, compared to non-sugar sweetened drinks, results in greater weight gain and increases in body mass index in children and adolescents due to increased energy consumption and is associated with increased risk of type 2 diabetes.
In 2015 the Scientific Advisory Committee on Nutrition (SACN) advised that the recommended
average population maximum intake of free sugars should be halved: not exceeding 5% of total
dietary energy. Free sugars are defined as sugars added to foods by the manufacturer, cook or
consumer, plus sugars naturally present in honey, syrups and unsweetened fruit juices. It does not
include sugars naturally occurring in milk products or whole fruit and vegetables. SACN also
recommended that consumption of sugar sweetened drinks should be minimised by both adults and
children.

Sugar intakes of all population groups are above these recommendations, contributing between 12
to 15% of energy. Consumption of sugar and sugar sweetened drinks is particularly high in school
age children, who consume up to three times the recommendation. It also tends to be highest
among the most disadvantaged who also experience a higher prevalence of tooth decay and obesity
and its health consequences. By meeting these recommendations within 10 years we would not only
improve an individual’s quality of life but could save the NHS, based on a conservative assessment,
around £500m every year.

In general, the main sources of sugar in the UK diet for both children and adults include soft drinks;
table sugar; confectionery; fruit juice; biscuits, buns, cakes, pastries and puddings; breakfast cereals;
and alcoholic drinks (for adults) with sugar sweetened beverages the biggest contributor in
children’s diets.

Childhood Obesity

At reception year (4-5 year olds) 22.6% of children are overweight or obese (Figure 4), which
increases to 41.5% in year 6 (10-11 year olds) see Figure 6.

Figure 5:

Figure 6:
Fruit and Vegetable Consumption

Data for Luton show us that the average portions of fruit and vegetables that are consumed by
adults is 2.4 (compared with England 2.5) which is less than half of the Public Health England (PHE)
recommended target of a minimum five portions. 46.5% of the population of Luton adults consumes
5-a-day on a usual day. This is significantly lower than England (52.3%) although all but one of
similar areas has a smaller proportion of the population meeting this target (see figure 7).

Figure 7: Proportion of the population meeting the recommended '5-a-day' on a 'usual day' (adults)

Food Outlets

Despite Luton being a relatively small town, with many outlets contained in the town centre the
density of fast food outlets is 88.6 per 100,000 population which is slightly higher than England
(88.2). Data is shown in figure 8.

Figure 8: Density of fast food outlets per 100,000 population
There is a growing body of evidence on the association between exposure to food retail outlets and
obesity. We know from national and local health surveys that the prevalence of child overweight and
obesity rises with deprivation, and often will continue into adulthood.

A study from the Centre for Diet and Activity Research (CEDAR) at the University of Cambridge, titled
‘Does neighbourhood fast-food outlet exposure amplify inequalities in diet and obesity? A cross
sectional study’ concluded greater fast-food consumption, BMI, and odds of obesity were associated
with greater fast-food outlet exposure and a lower educational level. Fast-food consumption and
BMI were significantly different across education groups at all levels of fast-food outlet exposure.
High fast-food outlet exposure amplified differences in fast-food consumption across levels of
education suggests that policies to improve the food environment in towns and cities could be
helpful in tackling social inequalities in diet and health.

Health Related Behaviour Survey

The Health-Related Behaviour Survey developed by the Schools Health Education Unit (SHEU), report
for Luton Primary school aged children in Years 5 & 6 in 2016 showed:

Figure 9: Shows a decrease between the percentages of children having no fruit and veg as well as
slight increase in the number of children eating 5-a-day.
Figure 10: Shows a decrease in the number of pupils who had school food for lunch. Of concern is an
increase in the number of pupils who did not have lunch as well as a decrease in pupils who felt that
the place they can get school lunch is friendly.

Figure 11: This showed a positive result of an increase in pupils that eat fresh fruit ‘on most days’
and a decrease in those that eat sweets, chocolate, choc bars ‘on most days’.

Secondary School SHEU data (Year 8 & 10)

Figure 12: Shows a decrease in the pupils who had a school lunch. Worryingly this age group also
shows a significant increase in the percentage of pupils who didn’t have any lunch on the day before
the survey.
Figure 13: Shows an increase in the pupils that eat fresh fruit ‘on most days’

Figure 14: Shows a similar level of pupils who didn’t have any portions of fruit or veg but an increase
in those that had at least 5 portions of fruit and vegtables.
4. Resident Feedback
As noted, the reasons why people eat unhealthy diets are complex and associated with issues
relating to food accessibility, affordability and culture.
To provide further local insight into this LBC’s Public Health team undertook a mixed-methods
consultation exercise in the second half of 2017, which comprised an online survey followed by a
series of 15 informal ‘focus groups’ in community settings with guided discussion topics, focusing on
knowledge, habits and experience. Just over 200 residents completed the online survey and a similar
number took part in the various focus groups. Questions covered knowledge, information, habits,
motivations, barriers and what people thought our current initiatives. White British people were
overrepresented in the online survey responses, which possibly reflects overall media consumption
habits and general patterns in public consultation responses. We therefore made a specific effort to
rectify this with the focus group targeting. Time and resource constraints prevented us from getting
full representation of Luton’s communities or demographics but we improved the overall diversity of
respondents.
We found:
An overwhelming majority a respondents considered that they had a good or better
knowledge of healthy eating.
Nearly two thirds felt there was enough information available. (The third that didn’t made
this something that we wanted to explore more in our focus groups.)
More than two thirds felt that the quality of information available was good. Again, the
proportion that didn’t prompted us to explore this further. (community opportunities and
social media both came out strongly).
Social media and community settings were seen as good ways to get more information.
Just over 15% considered themselves to be eating healthily all the time. Most respondents
seemed to occupy the middle ground, with around 40% being self-confessed occasional or
rare healthy eaters.
Self-control in the face of temptations seemed to be people’s biggest barrier, followed by
lack of time to cook, which led people to convenience food.
Issues around labelling and understanding food content were significant.
Getting existing fast food outlets and schools to provide healthier food was prioritised, as
was the idea of healthy cooking classes.
Key findings from the focus groups were that:
Luton residents are, broadly speaking, food literate. They tend to know what they should be
eating.
They are concerned about the availability of good food and the quality of labelling.
They question the proliferation of cheaper fast food takeaways, especially near schools.
The education of children is seen as important, also as a conduit to educate adults, but there
are mixed views on how well schools are doing this.
Money and time are issues for many There’s a big appetite for greening up the Borough and the possibility of a range of local
growing spaces
Participants broadly support the Council’s priorities and actions.
People like the idea of community education around food.
Social media is a good communications tool for almost all communities, but many
particularly like YouTube.
A more thorough thematic analysis of issues raised will be completed separately.
Food poverty has been identified as a key issue in Luton, this food plan and the project group is
working collaboratively with the Luton Food Poverty Alliance that concentrates on reducing food
poverty in Luton to address this issue.
This needs assessment will be used to shape the Luton Food Plan Action Plan and a JSNA chapter on
this will be developed in 2018.Appendix B – Food Guidance Document:
Buffet and snack foods for Luton Borough Council Employees
What is this guide about?
Local authorities can improve workplace health in two ways – in their own role as an
employer, and by encouraging and helping other employers to improve the health of their
employees. NICE Workplace Briefing, July 2012.
‘In 2014, over 1.9 billion adults were overweight; 600 million of these were obese’,
worldwide, (WHO 2015). In 2011, 24% of men and 26% of women in the UK were obese’,
(NHS choices 2015). That’s over a quarter of the adult male and female population are at
risk of major health consequences due to being obese. Obesity is a major risk factor for
cardiovascular diseases such as heart disease and stroke, type 2 diabetes, musculoskeletal
disorders and some cancers’
This change of lifestyle patterns is mainly due to environmental and societal changes,
including an increased production and availability of convenience foods, which are often
popular due to busy modern-day lifestyles, but are mostly extremely high in saturated fat,
sugar and salt.
Why do we need this guide in LBC?
As set out in the Luton Food Plan after tobacco, diet has the greatest overall impact on
health. Risk factors include diets high in sugar and trans-fats and low in fruit and
vegetables. Poor diet contributes to around 50% of coronary heart disease and 30% of all
cancer deaths, the two biggest causes of death in Luton.
Luton Borough Council supports a culture of healthy eating. This can be achieved by:
Bringing in your own healthy lunch and/or snacks
Providing affordable choices that can contribute to a healthy diet in canteens such as
the depot and strangers way;
Ensuring all food that is procured adheres to this guidance.
Supporting the implementation of the Employee Wellness Plan and the ethos of a health
promoting workplace. All LBC employees are responsible for their own health and set an
example to our partners and colleagues when providing food at any meeting/event or
function. This will enable employees to make healthier choices by consuming fresh healthy
foods, and as little processed foods as possible, in a cost-effective manner. Luton Council
Public Health, Procurement and Commissioning will support this by developing a list of
‘accredited’ providers who will be briefed and provided with this guidance to ensure it is
adhered to.
Procurement Guidelines
When procuring catering on behalf of the council for situations such as meetings, away
days, social events, charity fundraisers, conferences and training, there are certain minimumstandards for healthy eating that Public Health England (PHE) have recommended
organisations should follow.
Below is a table of recommended healthy foods to choose to provide to staff when
procuring, contrasted with unhealthy foods to avoid/limit when procuring. As a fair-trade
town, we promote the use of fair trade where possible.
Choose Avoid/Limit
Sandwiches High Fibre/wholegrain breads White Breads (Including Rolls,
(Including rolls, wraps, etc.) Wraps etc.)
Spreads and dressings aren’t Full Fat Spreads, Butters and
necessary, if using choose low dressings
fat varieties and limit the Fillings High in Saturated Fat &/or
amount Salt (e.g. Processed Meats such as
Lower Saturated Fat & Salt bacon, Processed Meat Slices)
Fillings (e.g. unprocessed lean Full Fat Cheeses and Cheese
meats like ham, beef, turkey and Spreads
chicken without skin Fish, and
Egg etc.)
Oily Fish (e.g., Salmon, Tuna)
Lower Fat Cheeses and Cheese
Spreads
Include 40g Salad/Veg in each
Sandwich
Provide Gluten Free options
Other Savoury Unsalted Nuts &/or Seeds E.g. Processed Snack Foods (e.g. Mini
Options Pumpkin Seeds, Sunflower Sausages, Mini Eggs)
Seeds, Cashew Nuts Crisps, Tortilla Chips, Savoury
High Fibre Crackers/ Cracker Biscuits
Breads Battered/Breaded/Pastry based
Low Fat Hummus with Products (e.g. Goujons, Sausage
Wholegrain Pitta Bread Rolls, Pies, Quiche)
Lentil Dishes e.g. Dahl, Lentil Anything Deep Fried &/or
Soup Processed
Wholemeal Rice/Pasta White Rice/Pasta
Meats Fresh Meats Flavoured with Red Meat
Herbs &/or Spices E.g. Seasoned Processed Meats (e.g. Salami,
Chicken Fillet Strips Chorizo, Processed Ham/Turkey
Unprocessed and Lean Meats Slices)
(e.g.) Other Meat Products (e.g. sausage
Majority Skinless White Meats rolls, Crackling, Pork Scratchings)
Cured Meats (High in Salt)
Cheeses Reduced fat hard cheese Cheeses containing more than 25g
(containing Less than 25g saturated fat/ 100g
Saturated Fat/100g) or cheese Large Lumps of Cheese (Too big
naturally lower in fat e.g. low-fat Portion Size)
cottage cheese and cream
cheese Use Grated Cheese (For
Smaller Portions)
Other Dairy Semi Skimmed Milk Full Fat MilkProducts Low Fat &Low Sugar Yoghurt Full Fat Yoghurt
(2% Fat or Less) Containing Real Any Dairy Products High in Sugar
Fruit
Dairy free Alternatives E.g. Soya
Salads Undressed Salads (Dressings Dressed Salads/High Fat Salad
Should be Served Separately and Dressings
be Reduced/Lower Fat)
Salads such as Coleslaw should
be made with Low Fat
Ingredients (e.g. low-fat
Mayonnaise or yoghurt)
Large Amounts of Salad to be
Served on its own and Together
with other Foods
Salads should be widely available
at all meeting/events
Include Protein Ingredients in
some Salads E.g. Nuts, Lentils
Dips Vegetable Sticks E.g. Carrot, Non-Veg based Dips
Celery, Cucumber, Peppers High Fat Dips e.g. cream and oil
Vegetable-based dips based
Low Fat/Reduced Fat Dips E.g.
Low-Fat Hummus
Desserts Fresh and Dried Fruit Non-Fruit Desserts
Fruit Based Desserts All Confectionary such as Cakes,
Fruit Salads (Without Syrup) Biscuits, Muffins, Flapjacks, Sweets
Currant Buns, Fruit Loaf, Malt etc.
Loaf Pastries (e.g. Croissants, Danish
Oatmeal Cookies Pastries etc.)
Low Fat Yoghurt/Frozen Yoghurt Cream
Drinks Tap Water Added Sugar Drinks/Juices
Bottled Water Carbonated Drinks
No Added Sugar Juices (Max From Concentrate Juices
150ml per portion)
100% Pure Fresh Fruit Juices
(Max 150ml per portion)
Tea, Coffee, De-Caffeinated
Option Available, Herbal Teas
Available E.g. Green Tea
Salt Salt Should not be Provided on High Salt Foods
Tables (Provided only on Table Salt Provided
Request)
All foods should be low in SaltGeneral Guidelines: Special Diets: Ensure plenty of healthy vegetarian and vegan options available, e.g. vegetarian sandwich options, vegetarian savoury options, vegan dessert options. Ensure gluten free options, e.g. sandwiches made with gluten free bread. Ensure to make clear of any foods containing nuts/traces of nuts. Portion Size: It is recommended that we consume: Starchy Food: 8-10 portions per day, one portion = one piece of bread, half a pitta bread, 3 small crackers, 3 tablespoons boiled pasta, 2 tablespoons boiled rice Protein: 2-3 portions per day, one portion = 75g cooked meat, 75g oily fish, 2 medium eggs, 4 tablespoons of lentils, 2 tablespoons nuts Dairy: 3 portions per day, one portion = 200ml milk, 150ml yoghurt, 30g hard cheese, 2 tablespoons cottage cheese Fruit/Veg: At least 5 portions per day, one portion = 80g of any fruit or veg Fat and Sugar: Limit intake of these, eat sparingly Water: Water (tap water) should be visible and freely available always Choosing Providers Let the provider know what is expected of them and the rationale behind promoting a healthy work environment; Give the provider examples of what you mean by ‘healthy’ and ‘unhealthy’; Agree a cost and ensure that you have received the best price for your requirements ensuring value for money. Different Occasions: Meetings/Away days: Small numbers of staff, simple and healthy, water, salad and fruit provided. No dessert. Social events: Larger numbers of staff and not necessarily LBC employees, therefore more variety of sandwiches and savoury options, some desserts possibly provided, with value for money. Water, salads and fruit available. Conferences/Training: Large numbers of people including staff and not necessarily LBC employees, more variety of sandwiches and savoury options, possibly some desserts provided, with value for money. Water, salads and fruit available. Staff Charity fundraisers: Promote choice by encouraging healthy options when baking, cooking or purchasing of foods. How we communicate this guidance:
The guidance will be communicated to LBC employees ensuring awareness of the guidelines
and to emphasise the importance of them.

The Public Health team will lead on communicating the guidance. Communication will
include:

Directly discussing with staff, explaining the guidelines in more detail, explaining why it’s
important to follow the guidelines and to answer any questions;

Use of the intranet communicating the guidelines including poster campaign;

Individual emails to contacts engaged with health and wellbeing.

Guidance will be included within all new employee starter packs

Resources:
British Heart Foundation, Eating Well Booklet: https://www.bhf.org.uk/publications/healthy-
eating-and-drinking/eating-well

NHS Choices, Food and Diet:
http://www.nhs.uk/LiveWell/Goodfood/Pages/goodfoodhome.aspx

PHE Guidance, Eat Well Guide: https://www.gov.uk/government/publications/the-eatwell-
guide

PHE Guidance, Healthier and more sustainable catering:
https://www.gov.uk/government/uploads/system/uploads/attachment_data/file/347883/Nut
rition_principles.pdf

References:

WHO: http://www.who.int/mediacentre/factsheets/fs311/en/

Healthy Working Lives: http://www.healthyworkinglives.com/advice/Legislation-and-
policy/Workplace-Health-and-Safety/consultation-with-employees

NHS Choices: http://www.nhs.uk/Conditions/Obesity/Pages/Complications.aspx
http://www.nhs.uk/conditions/Obesity/Pages/Introduction.aspx

Bupa, Portion Size: http://www.bupa.co.uk/health-information/directory/p/portion-size

British Nutrition Foundation:
http://www.nutrition.org.uk/healthyliving/healthyeating/8tips.html
Appendix C: The council’s position on new food retail development

The council is undertaking work to improve the food available in fast food outlets
and its Food Plan will support the desired outcomes to be achieved in Luton. We will
work with, as partners, local food outlets on a ‘healthier options approach’ to
promote health, and where needed to have the means to protect children who are
developing their lifestyle behaviours which at an early age can be set for life.

Local health concerns are an important consideration in the determination of
planning applications and planning policy development. This is described in
paragraph 17 of the National Planning Policy Framework:

‘Within the overarching roles that the planning system ought to play, a set of core
land-use planning principles should underpin both plan-making and decision-taking.
These 12 principles are that planning should … take account of and support local
strategies to improve health, social and cultural wellbeing for all, and deliver
sufficient community and cultural facilities and services to meet local needs.’

This national direction is supported by the provisions of our own development plan,
the Luton Local Plan 2011-2031. Policy LLP1 of this sets-out the local definition of a
presumption in favour of sustainable development, which includes the direction that:

‘…The Council will seek to encourage growth and sustainable development and to
manage change, to create a network of connected, sustainable, high quality, locally
distinctive, healthy places...’

In support of national and local policy, the Food Plan functions- as a local strategy to
improve health for all and inform decision-making on planning applications to ensure
that a network of healthy places can be realised.

To help decision-makers, this plan clearly sets-out the local issues and evidence. It
does not constitute planning policy itself but will constitute the Council’s general
position on food retail and function as a material consideration when officers and
councillors determine planning applications.

The Council considers it inappropriate for any food to be sold within easy walking
distance of schools and other sensitive areas such as sports facilities. This concern
covers but is not limited to:

•      Newsagents

•      Supermarkets

•      Dessert parlours

•      Sandwich bars

•      Restaurants

•      Pubs
•     Hot food takeaways

•     drive-through takeaways

The Council recognises that some food retail offers can be consistent with the
objective to support health and wellbeing and that there might be some exceptions
to this general position. The Council will consider planning conditions proposed by
applicants that could make their development proposals acceptable in the light of
the concerns identified in this Food Plan.

The Council will develop a scheme to work with food retailers to address the
negative health impacts of their businesses on the wider community. When this
scheme is operational, we will use of planning obligations/ conditions to ensure new
food retail operators sign-up to this scheme. Such an approach would serve to
mitigate negative impacts and make development acceptable in planning terms.

The department for Public Health, Commissioning and Procurement will advise the
Council on the appropriateness of any relevant development proposals. It is also
proposed that 12 months following the implementation of this approach it is
reviewed to assess its effectiveness and if other methods used nationally would be
more effective.
You can also read