Luxembourg Property market - Market Overview H1 2019
←
→
Page content transcription
If your browser does not render page correctly, please read the page content below
Luxembourg
Property market
Research Report
Market Overview H1 2019
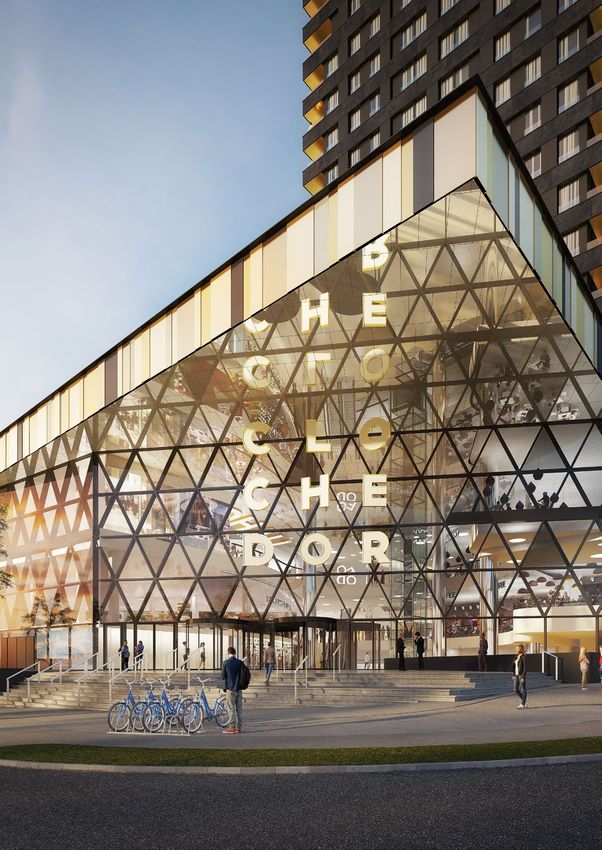
© Auchan / Promobe
Developer : Ceetrus
Economic
                                     Background
     Beginning of 2019 numbers are confirming
     the country’s sustained growth.

           The global economic situation              Luxembourg. A No-Deal Brexit will have     favorable business environment. GDP
           looks more volatile than ever from         a very limited impact on Luxembourg        growth is maintaining a good and
           a business stand point. It would be        economy if we compare to neighboring       healthy rhythm at 2.6%, compared
           foolish to think that we know what         countries such as France and Belgium       to the anemic 0.4% of the eurozone
           2020 will bring. From Brexit chaos         with both facing a -0.4% decrease          area. On top of this, the Luxembourg
           to a US/China trade war via possible       forecast in their respective GDP.          Government adopted six major policies
           conflict in the gulf, the geological       Luxembourg is viewed indeed as an          (such as public transport gratuity)
           situation doesn’t look very stable in      alternative to London for investors and    which will add an extra push on GDP
           the short to medium term.                  companies in EU particularly in the        and to employment. Unemployment
                                                      financial sector. The situation could      stabilized at 5.5% this quarter and is
            A Global Risks survey made by Oxford      be very different for Luxembourg if        forecasted to decrease by 0.5% by the
           Economic on EU investors saw 13%           a trade war intensifies because of its     end of 2020.
           of them viewing a No-Deal Brexit as        trade exposure, a significant part of
           a global economic risk. This number        Luxembourg’s exports are directly          Inflation experienced a significant
           is growing as we get closer to 31st        linked to global supply chain.             decrease during the last 3 months
           October 2019 (the current Brexit                                                      from 2.1% to 1.8% due to the 4.5% fall
           deal deadline which the new British        Despite the clouds on the horizon,         of oil product prices. The public debt
           Prime Minister has declared as final).     fundamentals stayed positive in            bottomed out at 21.3% of GDP, as ever
           On top of this, 41% of respondents         Luxembourg during the first half of        far below the eurozone average of
           see trade war as a major risk for the      2019. The stable political situation and   86.1% (Eurostat).
           global economy for the next two years      the government proximity to economic
           and this is perhaps the biggest risk for   actors helped Luxembourg maintain a

Sources: STATEC
Economic
                                          Snapshot

                           Inflation                                              Population

                  2018                 H1 2019                             2018                H1 2019

           2,1%                        1,8%                        602.500 614.000
                                                     Structure of GDP
                                                        by output
                                           Industry
                                                                Agricultural
                                           11,6%                0,3%

                                          Services
                                         88,1%

     €
                         GDP Increase                                          Unemployment Rate

                         + 2,6%                                                    5,5%

Sources: STATEC
Office
                                                Market
      Speculative development remains
      very limited this year.

            We saw the total take-up reach 23,946     The average size per deal falls almost      biggest completions are coming from
            sq.m. for Q2, which brings the total H1   by half to 394 sq.m. compared to            the extension of the European Court
            take-up to 41,334 sq.m. On the 105        the first half of last year where we        of Justice (39,750 sq.m. in Kirchberg),
            transactions we listed, only six were     reached 703 sq.m. If we remove the          Casa Ferrero (30,000 sq.m in Airport
            above the 1,000 sq.m. threshold. The      IWG Group transactions from the list,       district) and Royal Hamilius (10,000
            biggest transactions were Spaces          this number falls further to 320 sq.m.      sq.m. in CBD).
            (IWG Group) in Impulse (Station)          Transactions from Business Services
                                                                                                  Speculative development remains
            for 6,453 sq.m., Société Nationale        companies are the lowest at 297
                                                                                                  very limited at only 18,000 sq.m. in
            de Crédit et d’Investissement in the      sq.m. on average.
                                                                                                  which we have considered Quatuor
            Villa Servais (CBD) for 2,240 sq.m.
                                                      Despite the robust economic health          (4,600 sq.m. in Cloche d’Or) and the
            and Regus (IWG Group) in Oksigen
                                                      of Luxembourg, office take-up seems         speculative parts of Naos (in Belval)
            for 1,925 sq.m. (Kirchberg). Triton
                                                      to have slowed down in the first half       and Zenit (in CBD) with respectively
            International also moved into
                                                      of this year. The Global context is an      4,600 sq.m. and 4,500 sq.m.
            Oksigen for the same amount of
                                                      important factor to consider, and
            space.                                                                                In terms of rents, we see an upward
                                                      companies might want to wait to see
                                                                                                  pressure in the CBD where we see
            Looking at details of occupant            how the current chaotic situation will
                                                                                                  some transactions approaching 52€/
            types we see Banking and Finance          evolve before taking any decisions
                                                                                                  sq.m in the coming months. The
            representing 46% of the transactions.     to move offices. In other words, it
                                                                                                  same upward pressure exists on the
            Flex operators, also known as co-         impacts negatively the decision
                                                                                                  Cloche d’Or and Kirchberg where
            working and business centers, are         process and keeps take-up at a low
                                                                                                  prime rents could increase again in
            the second biggest type with 21%          level, hopefully for a limited period
                                                                                                  the next quarters. We will see in the
            of all the transactions, boosted by
                                                      Vacancy rates are still very low despite    second half of 2019 if this upward
            both IWG Group transactions (8,378
                                                      increasing slightly from 3.4% to 3.6%       trend is confirmed.
            sq.m. in total). Co-Working is in an
                                                      thanks to two major completions:
            evolving trend in Luxembourg and
                                                      Impulse in Station and Staccato in
            we should see more and more similar
                                                      Kirchberg. For the second half of the
            transactions in the coming months.
                                                      year, 165,000 sq.m. of the new offices
            Business Services is the third category
                                                      should be completed where 88% of
            with 5,786 sq.m. of transactions in H1
                                                      it is non-speculative. In this total, the
            (representing only 14% of the total).

All rents quoted are exclusive of VAT.
Office
                                                            Snapshot
                       Take-up (in sq.m)                                                                          Number of Deals
             2017                  2018                      2019
                                                                                                               & Average Size per Deal
300.000
                                                                                                      2017                    2018                 H1 2019
250.000

200.000                                          245.561
                      218.368
150.000

                      143,400                                                                     Average Size:             Average Size:
                                                                                                                                                  Average Size:
100.000
                                                 109,734                                           761 sqm                  883 sqm               394 sqm
 50.000
                                                                       41,334                        Volume:                  Volume:
     0                                                                                               287                      278                     105

                            H1                    H2

                    Total Investment                                          Prime rent (€/sq.m)                                 Number of transactions
                    Volume Lux (€)                                            (excl. V.A.T.)                                      > 1.000 sq.m:
                    629 Mln                                                   50                                                  6

                    Stock (sq.m)                                              Prime yield Office                                  Vacancy rate
                    4 Mln                                                     4%                                    %             3.6%

                     Prime rents (€/sq.m)                                                                          Take-up by sector
                                (excl. V.A.T.)                                                                              Education, Health &
                                                                                               Insurance & Pension Funds    Social

 Periphery                                                 Kirchberg                                               3% 3%
 22,5                                                      36                                    Manufacturing

                                                                                                      6%
 CBD
                                                                                                     Other
 50                                                        Station
                                                                                                 7%                                                   Banking &

                                                           35
                                                                                                                                                      Finance

                                                                                                                                                      46%
 City Belt
                                                                                               Business Services

 28                                                        Cloche d’Or/                            14%
 Esch/Belval                                               Gasperich/Howald
                                                                                                                     Real Estate Activities
 24                                                        30                                                              21%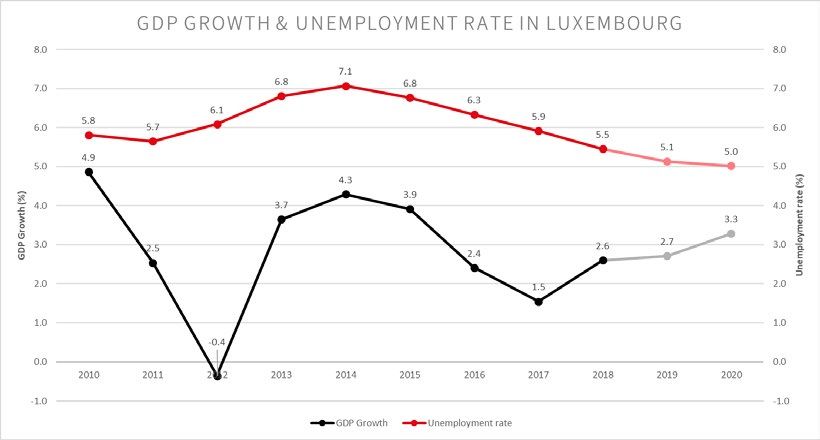
Retail
                                                    Market
       The outlook for rents applicable to
       prime locations remains stable, whilst
       rents for secondary locations are under
       downward pressure.

            Total full take-up (Retail Warehouse,            project of shopping centers and           still available for in this giant retail
            Shopping Center ad High Street                   malls during the last months, such        complex located in the center of
            included) for the first 6 months of              as Auchan Cloche d’Or. Transactions       Luxembourg.
            2019 reached 14,261 sq.m., below the             in Shopping Centers are on average
                                                                                                       In terms of completion this year,
            29,133 sq.m., of H1 2018. The average            smaller in size compared to Retail
                                                                                                       we saw the opening of Cloche d’Or
            take-up over the last 5-years (H1                Warehousing. The Trafic transaction
                                                                                                       Shopping Center in May, representing
            only) stands at 21,513 sq.m. where               in Belval Plaza II was the biggest at
                                                                                                       more than 75,000 sq.m. of stores
            Retail Warehousing represents 54%                1,876 sq.m. followed by Action in
                                                                                                       on which 95% are already rented
            of the total. The slowdown could                 the Boomerang Shopping Center in
                                                                                                       and opening this year (Auchan,
            be explained by the fact that Retail             Strassen at 1,093 sq.m. and C&A in
                                                                                                       AS Adventure, Namur, Sephora,
            Warehousing is not as active as it               Knauf Schmiede at 976 sq.m.
                                                                                                       Les Groupe H&M avec H&M, Cos,
            has been historically. This category
                                                             A half-year volume of 4,746 sq.m. was     Arket, &Other Stories, Weekday
            represents only 15% of the H1 take-
                                                             recorded for the High Street category,    and many others). More than 50%
            up (or 2,003 sq.m.), very low if we
                                                             14% under its 5-year H1 average. The      of these stores are new ones in the
            compare to 2017 when it reaches
                                                             launches of a Delhaize Premium,           Luxembourg retail landscape. We
            30,900 sq.m.
                                                             a FNAC and a Galeries Lafayette           have still in the pipeline for this year
            Take-up in Shopping Centers grew                 inside the ROYAL-HAMILIUS project         the Royal Hamilius (17,000 sq.m.) and
            by 50% versus the last 5-year H1                 in Q4 are bound to lead to a much         infinity Shopping (6,500 sq.m.) both
            average and represents 50% of the                higher volume in the second part of       planned for the end of the year.
            total take-up. This trend is clearly             2019. Retail spaces from 30 to 630
            linked to the completion of several              sq.m. on single or double floors are

                     Royal-Hamilius, Luxembourg                            Infinity Shopping, Luxembourg
                     © Codic Group – Royal-Hamilius Retail                 © Immobel – Infinity Shopping

All rents quoted are exclusive of VAT.
Retail
Snapshot
Yearly Take-Up (year-to-date)
2017 2018 H1 2019
Take-Up (sq.m) 48.200 37.650 14.261
Number
of Deals 70 74 35
Average Size
per Deal (sq.m) 680 509 407
Prime Rent (€/sq.m) Prime Rent (€/sq.m) Prime Rent (€/sq.m)
High Street Shopping Centres Retail Warehousing
(excl. V.A.T.) (excl. V.A.T.) (excl. V.A.T.)
2017 130 2017 110 2017 20
2018 130 2018 110 2018 20
Q1 2019 150 Q1 2019 110 Q1 2019 20
5Y H1 Take-Up (sq.m) 5Y H1 Number of Transactions
37.659
48
40.000
50
35.000
45
43
29.133 5 year
30.000 average 36 35 35
40
25.000 5 year
average
35
31
30
20.000
17.482 25
15.000 13.589 14.261 20
9.702 15
10.000
10
5.000
5
0 0
17
19
14
15
18
19
18
16
17
14
16
15
20
20
20
20
20
20
20
20
20
20
20
20
H1
H1
H1
H1
H1
H1
H1
H1
H1
H1
H1
H1Residential
Market
increasing demand for existing apartments
in comparison of new ones.
Sales of apartments 2014 and 2018. On the contrary, 29% to reach €1,542,371 on average
growth of existing apartment sales for a house (or €7,441/sq.m.). The
Sale price of existing apartment units
accelerated reaching +7.4% between average price for the whole country is
are booming across the country. If
2015 and 2018. The bank BIL in its last €784,162 for a house or €4,562/sq.m.
we compare 2017 to 2018 we see a
Immo-Index from May 2019 explained
growth of 14% for Luxembourg-city Districts where prices for a house
that the supply of existing apartments
ranging from €5,465/sq.m. to €11,173/ were the highest are in the north-east
for sale has increased along with
sq.m.. . The rest of the country is of Luxembourg-city in Niederanven
prices but that the supply of new
experiencing the same trend with for where the average price reached
apartments for sale has slowed down
example +15% in Bertrange (€7,479/ €1,837,880 (or €6,746/sq.m.). For this
along with a deceleration of price
sq.m.), +8% in Strassen (€7,367/sq.m.) district average house size is well
increases.
and +9% in Leudelange (€6,662/ above the average which is explains
sq.m.), So why do we see an increasing the high overall price, and the slightly
demand for existing apartment lower than average price per square
Sale price for new apartment units
instead of new ones? Taxation metre.
are also increasing but at a lower
changes in 2015 could be one of the
pace than the existing ones. The Mobility problems around
reasons. The VAT rate change from
growth between 2017 and 2018 Luxembourg-city also add another
3% to 17% on investments combined
is +9% reaching €8,846/sq.m. in point of pressure on prices. Citizens
to a lower rate on renovation projects
Luxembourg-city. Country-wide we of Luxembourg want to be in areas
redirected investors towards
see +12% in Bertrange (€8,675/sq.m.), with easy access to their workplace
existing apartments and mainly
+9% in Hesperange (€7,655/sq.m.), and are more and more willing to pay
in Luxembourg-city where the
+ 9% in Bettembourg (€6,044/sq.m.) the price for this. We see a consistent
concentration of apartments in prime
and +8% in Mersch (€6,364/sq.m). growth in house prices in all the
locations is the highest.
districts surrounding the capital city.
So what can explain this growth
discrepancy between new and
existing apartment growth? Sales of houses
If we look closer at the STATEC House sales have experienced the
data, we see that the growth of new strongest growth if we compare
apartment sales decelerated these 2019 to 2018. Luxembourg-city
last year’s reaching +4.8% between house prices jumped more than
Sources: Observatoire de l’habitat
Sources: BIL IMMOindex, May 2019
All rents quoted are exclusive of VAT.Residential
Snapshot
Sales of Apartments Sales of Houses
Average price per sq.m Average price per house
6.332
6.143
5.741
5.576
4.965
4.729
2016 3.795
Country Country 2017 4.029
2016
2017
2018
2016
2017
2018
2018 4.308
Existing New
8.846
8.122
8.099
7.731
7.074
Luxembourg Luxembourg
2016 6.062
5.590
City City 2017 6.325
2018 7.085
2016
2017
2018
2016
2017
2018
Existing New
Average selling price of existing apartments
(based on announced prices)
country average:
5,576 €/sq.m
Junglinster
Lorentzweiler
insuffisant sales volume
Steinsel
Kopstal
Walferdange Niederanven
less than 4 000 €/sq.m
Mamer
Strassen Sandweile
Luxembourg r
Bertrange Ville Lenningen from 4 000 to 4 499 €/sq.m
Contern
Hesperange
Leudelange
from 4 500 to 4 999 €/sq.m
Roeser
from 5 000 to 5 999 €/sq.m
more than 6 000 €/sq.m
Sources: Observatoire de l’habitat
Sources: Paperjam Plus, Real Estate, July/August 2019Investment
Market
Office transactions stay the main
driver of growth in Luxembourg
While 2019 started slowly, we saw If we dive into the detail of the the market growth potential in
the third biggest Q2 ever in terms different types of transactions, we Luxembourg are attracting more and
of transaction volume with €445 see that Core type represents 65% of more investors from the southern
Mln invested. In total, we reached the total volume (from 58% in 2018). neighbour. Belgians and domestic
€629 Mln for the first half of the year. The focus on low risk assets (such investors close out the podium with
Total investments are 21% above the as single-tenant in most premium respectively 16% and 14% of the
5-year H1 average, an optimistic sign locations) remains. The Deloitte investments.
for the second part of 2019. Office transaction is the best testimony of
Good economic conditions, low
transactions stay the main lever of this trend. Next to Core, Value Added
financial rates and the growth of the
growth for 2019 accounting for 99% is the second favorite with 24% of the
proportion of Core type investments
of the total amount, a record.. Offices total.
are keeping yields at a historically
are still the asset class enjoying the
Luxembourg market is attracting all low level. Prime office buildings in
most liquidity.
range of investors from all around the strong locations are trading at a 4%
The biggest transaction accounted world. La Française did the biggest yield for short term lease, with the
for almost 40% of the total volume transaction by investing in D-Square same pressure in the City Belt and
by reaching approximatively €250 building for Korean money. This is the Periphery. We didn’t notice any
Mln. The French investor La Française the first time a Korean investor (and change for Logistic and Retail yields
acquired the Deloitte building in the an Asian one to a larger extend) is because of the lack of transactions in
Cloche d’Or. The second largest is by entering in the Luxembourg property the first half of 2019.
Fidelity Investment that acquired the market. French investors are staying
K2 Allegro in Kirchberg for €125 Mln. the biggest players. Proximity and
5Y Half-Year Investments Volumes and Yields
900 6%
800
5%
700
600 4%
604
500
3%
400
170 175 445
300 2%
397
200
1%
100
0 0%
2015 2016 2017 2018 2019
Q1 Q2 YieldInnovation
Focus
How technology is driving
transparency in real estate
Big data and the technology driving it, are promising
huge leaps forward for the real estate industry.
From buildings filled with sensors But significant change is on the Long-term promise, short-term
tracking employees, to software that horizon. In the last two years, $6 problems?The path to greater
monitors reams of lease documents, bn has been raised by so-called transparency nevertheless has its
new technologies are rapidly being proptech start-ups – companies hurdles.
incorporated across the commercial developing technologies dedicated to
Accurately monitoring real estate
real estate industry. No two tools are the property industry. More than 250
markets requires high-quality insights
the same, but they share a common start-ups are developing and rolling
from strong data sets. However, the
output: data. out proptech around the world. New
rapid expansion of proptech tools
technology platforms and services
While broad-based data collection has provoked concern around the
will give investors, tenants and
requires requisite caution, the consistency and reliability of some
property managers access to more
eventual outcome is likely to be of the data, a natural side effect when
easily-manageable datasets, allowing
greater transparency, especially in some of the new data providers rely
for better-informed decision-making
markets where information remains on scraping online sources.
processes.
tightly held, according to JLL and
The ownership of information is also
LaSalle’s Global Transparency Index. At the other end of the spectrum,
a key concern. Property owners and
Luxembourg scored 32nd, not bad blockchain technology could lead
managers can collect vast amounts
but still some room for improvement. to greater global standardization in
of data on tenants through sensors,
all areas relating to property, from
“Property is in the midst of a internet-linked devices, and video
city planning to environmental
technological leap,” says Jeremy feeds. If the information is tightly-held
reports. Trials have already started.
Kelly, global research director at JLL. among operators however, it could
Dubai plans to record all real estate
“The adoption of new technology limit the broader benefits of new
transactions on blockchain by 2020.
platforms generates new and more tools on wider market transparency.
Estonia is also using the technology
easily-accessible market data, Privacy and confidentiality concerns
to authenticate property registries.
which is key for overall real estate are also clearly pertinent with much
transparency.” tighter regulation and corporate
policies heading firmly in the
opposite direction .
Publicly-shared data may expand the
size of the market and make it more
efficient. Proptech data may have
this potential, but this outcome is
not guaranteed unless the firms who
control the data are willing and legally
able to choose to take this path.
As real estate becomes a mainstay
allocation for almost every
institutional investor, access to
consistent and reliable information
is a priority, but remains very difficult
to fulfill.Offices Luxembourg
Atrium Business Park
41 Rue du Puits Romain
L-8070 Bertrange - Luxembourg
T: + 352 - 46 45 40
www.jll.lu
Contacts
Angélique Sabron Lotfi Behlouli
HEAD OF MARKETS DIRECTOR OFFICE AGENCY
LUXEMBOURG LUXEMBOURG
+352 46 45 40 72 +352 46 45 40 58
Angelique.Sabron@eu. jll.com Lotfi.Behlouli@eu. jll.com
Robby Cluyssen Vincent Van Brée
SENIOR CONSULTANT HEAD OF CAPITAL MARKETS
RESIDENTIAL AGENCY LUXEMBOURG
LUXEMBOURG + 352 46 45 40 35
+352 46 45 40 52 Vincent .VanBree@eu. jll.com
Robby.Cluyssen@eu. jll.com
Stéphane Colle Dimitri Collignon
SENIOR ANALYST DIRECTOR RETAIL AGENCY
RESEARCH BELUX LUXEMBOURG
+352 46 45 40 + 352 46 45 40 57
Stephane.Colle@eu. jll.com Dimitri.Collignon@eu. jll.com
www.jll.lu / Jones Lang LaSalle
© 2019 Jones Lang LaSalle IP, Inc. All rights reserved. The information contained in this document is proprietary to Jones Lang LaSalle and shall be used solely for the purposes of evaluating this proposal.
All such documentation and information remains the property of Jones Lang LaSalle and shall be kept confidential. Reproduction of any part of this document is authorized only to the extent necessary
for its evaluation. It is not to be shown to any third party without the prior written authorization of Jones Lang LaSalle. All information contained herein is from sources deemed reliable; however,
no representation or warranty is made as to the accuracy thereof.You can also read