Macro Overview - TBC Capital

Page created by Howard Shelton
 
CONTINUE READING
Macro Overview - TBC Capital
Macro Overview
Macro Overview - TBC Capital
10.8% restart of the economy is diversified

                                                                                                                                            •     Contribution of money transfers, tourism inflows
                                                                                                                                                  and exports in GDP growth was noticeable
                                                                                                                                            •     The impact of the FDI was slightly positive, though
                                                                                                                                                  only on the back of reinvestments, as foreign
                                                                                                                                                  investments in equity declined
%
                                                                                                                                            •     At the same time, credit growth has intensified the
                                                                                                                                                  restart of the economy
                                                                                                                                            •     Among other factors, the effects of lockdowns and
                                                                                                                                                  dissavings in 2021 by the high-income segment are
                                                                                                                                                  noteworthy
                                                                                                                                            •     Given the high inflation, the nominal growth is
                                                                                                                                                  projected at 22.8%
             1.                                                                                                                             •     Real GDP growth will also be positive compared to
             4                                                                                                                                    2019 and will be around 3.3%

*In Q4 2020, the main reason for the decline of FDI was transferring of ownership from non-resident to the resident companies, without cash outflow, but still reducing FDI by around 295 m USD. The figure is adjusted
for this one-time transaction.

Source: Geostat, NBG, MoF, TBC Capital                                                                                                                                                                                    4
Macro Overview - TBC Capital
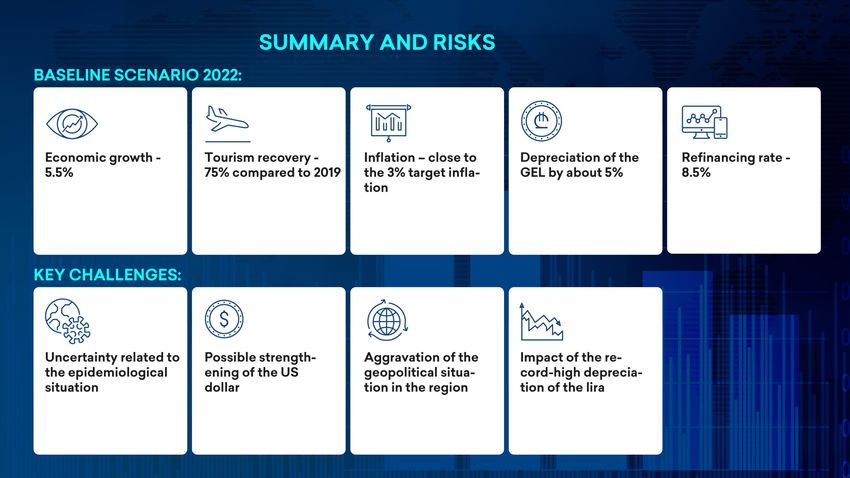
Among other factors, the effect of increased spending by the high-income segment
 in 2021 that was accumulated in 2020 is also noteworthy

                               Household saving deposits to quarterly GDP
                                         and QoQ GDP growth
       140                                                                                                    20
                                                                                                                        •   During the pandemic, the savings of high-income
                                                                                                                            households increased
       120                                                                                                    15
                                                                                                                        •   In the second quarter of 2021, with the opening of
                                                                                                                            the economy and borders, savings were spent,
       100                                                                                                    10            which gave additional impetus to the economic
                                                                                                                            growth
       80                                                                                                     5
                                                                                                                        •   Although the ratio of household deposits to GDP
   %                                                                                                                %       increased in the third quarter, this figure is still
       60                                                                                                     0             significantly lower than the pandemic level
                                                                                                                        •   The reduction in savings was also facilitated by
       40                                                                                                     -5            lower interest rates on foreign currency deposits
                                                                                                                        •   Given the high dollarization, the dollar deposit rate
       20                                                                                                     -10
                                                                                                                            on savings is more effective than the lari.
                                                                                                                            Consequently, although the GEL rate is high, it is the
        0                                                                                                     -15           low rate of the dollar that has helped reduce savings
              Q1 Q2 Q3 Q4 Q1 Q2 Q3 Q4 Q1 Q2 Q3 Q4 Q1 Q2 Q3 Q4 Q1 Q2 Q3
             2017 2017 2017 2017 2018 2018 2018 2018 2019 2019 2019 2019 2020 2020 2020 2020 2021 2021 2021             •   It should also be noted that, as it is mainly the
                                                                                                                            foreign currency deposits that are spent, the impact
                  Real GDP QoQ SA growth (RHS)                             Household demand & term deposits                 on the GEL exchange rate is positive

                  FC deposits (FX-adjusted)                                NC deposits

Source: Geostat, NBG, TBC Capital                                                                                                                                                    5
Macro Overview - TBC Capital
After the 2021 double-digit recovery, growth will return to normal in 2022

         MAJOR MACRO VARIABLE PROJECTIONS FOR 2021 – 2022                                                                      2021                                                                  2022
                 ACCORDING TO TBC CAPITAL, YoY, %
                                                                                                          23 September                                                          23 September
                                                                        2020                                                          Updated Projection                                                    Updated Projection
                                                                                                            Projection                                                            Projection

                           EXPORTS*                                     -12.0                                  +23.5                           +26.5                                  +12.0                           +12.0

                                                                                                         +126.3% vs 2020/                +129.2% vs 2020/                      +113.3% vs 2020/                +97.5% vs 2020 /
                           TOURISM*                                     -83.4                                                             -62.0% vs 2019                                                         -25% vs 2019
                                                                                                          -62.5% vs 2019                                                         -20% vs 2019

                        REMITTANCES*                                     +5.51                                 +24.5                           +25.5                                  +11.0                           +11.0

                              FDI*2                                     -30.5                                  +10.0                           +21.0                                  +30.0                           +30.0

              IMPORT OF GOODS AND SERVICES*                              -19.3                                 +21.0                           +21.5                                 +18.0                            +18.0

                      FISCAL DEFICIT**                                    9.3                                   6.9                              6.7                                   4.4                             4.4

                       BANK CREDIT***                                    +9.1                                  +18.0                            +18.5                                 +13.6                           +14.0

                         GDP GROWTH                                     -6.8%                                 +10.5%                          +10.8%                                 +6.0%                            +5.5%

         *Growth in USD ** Ratio to GDP, as planned by the MoF, IMF methodology ***End of period, constant exchange rate
         For GDP estimation inflation adjusted period credit growth is used. Also, the calculation is based on the estimation of inflows in real terms in GEL, not in USD. Moreover, various other assumptions are used in terms of the
         impact of key macroeconomic variables on economic growth
         1.   Adjusted taking into account reduced cash inflows due to closed borders
         2.   In Q4 2020, the main reason for the decline of FDI was transferring of ownership from non-resident to the resident companies, without cash outflow, but still reducing FDI by around 295 m USD. Adjusting for this
              component, FDI fell by 30.5% YoY, while without adjustment they fell by 52.9% YoY

Source: Geostat, NBG, MoF, TBC Capital                                                                                                                                                                                                    6
Georgia's tourism structure should be a prerequisite for about 75% recovery in 2022
 compared to 2019

                                         Global travel spend by segment
                                           (difference from 2019 levels)

       40

                                                                                                               •   Internationally, restoring a business trips will take
       20                                                                                                          the longest
            2020   2021    2022   2023   2024                                                                  •   It should be noted that the share of this type of
                                                                                                                   inflows in total tourist inflows of Georgia is very low.
  %     0
                                                                                                                   Just as low is the relatively long distance visits and
                                                                                                                   on the other hand, in the country there is an
                                                                                                                   abundance of open-air tourism destinations
      -20
                                                                                                               •   Although the rate of vaccination in Georgia is still
                                                                                                                   problematic, recovery of 55.0% of the 2019 inflows
                                                                                                                   in November 2021 in USD terms is promising
      -40
                                                                                                               •   See TBC Capital Tourism Overview for more details

      -60

      -80
               International Business           International Leisure   Domestic Business   Domestic Leisure

Source: Oxford Economics                                                                                                                                                      7
The expectation of economic growth in 2022 largely depends on the recovery of
 tourism

                                                        •   After the 2021 recovery, exports and remittances will
                                                            be relatively normalized
                                                        •   The FDI growth rate will increase, this time on the
                                                            back of equity
%                                                       •   The main driver of growth is the tourism sector
                                                        •   Normalization of bank lending is expected in 2023,
                                                            although in 2022, with slower than projected
                                                            recovery in tourism, lending will be more moderate
                                                        •   The impact of fiscal stimulus on growth is still
                                                            negative
                                                        •   The effect of the dissaving in 2022 compared to last
                                                            year is already low

Source: Geostat, NBG, MoF, TBC Capital                                                                              8
Currency inflows are diversified, although Georgia is still vulnerable to regional
 geopolitical and economic risks

                                    Structure of external inflows by countries

                        73.2                 53.7            61.9              Total, in % of GDP

       100                                    2.8                         Other Countries
                         7.3                                  5.3
                                              4.2
                                                              3.8         Armenia
        90               7.4                  5.5
                                                              4.9                                   •   Inflows to GDP ratio in 2021 is still lower than 2019
                                              4.9                         USA                           due to still recovering tourism and FDI inflows
                         4.4                                  5.9
        80                                    5.8
                         6.5                                  6.8         Middle East & Israel      •   The inflows are quite diversified, including the
                                              5.4
        70               5.3
                                                              6.8         Ukraine                       largest share of the EU
                                              7.1
                         6.7                                                                        •   At the same time, Georgia remains vulnerable to
                                                              7.4         Other CIS
        60               8.2                  9.5                                                       possible economic crises in the region
                                                                          Turkey
                                                              8.8
    % 50                 8.9                  8.7                         Azerbaijan
                                                                                                    •   It should be noted that compared to 2019, the share
                                                              9.1                                       of China has increased significantly, as well as, the
                         3.4                                              China
        40                                    14.5
                                                                                                        share of the European Union especially in the crisis
                                                              14.1        Russia                        of 2020
                        16.6
        30
                                                                          EU                        •   Russia's share in foreign inflows has declined
        20
                                              31.7
                        25.4                                  27.1
        10

         0
                       2019                  2020            2021

Source: Geostat, NBG, TBC Capital                                                                                                                               9
The risk of a stronger US dollar is also noteworthy

                                            US interest rates and USD index
    6                                                                                                                                  130

    5                                                                                                                                  120

    4                                                                                                                                  110

    3                                                                                                                                  100
                                                                                                                                              •   Historically, the expectation of a Federal Reserve
 % 2                                                                                                                                   90 %       rate hike does not necessarily mean that the dollar
                                                                                                                                                  will strengthen
     1                                                                                                                                 80     •   Also, with the rest of the world recovering, the dollar
                                                                                                                                                  is weakening
    0                                                                                                                                  70
                                                                                                                                              •   See more in December 21 TBC Capital macro
                                                                                                                                                  insights
    -1                                                                                                                                 60

    -2                                                                                                                                 50
         2006

                2007

                       2008

                              2009

                                            2011
                                     2010

                                                          2013

                                                                 2014

                                                                        2015

                                                                               2016

                                                                                      2017

                                                                                                    2019
                                                   2012

                                                                                             2018

                                                                                                           2020

                                                                                                                                2023
                                                                                                                         2022
                                                                                                                  2021
                                        Fed funds rate (Projection according to December FOMC median)
                                        US 10Y treasury nominal yield
                                        US 10Y treasury real yield
                                        USD index (RHS)

Source: FRED                                                                                                                                                                                                10
The euro probably to stay weak against the dollar in the short term, but is likely to
 strengthen in the medium term

                    EUR/USD spot rate, PPP estimate and net speculative positions
60                                                                                                                                                                 1.7

                                                                                                                                                                   1.6
40
                                                                                                                                                                   1.5
                                                                                                              stronger EUR
                                                                                                                                                                         •   Net speculative positions in the short run, albeit
                                                                                                                                                                   1.4       slightly, point to further weakening of the euro
20
                                                                                                                                                                   1.3   •   However, in the medium term, according to the
                                                                                                                                                                             PPP estimate the euro is expected to strengthen
 0                                                                                                                                                                 1.2   •   Alongside the PPP estimate, it should be noted
                                                                                                                                                                             that the lari is more stable against the euro than
                                                                                                                                                                   1.1       against the dollar
-20
                                                                                                                                                                   1     •   Diversification is still optimal when taking FX risk
                                                                                                                                                                         •   Also, adding lira and ruble to the basket once
                                                                                                                                                                   0.9
-40                                                                                                                                                                          again looks optimal
                                                                                                                                weaker EUR
                                                                                                                                                                   0.8

-60                                                                                                                                                                0.7
      2000

             2001

                                          2005

                                                 2006

                                                        2007
                     2002

                            2003

                                   2004

                                                               2008

                                                                      2009

                                                                               2010

                                                                                                                                       2018
                                                                                      2011

                                                                                             2012

                                                                                                    2013

                                                                                                           2014

                                                                                                                  2015

                                                                                                                         2016

                                                                                                                                2017

                                                                                                                                              2019

                                                                                                                                                     2020

                                                                                                                                                            2021
                              Net Speculative Position                       EUR/USD spot rate (RHS)                     PPP estimate (RHS)

Source: Bloomberg, OECD, CFTC, TBC Capital                                                                                                                                                                                          11
The lira has depreciated significantly against the dollar, although the currencies of
 other trading partners are more or less stable

                        Georgia's major trading partners' currencies to USD
                                         (1-Sep-2021 = 100)
   235                                                                                                                                                                                                                                         Should the GEL follow to lira?

   215                                                                                                                                                                                                                  USD/TRY   1.   GEL average exchange rate against other currencies

                                                                                                                                                                                                                        USD/EUR
                                                                                                                                                                                                                                  2. High inflation in Turkey
   195
                                                                                                                                                                                                                                  3. The long-term strengthening trend of the lari against
                                                                                                                                                                                                                        USD/GEL      the lira
   175
                                                                                                                                                                                                                                  4. Impact of the GEL/TRY with Turkey and total trade
                                                                                                                                                                                                                        USD/AZN      balance
   155                                                                                                                                                                                        USD/TRY: 14.07
                                                                                                                                                                                                                        USD/CNY   5. The impact of economic growth on the trade
                                                                                                                                                                                                                                     balance
   135                                                                                                                                                                                                                  USD/RUB   6. The dominant currency paradigm
                                                                                                                                                                                                                                  7. Changes in post-election depreciation expectations
    115                                                                                                                                                                                                                 USD/UAH
                                                                                                                                                                                                                                  8. 2022 Inflow-outflow balance
                                                                                                                                                                                                                        USD/AMD   9. Impact of GEL depreciation on inflation
    95
                                              22-Sep-21

                                                                                                                                                                      01-Dec-21

                                                                                                                                                                                  08-Dec-21
                                                          29-Sep-21

                                                                                                                                                          24-Nov-21

                                                                                                                                                                                                            22-Dec-21
                                  15-Sep-21

                                                                                  13-Oct-21

                                                                                                                      03-Nov-21
                                                                      06-Oct-21

                                                                                              20-Oct-21

                                                                                                          27-Oct-21

                                                                                                                                  10-Nov-21

                                                                                                                                              17-Nov-21

                                                                                                                                                                                                15-Dec-21
          01-Sep-21

                      08-Sep-21

                                                                                                                                                                                                                                  See more in December 21 TBC Capital Macro Insights

Note: As of 21-Dec

Source: NBG                                                                                                                                                                                                                                                                                  12
However, the average exchange rate of the lari has strengthened
  significantly, but this time mainly on the back of the lira

                                          The GEL REER, daily estimates
20                                           (% deviation from period average)
            1.77; 2.22                                                                                                                  3.09; 3.48
                                    2.13; 2.41
 15

                                                                                 2.57; 2.92
                                                  2.40; 2.57                                                                                 USD/TRY: 14.07
 10
                                                                                                                                                              •   Due to the weakening of the lira and partially euro
                                                                                                                                                                  against the dollar, the weighted exchange rate of
 5                                                                                                                                                                the lari is 11% higher than the average of its
                                                                                                              2.80; 3.19
                                                                                                                                                                  previous years
 0                                                                                                                                                            •   Given the historical dynamics, the probability of
                                                                                                                                                                  the lari average exchange rate correction is high.
 -5                                                                                                                                                               However, It should be noted that the depreciation
                                                                                    2.77; 3.18                                                                    of the lira in previous periods largely coincided
                                                                2.72; 3.24                                                                                        with the depreciation of other currencies, in
-10                  2.36; 2.68             2.78; 2.89
                                                                                                                                                                  contrast to the current idiocyncratic shock in
               USD/GEL; EUR/GEL
                                                                                                 2.95; 3.29                                                       Turkey
-15

                         GEL REER                GEL REER without Turkish lira
                                                                                                                           3.33; 4.07

-20
      Dec-15

        Jul-21
       Jul-20
      Dec-16

      Dec-17

      Dec-19

      Nov-21
       Apr-14

       Apr-17
        Jul-16

        Jul-17

       Apr-18

       Apr-19

      Aug-20

       Feb-21
       Mar-21
      Nov-17
      Nov-14

      Aug-16

      Nov-18

      Jan-20
      Mar-20
      May-20

      Oct-20

      May-21

      Sep-21
       Feb-17
       Jan-14
      Feb-14

      Aug-15

      Feb-18

       Jun-18
      Aug-18

       Jun-19
      Aug-19
       Jun-14
      Aug-14

      Dec-20
      Sep-14

       Jan-15
      Mar-15

       Jun-15
      May-15

       Oct-15

       Jan-16
      Mar-16
      May-16

       Oct-16

      May-17

       Jan-19
      Mar-19

       Oct-19
      Sep-17

      Sep-18

Note: As of December 21, an increase means the lari will strengthen; USD/TRY at 14.07

Source: NBG, TBC Capital                                                                                                                                                                                                13
Similar to the GEL REER, the baseline scenario implies that the GEL will weaken
 against the euro and the dollar in 2022

                                                                                                                                                                                                     Factors pushing GEL towards depreciation:
                                                     EUR/GEL                                                 USD/GEL                                                       EUR/USD
                                                                                                                                                                                                     • Prolonged pandemic
 4.5
                                                                                                                                                                                                     • Geopolitical instability in the region
 4.0                                                                                                                                                                                                 • Weak Euro and Turkish Lira
                                                                                                                                                                                              3.68   • Possible deflation in Georgia in 2022
 3.5
                                                                                                                                                                                              3.25   • Fed’s early rate hike and stronger US dollar
 3.0

 2.5                                                                                                                                                                                                 Factors pushing GEL towards appreciation
                                                                                                                                                                                                     • Tourism recovery
 2.0
                                                                                                                                                                                                     • Strong net inflows

  1.5                                                                                                                                                                                                • Still high government external borrowings
                                                                                                                                                                                                     • Increased conversions from currency to GEL
  1.0
                                                                                                                                                                                              1.13
                                                                                                                                                                                                     • Historically high GEL/USD differential

 0.5                                                                                                                                                                                                 • Increased FX credit
                                                                                                                                                                                                     • Excess liquidity in the currency of the banking sector
 0.0
                                                                                                                                                                                                     • Weakening of US dollar
                                                                                          Dec-20

                                                                                                                                                                           Dec-21
                                                      Jul-20

                                                                                                                                       Jul-21

                                                                                                                                                                                     Dec-22
                          Mar-20

                                                                                                            Mar-21
                 Feb-20

                                            Jun-20

                                                                                 Nov-20

                                                                                                   Feb-21

                                                                                                                              Jun-21
                                                               Aug-20

                                                                                                                                                                  Nov-21
        Jan-20

                                                                        Oct-20
                                   Apr-20

                                                                                                                     Apr-21

                                                                                                                                                Aug-21

                                                                                                                                                         Oct-21
                                                                                                                                                                                                     • GEL REER long-term appreciation trend

Source: NBG, TBC Capital                                                                                                                                                                                                                                        14
Annual inflation is still high, although monthly inflation has already declined

                Annual and seasonally adjusdted monthly annualized inflation
                                (%); GEL REER (Jan-19=100)
                                                                                                                     •   In December 2021, annual inflation growth is
30                                                                                                             130       expected, but only on the back of high base
                                                                                                                         effect
20                                                                                                             120
                                                                                           14.1
                                                                                    12.8
                                                                                        12.5                         •   By 2022, with the assumption that:
 10                                                                                                            110         •    The average GEL exchange rate will
                                                                                                      3.3                       depreciate by about 5%

  0                                                                                                            100         •    The price of Brent oil will recover from the
                                                                                                                                existing $ 72 to $ 85
                                                                                                                           •    Other commodity prices will remain at
-10                                                                                                            90
                                                                                                                                broadly current levels
                                                                                                                           •    The disruption of global supply chains will
-20                                                                                                            80               be alleviated to some extent
      Dec-20

      Dec-21

                                                                                                      Dec-22
      Mar-20

       Mar-21
       Jun-19

      May-21

        Jul-21
      May-20

       Jul-20

       Feb-21
      Aug-19

      Feb-20
      Sep-19
       Oct-19

       Jun-21

      Nov-21
       Jan-19

       Apr-19

      Jun-20

      Nov-20
      Mar-19

      Dec-19

      Aug-20
      Sep-20
      Oct-20

      Aug-21
      Apr-20

       Oct-21
      Feb-19

      May-19

        Jul-19

      Jan-20

       Jan-21

       Apr-21

      Sep-21
      Nov-19

                                                                                                                           •    Next year's growth, as we forecast, will be
                                                                                                                                5.5%
                                                                                                                     •   By the end of 2022, inflation will be close to the
                                                                                                                         target
        MoM SA annualized CPI            Inflation target   Annual CPI   REER w/o domestic inflation (RHS)

Note: REER increase means depreciation

Source: Geostat, NBG, TBC Capital                                                                                                                                              15
In the wake of declining inflation, GEL interest rates are expected to decline in the
         second quarter of 2022

                Interest rates on domestic and foreign currency denominated
                      deposits, monetary policy rate, Libor, and Euribor
    12
                                                                                        10.50        Arguments for reducing the refinancing rate:
    10
                                                                                            8.50     • Decrease in inflation
    8                                                                                                • Recovery of tourism revenues
                                                                                                     • More or less stability of the GEL exchange rate

    6                                                          All time high                         At the same time, an increase in foreign currency
%                                                               differential                         rates is not expected in Georgia. The reasons for
    4                                                                                                this are:

    2                                                                                                • Foreign currency still has excess liquidity in the
                                                                                            0.55       banking sector
                                                                                     0.17            • Structural decline in foreign currency rates in the long
    0
                                                                                                       run, which had a very weak correlation with the
                                                                                    -0.53    -0.47     dynamics of international markets
    -2                                                                                               • Also, the expected increase in larization and demand
         Jan-20
         Mar-20
           Jul-18
           Jul-17

           Jul-19

          Jan-21
         Sep-20

         Mar-21

         Sep-21

                                                                                            Dec-22
         Nov-19

         May-20
          Jan-17

         Mar-18

          Jan-19

          Jul-20

         May-21
         Mar-17

         Sep-17

          Jan-18
         Nov-17

         Sep-18

         Mar-19
         Nov-18

         Sep-19

           Jul-21
         May-18
         May-17

         May-19

         Nov-20

         Nov-21
                                                                                                       for the GEL

           MPR              GEL deposits   FX deposits   3-Month Libor         3-Month Euribor

    Source: NBG, Bloomberg, TBC Capital                                                                                                                           16
Summary and risks

Baseline scenario 2022:

•   Economic growth - 5.5%
•   Tourism recovery - 75% compared to 2019
•   Inflation – close to the 3% target inflation
•   Depreciation of the GEL by about 5%
•   Refinancing rate - 8.5%

Key Challenges:

•   Uncertainty related to the epidemiological situation
•   Possible strengthening of the US dollar
•   Aggravation of the geopolitical situation in the region
•   Impact of the record-high depreciation of the lira

                                                              17
Sectoral Overview
According to our renewed expectations, only the sectors tightly connected to tourism will remain
      below corresponding 2019 levels
160
                                                           2021                                                  2022                                   2023                                                  2019 level

140

120

100

80

60

40

20

 0

                                                                                                                                                 Wine

                                                                                                                                                                                                                                  FMCG
                                                                               Oil Importers and

                                                                                                                  Health Care

                                                                                                                                                                                                                                         Pharmacy
                                                                                                                                                                                                                 Development
                         Toruism Inflow

                                          Infrastructure

                                                           Telecommunication

                                                                                                   Restaurants

                                                                                                                                                                          Construction

                                                                                                                                                                                         Clothes, Shoes and
            RevPAR USD

                                                                                                                                Transportation

                                                                                                                                                           Auto Dealers

                                                                                                                                                                                                                                                     Energy
                                                                                                                                                                                                                 (transactions)
                                                                                                                                                                           Materials
                                                                                    Retailers
                             (USD)

                                                                                                                                                                                              Textiles
        Compared to our September outlook, the noticeable change in the infrastructure sector is driven by the capital expenditures of the 2022 state budget

        The global expectations regarding oil prices has correspondingly adjusted our forecast for oil importers’ turnover

        Expectation for the turnover of the transportation sector has been improved based on the better than expected performance of the sector

        The historically high amount of exports from the wine and alcoholic beverages sector has positively affected our outlook for the sector

                                                                                                                                                                                                                                                    19
       Source: TBC Capital
Slow recovery to 2019 Level

Recovery, 2021 11M                               Projections
 0%                                               140%                                                                                           Recovery will depend on:
                                                                                                                                                  Rate of vaccination
-10%                                                                                                                                              Spread of new strains
                                                   120%                  115%                                                                     Unimpeded mobility of tourists
-20%                                                                                                                                      105%    Coordination among countries
                                                                                                 100%                                             Creation of Covid-safe environment in
                                                  100%                                                                  95%
                                                                                                                                        90%
                                                                                                                                                    Georgia on a state and destination
-30%
                           -30%     -29%                                                                         85%                                level
                                                                                           78%
-40%                                               80%             75%
                                                                                                                                                 In 2020:
                                                                                                                                                  International visits from Russia and
-50%
                                                   60%                                                                                              Armenia will continue slow recovery
                                                                                                                                                  Economic development in Turkey may
-60%                                                                                                                                                negatively affect visits and inflows from
                 -63%                              40%                                                                                              Turkey
-70%                                                                                                                                              Visits from Azerbaijan are expected to
                                                                                                                                                    start recovery in the second part of 2022.
-80%   -78%
                                                   20%
                                                                                                                                                  Ukraine, Israel, and Saudi Arabia will
                                                                                                                                                    continue strong growth.
-90%
                                                    0%
                                                                                                                                                  Domestic tourism will play significant
        Visits    Inflow     Occupancy     ADR
                                                          Toruism Inflow forecast   RevPAR USD - Total   Occupancy (%) - Total     ADR - Total      role in 2022 as well.
                                                                  (USD)

                                                                                2021              2022           2023            2019

                                                                                                                                                                                      20
Residential Real Estate on a stable track

                                                                                                                   TBILISI RESIDENTIAL REAL ESTATE PRICE* - USD
                                                                                                                   (Change YoY, %)
4000
                                                                                                                   20%
3500                                                                                                                                                                                     +4.9%
3000                                                                                                               10%                                                              YoY in October 2021

2500                                                                                                                0%
                                                                                                                                                                                         -0.2%
                                                                                                                                                                                     MoM in October
2000                                                                                                                                                                                     2021
                                                                                                                   -10%
1500                                                                                                                                                                                     +3.9%
                                                                                                                   -20%
1000                                                                                                                                                                                  Relative to 2019
 500                                                                                                               -30%
  0                                                                                                                -40%
                                                             Jul-20

                                                                                                 Jul-21
       Jan-19

                                  Oct-19
                Apr-19

                                                                      Oct-20
                         Jul-19

                                                    Apr-20
                                           Jan-20

                                                                               Jan-21

                                                                                                          Oct-21
                                                                                        Apr-21

                                                                                                                          Oct-2017

                                                                                                                                     Oct-2018

                                                                                                                                                 Oct-2019

                                                                                                                                                              Oct-2020

                                                                                                                                                                         Oct-2021
  In January-October 2021, the number of transactions exceeds its 2019 level by 1%.

  Residential real estate prices in Tbilisi show positive dynamics.

  The increasing property prices could be attributed not only to the relatively recuperated demand on the market, but also to the
   increasing prices for material inputs in construction.

                                                                                                                                                                                                         21
The rent in RRE still below its prepandemic level

TBILISI RESIDENTIAL REAL ESTATE RENT - USD                                           RENT-TO-PRICE RATIO AND ITS LONG-TERM AVERAGE
(Change YoY, %)                                                                      (%)
30%                                                                                  11%
                                                                     0.0%            10%
                                                                                                                                                        7.0%
10%                                                            YoY in October 2021   9%                                                            in October 2021
                                                                    -3.0%            8%                                                               -0.3 PP
-10%                                                           MoM in October 2021
                                                                                                                                                  YoY in October2021
                                                                    -17.5%           7%
                                                                                                                                                      -1.8 PP
-30%                                                             Relative to 2019    6%
                                                                                                                                                   Relative to 2019
                                                                                     5%
-50%                                                                                 4%
                                                                                     3%
-70%

                                                                                                                            Oct-2020

                                                                                                                                       Oct-2021
                                                                                                      Oct-2018
                                                                                           Oct-2017

                                                                                                                 Oct-2019
                                         Oct-2020

                                                    Oct-2021
       Oct-2017

                  Oct-2018

                             Oct-2019

        The rent was hit by Covid much more and even though there was an improvement in YoY terms, it still remains below its
         pre-pandemic level by 17.5%.

        The rental yield started declining since March 2020, but recently it has mostly been stable, standing at 7.0% in October
         2021. This figure is 1.3% lower than the long-term average.

                                                                                                                                                                22
RESIDENTIAL REAL ESTATE RESILIENT TO CRISIS

Number of sold apartments                                                          Price USD

160                                                                                110            Georgia          Batumi           Tbilisi           2019 level
               Georgia          Batumi           Tbilisi           2019 level
                                                                                   108
140
                                                                                   106

                                                                                   104
120
                                                                                   102

100                                                                                100

                                                                                   98
80
                                                                                   96

                                                                                   94
60
                                                                                   92

40                                                                                 90
        2019             2020            2021E             2022E           2023E           2019             2020            2021E             2022E            2023E

  In 2021, the number of transactions will exceed its 2019 level by about 3.8%.

  In 2021, the price of residential real estate will slightly exceed its 2019 level.

  Batumi RE was hit harder by the pandemic, however, starting from 2022, the recovery of transactions and prices will be faster in
   Batumi than in Tbilisi.

                                                                                                                                                                   23
Occupancy more resilient to crisis than rents

                                                                                                                                           Weighted average rents (index), Shopping Malls in Tbilisi
Weighted average rent (index), Street Retail in Tbilisi

160                                                                                                                                         160
                             USD/GEL                                Rent in USD                               Rent in GEL                                              USD/GEL                                   Rent in USD                                 Rent in GEL
140                                                                                                                                         140

120                                                                                                                                         120

100                                                                                                                                         100

 80                                                                                                                                          80

 60                                                                                                                                          60

                                                                                                                                             40
 40

                                                                                                                                                                                                       2020 Q2

                                                                                                                                                                                                                               2020 Q4
                                                                                                                                                                                             2020 Q1

                                                                                                                                                                                                                     2020 Q3

                                                                                                                                                                                                                                                   2021 Q2
                                                                                                                                                                                                                                         2021 Q1

                                                                                                                                                                                                                                                                 2021 Q3

                                                                                                                                                                                                                                                                                   2023F
                                                                                                                                                                                                                                                                           2022F
                                                                                                                                                             2019 Q2

                                                                                                                                                                                   2019 Q4
                                                                                                                                                   2019 Q1

                                                                                                                                                                         2019 Q3
                                                2020 Q1

                                                                                                    2021 Q2

                                                                                                                 2021 Q3
                                                          2020 Q2

                                                                      2020 Q3

                                                                                2020 Q4

                                                                                          2021 Q1

                                                                                                                           2022E

                                                                                                                                   2023E
        2019 Q1

                            2019 Q3
                  2019 Q2

                                      2019 Q4

     In the Q3 2021 average weighted rent in street retail was down by 13% compared to Q3 2019. The rent in shopping malls in Q3 2021 was 19% behind its 2019 level.
     We expect the rent in USD in street retail to fully recover to 2019 average rent in 2022 and 2023.
     In shopping malls the rent will fully recover to its 2019 level in 2022.. The recovery will be driven by growth of tenants’ revenues.

                                                                                                                                                                                                                                                                                    24
Occupancy more resilient to crisis than rents

Vacancy rate, Street Retail in Tbilisi                                                            Vacancy rate, Shopping malls in Tbilisi

    16%                                                                                             16%

    14%                                                                                             14%                                                15.0%

    12%                          12.8%                                                              12%
                                             12.4%
    10%                                                      11.0%                                  10%                                                               11.1%
                                                                                                              10.0%                         10.1%
               9.3%                                                          9.6%
    8%                                                                                              8%                        9.0%

    6%                                                                                              6%

    4%                                                                                              4%

    2%                                                                                              2%

    0%                                                                                              0%
                                              2021 E

                                                              2022 E
                2019

                                   2020

                                                                              2023 E

                                                                                                                                             2021 E

                                                                                                                                                         2022 E
                                                                                                               2019

                                                                                                                               2020

                                                                                                                                                                       2023 E
    Occupancy rates were more resilient than rents during COVID-19, especially in malls, due to rental holidays and long-term lease agreements with high exit penalties.
    Considering the pace of economic recovery, we project a gradual decline in street retail vacancy rates.
    Vacancies in shopping malls are expected to increase, as a result of opening of new malls.
    The pandemic had a negative impact on rental yields in street retail, as correction in rents was greater than in sale prices. In Q3 2021, yields stood at 8.9%, which was 2.3
     pp lower than in the same period of 2019.

                                                                                                                                                                                25
Legal Notice
This publication (the “Publication”) has been prepared and distributed by TBC Capital LLC (“TBC Capital”) member of TBC Bank Group PLC (“Group”) for informational purposes only and
independently of the respective companies mentioned herein. TBC Capital is operating and performing its professional services on the territory of Georgia and is duly authorized to
prepare and distribute this Publication on the territory of Georgia. Nothing in this Publication constitutes or forms part of an offer or solicitation or invitation to an offer to buy, sell or
subscribe for any assets or securities and nothing herein shall form the basis of any contract or commitment whatsoever or shall be considered as a recommendation to take any such
actions. Since distribution of this Publication may be restricted by law in certain jurisdictions, persons into whose possession this Publication comes are required by TBC Capital to
inform themselves about and to observe any and all restrictions applicable to them. As this Publication is not directed to or intended for distribution, directly or indirectly, to or use by
any person or entity in any jurisdiction where such distribution, publication, availability or use would be contrary to the applicable law or which would require any registration or
licensing within such jurisdiction, neither TBC Capital nor any member of the Group nor any of their respective director(s), partner(s), employee(s), affiliates, adviser(s) or agent(s)
(“Representatives”) accept any direct or indirect liability to any person in relation to the publication, distribution or possession of this Publication in or from any jurisdiction. This
Publication is not intended to provide any investment, business, tax and/or legal advice, and credit or any other evaluation. Recipients of this Publication are strongly required to make
their own independent investigation and appraisal of the matters discussed herein. Any investment decision should be made at the investor's sole discretion. Any and all information
contained in this Publication is subject to change without notice, and neither TBC Capital nor any member of the Group nor any of their Representatives are under any obligation to
update or keep information contained in this Publication. Distribution of this Publication, at any time, does not imply that information herein is correct, accurate and/or complete as of
any time after its preparation date or that there has been no change in business, financial condition, prospects, credit worthiness, status or affairs of the respective companies or
anyone else since that date. Accordingly, this Publication should not be considered as a complete description of the markets, industries and/or companies referred to herein and no
reliance should be placed on it. TBC Capital does not undertake to update this Publication or to correct any inaccuracies therein which may become apparent. The Publication may
include forward-looking statements, but not limited to, statements as to future operating results. Any “forward-looking statements”, which include all statements other than statements
of historical facts, involve known and unknown risks, uncertainties and other important factors beyond TBC Capital’s control that could cause the actual results, performance or
achievements to be materially different from future results, performance or achievements expressed or implied by such forward-looking statements. Such forward-looking statements
are based on numerous assumptions regarding present and future business strategies and the environment operating in the future. By their nature, forward-looking statements involve
risks and uncertainties because they relate to events and depend on circumstances that may or may not occur in the future. No assurances can be given that the forward-looking
statements in this document will be realized. TBC Capital does not intend to update such forward-looking statements. Opinions, forecasts, estimates and/or statements relating to
expectations regarding future events or the possible future performance of investments represent TBC Capital’s own assessment and interpretation of information available to it
currently. Information obtained from the third party sources believed to be reliable, but that there is no guarantee of the accuracy and/or completeness of such information. TBC
Capital does and seeks to do and any member of the Group may or seek to do business with companies covered in this Publication. Thus, investors should be aware that TBC Capital may
have a potential conflict of interest that could affect the objectivity of the information contained in this Publication. This Publication may not be reproduced, redistributed or published,
in whole or in part, in any form for any purpose, without the written permission of TBC Capital, and neither TBC Capital nor any member of the Group nor any of their Representatives
accept any liability whatsoever for the actions of third parties in this respect. TBC Capital makes no expressed or implied representation or warranty of usefulness in predicting the
future performance or in estimating the current or future value of any security or asset, and expressly disclaims all warranties of merchantability or fitness for a particular purpose or
use with respect to any data included in this Publication. Without limiting any of the foregoing and to the extent permitted by law, TBC Capital or any member of the Group or any of
their Representatives expressly disclaim all liability whatsoever (in negligence or otherwise) for any loss or damages however arising, directly or indirectly, from any use of this
Publication or its contents (including without limitation to the accuracy and/or completeness of information therein) or otherwise arising in connection with this Publication or for any
act or failure to act by any party on the basis of this Publication.

                                                                                                                                                                                                   26
TBC GROUP CHIEF ECONOMIST’S OFFICE    TBC CAPITAL RESEARCH

Otar Nadaraia | Chief Economist |     Mary Chachanidze, CFA | Managing Director |
onadaraia@tbcbank.com.ge              mchachanidze@tbccapital.ge
Ana Mjavanadze | Acting Head |        Irine Kvakhadze | Head of Research |
Macro-financial Analysis Division |   ikvakhadze@tbccapital.ge
anmzhavanadze@tbcbank.com.ge
                                      Andro Tvaliashvili | Senior Research Associate |
Juli Avlokhashvili | Analyst |        atvaliashvili@tbccapital.ge
Macro-financial Analysis Division |
javlokhashvili@tbcbank.com.ge         Giorgi Mzhavanadze | Senior Researcher |
                                      giomzhavanadze@tbccapital.ge

                                      Revaz Maisuradze | Research Analyst |
                                      remaisuradze@tbccapital.ge

                                      Mariam Surmava | Research Analyst |
                                      masurmava@tbccapital.ge

                                      Maka Koridze | Junior Research Analyst |
                                      mkoridze@tbccapital.ge

                                                                                         27
28
You can also read