Macular vessel density, branching complexity and foveal avascular zone size in normal tension glaucoma - Nature
←
→
Page content transcription
If your browser does not render page correctly, please read the page content below
www.nature.com/scientificreports
OPEN Macular vessel density, branching
complexity and foveal avascular
zone size in normal tension
glaucoma
Kelvin K. W. Cheng1, Beatrice L. Tan1, Lyndsay Brown1, Calum Gray2, Eleonora Bianchi1,
Baljean Dhillon1,2, Tom MacGillivray2 & Andrew J. Tatham1,2*
The aim of this study was to investigate the relationship between glaucoma severity and perifoveal
vessel density (pfVD), branching complexity, and foveal avascular zone (FAZ) size in normal tension
glaucoma (NTG). 31 patients with NTG washed out of glaucoma medications were subjected to tests
including; intraocular pressure measurement; standard automated perimetry; optical coherence
tomography (OCT) measurement of macular ganglion cell complex (mGCC), inner macular thickness
(IMT) and circumpapillary retinal nerve fibre layer (cpRNFL); and OCT angiography measurement of
pfVD, FAZ perimeter and multispectral fractal dimensions (MSFD). Eyes with more severe glaucoma
had significantly thinner mGCC and cpRNFL and lower pfVD. MD decreased by 0.4 dB (95% CI 0.1 to
0.6 dB, P = 0.007) for every 1% decrease in pfVD. Lower MSFD was observed in eyes with lower pfVD
and in patients with systemic hypertension. Multivariable analysis, accounting for age and OCTA
quality, found lower pfVD remained significantly associated with thinner IMT, thinner mGCC and
worse MD but not with MSFD. pfVD was reduced in NTG and was diminished in eyes with worse MD.
Macular vessel branching complexity was not related to severity of visual field loss but was lower in
patients with systemic hypertension.
Glaucoma is a heterogenous group of optic neuropathies causing characteristic changes to the optic nerve head
eld1. Though glaucoma is normally associated
and retinal nerve fibre layer (RNFL), with associated loss of visual fi
with raised intraocular pressure (IOP), a significant proportion of patients develop glaucoma with statistically
normal levels of IOP, referred to as normal tension glaucoma (NTG)2–5.
The pathogenesis of NTG is incompletely understood, but reduced ocular blood flow may contribute to its
onset and p rogression6. An association with migraine, Raynaud’s phenomenon, and primary vascular dysregula-
tion syndrome, in addition to a reported increased propensity for optic disc hemorrhages, suggests that vascular
dysfunction is i mportant7.
Optical coherence tomography angiography (OCTA) provides a non-invasive method of assessing retinal
vasculature as a proxy of microvascular health and recent studies have shown a reduction in vessel density within
the optic nerve head, peripapillary region, and macula (pfVD) in patients with glaucoma8–10. Whether changes
in pfVD measured using OCTA are a result of, or contribute to, glaucomatous neural losses remains uncertain;
however, impaired perfusion of the optic nerve head and retinal ganglion cell bodies has been suggested to play
an important role in glaucoma progression, and this may be of particular importance in patients who develop
glaucoma at statistically normal levels of IOP8,11,12.
OCTA therefore offers the potential to provide novel biomarkers of glaucoma, that may supplement more
commonly used measures obtained from optical coherence tomography (OCT), such as circumpapillary reti-
nal nerve fibre layer (cpRNFL) and macular ganglion cell complex (mGCC) thickness. Novel biomarkers may
improve ability to detect glaucoma and glaucoma progression, improve ability to determine treatment effect,
and better understand glaucoma pathogenesis.
Other potential markers of vascular integrity, not currently quantified using commercially available imaging
device software, include measures of the complexity of vessel branching pattern and of the size and shape of
the foveal avascular zone (FAZ). Fractal analysis is a technique for quantifying complex geometric patterns in
biological structures including the retinal vascular tree, with multispectral fractal dimensions (MSFD) an index
1
Princess Alexandra Eye Pavilion, NHS Lothian, 45 Chalmers Street, Edinburgh EH3 9HA, UK. 2Centre for Clinical
Brain Sciences, University of Edinburgh, Edinburgh, UK. *email: andrewjtatham@gmail.com
Scientific Reports | (2021) 11:1056 | https://doi.org/10.1038/s41598-020-80080-z 1
Vol.:(0123456789)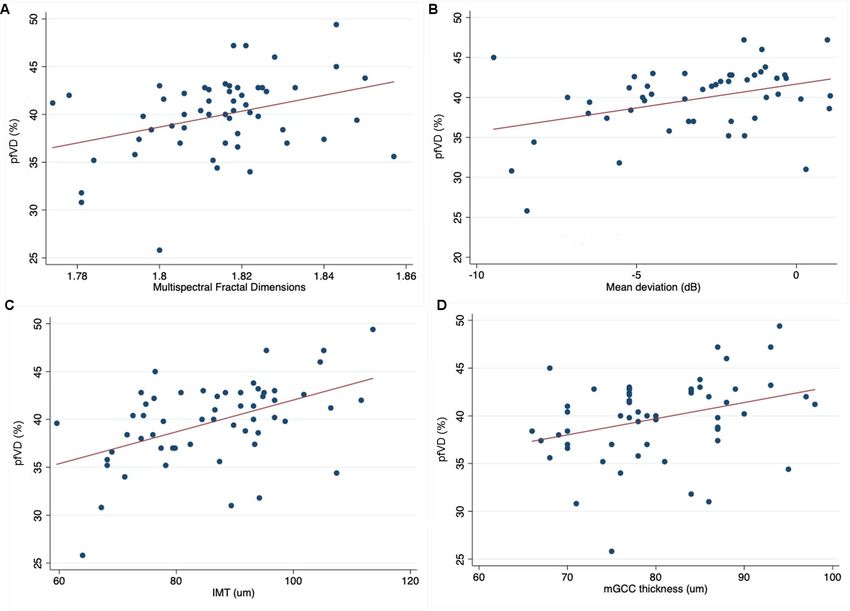
www.nature.com/scientificreports/
used to quantify the complexity of vessel branching. MSFD has proved its usefulness as a novel parameter in
several investigations into the use of retinal imaging for revealing signs of disease elsewhere in the human body
including cardiology and endocrinology13–16. Fractal dimensions have also been studied in neurodegenerative
diseases, with multiple studies reporting differences in fractal dimensions in Alzheimer’s disease, cognitive
impairment and s trokes17–21.
Vessel Assessment and Measurement Platform for Images of the Retina (VAMPIRE) is a software application
developed to allow efficient, semi-automatic quantification of retinal vessel characteristics based on fundus cam-
era images22. This has been used to demonstrate retinal microvascular abnormalities in several diseases including
hypertension and lacunar s troke23,24. Although VAMPIRE was originally used to analyze fundus photos, it has
been adapted to examine OCTA images, specifically to measure MSFD and the FAZ.
Fractal dimensions of the blood vessels around the optic nerve head has been shown to be reduced in patients
with advanced primary open angle glaucoma and associated with ocular hypertension when assessed using
fundus photographs25,26. To the best of our knowledge, this is the first study examining MSFD using macular
OCTA images in NTG. The aim of the current study was to further explore potential vascular biomarkers
for glaucoma by examining pfVD, MSFD and FAZ size in a cohort of patients with NTG and examining the
relationship between these metrics and conventional measures of glaucoma severity from standard automated
perimetry (SAP) and OCT. This is the first study to apply the VAMPIRE analysis software for OCTA to patients
with glaucoma.
Methods
A prospective observational study was conducted involving patients with NTG attending Princess Alexandra
Eye Pavilion, Edinburgh, UK. All participants had no recorded history of ever having had an IOP > 21 mmHg;
and all provided written informed consent prior to study inclusion. Methods were prospectively approved by the
South East Scotland Research Ethics Committee and adhered to the principles of the Declaration of Helsinki.
Participants were required to be willing to withhold IOP lowering treatments during a washout period on
the understanding that in the opinion of the investigator they could do so without significant risk. Those who
had undergone any form of previous glaucoma surgery or glaucoma laser treatment were excluded; as were
potential participants who had undergone previous corneal surgery, including laser refractive surgery, or who
had any concomitant corneal disease. We also excluded patients with diabetes mellitus due to the potential effect
on ocular blood flow.
A comprehensive ophthalmological examination was performed including slit lamp examination, gonioscopy,
dilated fundoscopy, pachymetry (Accutome PachPen, Keeler Ltd, Windsor, UK), standard automated perimetry
(SAP, 24-2 Swedish Interactive Threshold Algorithm (SITA) Fast, Humphrey Field Analyzer (Carl Zeiss Meditec,
Cambridge, UK). Glaucoma was defined by the presence of characteristic changes to the optic nerve head or
retinal nerve fibre layer (RNFL), in addition to the presence of a glaucomatous visual field defect on SAP. Details
of past medical history and current medications were recorded, with particular attention to whether there was a
history of systemic hypertension. Family history of glaucoma in a first degree relative was also recorded.
Following the screening procedure, eligible patients were instructed to stop IOP-lowering medications for a
washout period of up to 42 days depending on medication. Washout was for a minimum of 28 days for prosta-
glandin analogues and beta-blockers, 14 days for alpha-agonists, and 4 days for carbonic anhydrase inhibitors.
Patients in whom washout was not deemed safe were excluded from the study.
Following washout, patients attended for a further examination. IOP off medication was assessed using the
Ocular Response Analyzer (ORA G3, Reichert, Buffalo, NY, USA) to measure Goldmann correlated IOP (IOPg),
corneal compensated IOP (IOPcc) and corneal hysteresis (CH). Three measurements were taken from each eye
and the measurement with the best waveform score was used for analysis. Only measurements with a waveform
score > 5 were considered for inclusion. All IOP measurements were taken at 9 am.
Imaging and image analysis. OCT and OCTA imaging were performed using the RTVue XR Avanti
(Optovue, Inc., Fremont, CA, U.S.A.). The RTVue uses an 840 nm near-infrared light source with a 50 nm
bandwidth providing 70,000 A-scans per second. A three-dimensional optic nerve head scan was performed
to obtain RNFL thickness measurements within a 4 mm diameter circle centered on the optic disc. Each optic
nerve head scan, which consisted of 12 radial lines and 6 concentric rings, was used to create a RNFL thickness
map. RNFL measurement were taken from a 920 point 3.5 mm diameter sampling circle derived from the RNFL
thickness map, with the sampling circle centered on the optic disc. Macula OCT scans were also obtained using
a 3 × 3 mm volumetric scan from which average macular ganglion cell complex (mGCC) thickness and inner
macular thickness (IMT) (defined as the distance between the ILM and IPL) (Fig. 1) could be determined using
built-in segmentation software. mGCC thickness was defined as the thickness of the ganglion cell layer, inner
plexiform layer and RNFL within the 3 × 3 mm macular cube scan. All OCT scans were reviewed at the time of
imaging for artefact and segmentation errors, and if of insufficient quality were repeated. Scans were required to
have a signal strength index ≥ 40 with no segmentation failure of artefacts.
OCTA images were obtained at the same sitting and performed using a 3 × 3 mm macula scan with the split
spectrum amplitude-decorrelation angiography (SSADA) algorithm used to provide non-invasive visualization
of the retinal vascular network. In-built software automatically calculates pfVD as a percentage of measured area
occupied by flowing blood vessels defined as pixels with decorrelation values above a threshold. For this study
pfVD in the superficial retinal capillary plexus was analyzed from the 3 × 3 mm macula scan centered on the
fovea. The superficial capillary plexus was defined as vessels identified from the inner limiting membrane (ILM)
to the posterior margin of the inner plexiform layer (IPL). The analysis focused on pfVD, measured in an annular
region of the 3 × 3 mm macula scan with an inner diameter of 1 mm and outer diameter of 3 mm centered on the
Scientific Reports | (2021) 11:1056 | https://doi.org/10.1038/s41598-020-80080-z 2
Vol:.(1234567890)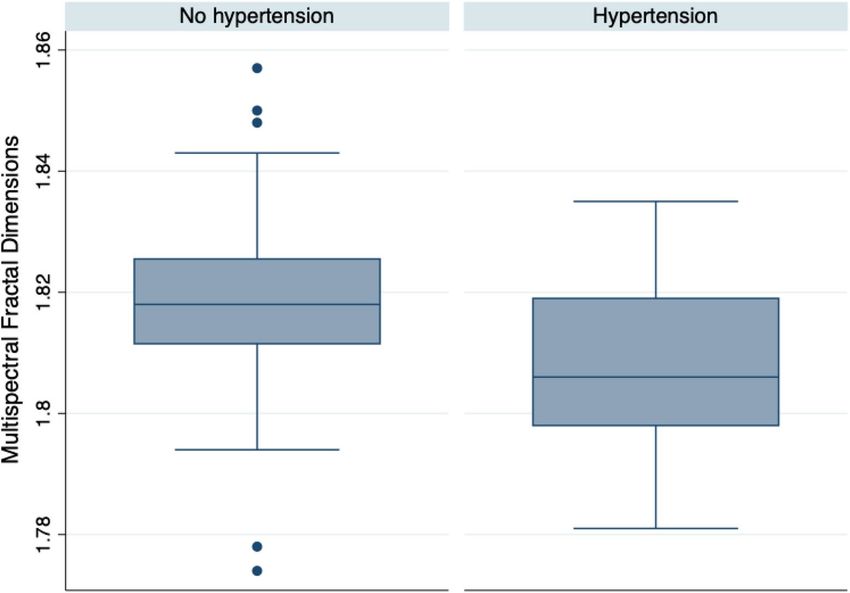
www.nature.com/scientificreports/
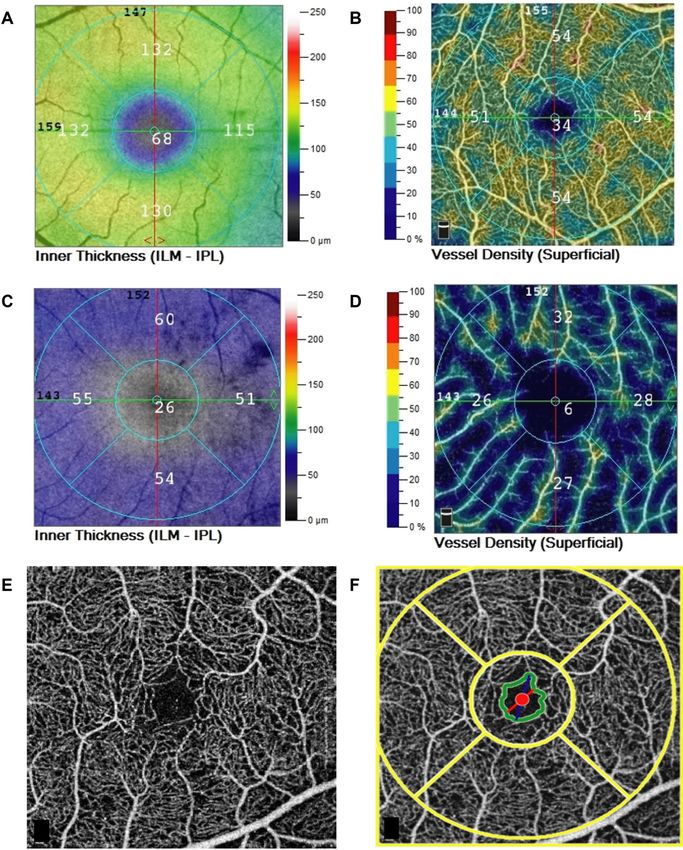
Figure 1. Example of OCT and OCTA images obtained from a healthy (A,B) and glaucomatous patient (C,D)
showing inner macular thickness (IMT) (A,C) and superficial pfVD (B,D). En face macular OCTA images are
shown (E,F), with (F) showing an OCTA image with the foveal avascular zone (FAZ) outlined (green ring).
fovea (Fig. 1)27. The quality of OCTA scans was assessed and those with quality scores (calculated automatically
by the device software) of ≤ 4, motion artefact, decentration or poor clarity were repeated. If the repeat scan was
also of poor quality the eye was excluded from the analysis.
Superficial capillary plexus OCTA images were also analyzed with VAMPIRE (Universities of Edinburgh
and Dundee, UK)23. Retinal vessels were segmented by denoting each pixel as vessel or non-vessel to produce
segmented images28. Resulting images were skeletonized using interactive deletion of pixels using MATLAB’s
Scientific Reports | (2021) 11:1056 | https://doi.org/10.1038/s41598-020-80080-z 3
Vol.:(0123456789)www.nature.com/scientificreports/
Age (years) 66.2 ± 7.9
Sex (female) 16 (50%)
Family history (%) 14 (43.8%)
Systemic hypertension (%) 17 (29.8%)
Worse eye (n = 31) Better eye (n = 26) P value
544.8 ± 33.7 542.8 ± 35.5
CCT (μm) 0.841
(IQ range 523 to 565) (IQ range 516 to 570)
9.8 ± 1.1 9.8 ± 0.9
CH (mmHg) 0.930
(IQ range 8.7 to 10.7) (IQ range 9.2 to 10.5)
17.5 ± 4.9 17.1 ± 4.5
IOPg—9am (mmHg) 0.808
(IQ range 14.4 to 20.5) (IQ range 13.9 to 19.5)
18.4 ± 4.3 18.1 ± 4.0
IOPcc—9am (mmHg) 0.779
(IQ range 16.1 to 21.0) (IQ range 15.8 to 19.8)
− 6.5 ± 5.0 − 1.4 ± − 1.8
MD (dB) < 0.001
(IQ range − 8.7 to − 2.9) (IQ range − 2.9 to − 0.6)
78.7 ± 8.1 82.0 ± 8.0
mGCC (μm) 0.134
(IQ range 73.0 to 84.0) (IQ range 77.0 to 87.0)
75.8 ± 14.1 77.7 ± 12.0
cpRNFL (μm) 0.596
(IQ range 70.0 to 80.0) (IQ range 69.0 to 85.0)
88.5 ± 12.2 84.4 ± 12.9
IMT (μm) 0.231
(IQ range 77.8 to 95.4) (IQ range 74.4 to 93.2)
38.4 ± 4.9 41.3 ± 2.9
pfVD (%) 0.012
(IQ range 35.6 to 42.6) (IQ range 39.8 to 42.8)
1.82 ± 0.02 1.81 ± 0.02
MFSD 0.636
(IQ range 1.81 to 1.82) (IQ range 1.80 to 1.82)
2.26 ± 0.61 2.27 ± 0.52
FAZ perimeter (mm) 0.941
(IQ range 1.70 to 2.27) (IQ range 1.76 to 2.70)
Table 1. Demographic and clinical characteristics of patients with normal tension glaucoma included in the
study. Values with a P-value < 0.05 are highlighted in bold.
bwmorph algorithm29. Fractal dimensions can be measured either using a monofractal or multifractal a pproach30.
In this study, we analyzed the images using the multifractal technique which is considered superior at char-
acterizing the retinal vascular tree in fundus imaging and which calculates multiple fractal dimensions from
multiple randomly chosen points within the skeletonized retinal vessels. One dimension from the spectrum,
D0, was selected as the most appropriate measure of fractal properties of the retinal vessels based on previous
work involving fundus imaging30.
Statistical analysis. Descriptive statistics included mean and standard deviation (SD) for normally dis-
tributed variables, with normality tested by inspection of histograms and using Shapiro–Wilk test. Student t-test
was conducted to examine differences in ocular and OCT parameters between better eyes and worse eyes, with
better eye defined as the eye with better SAP MD. The relationship between OCT and OCTA parameters and
potential confounders including age and OCT scan quality score was also explored using univariate regression
analyses. Parameters that are found to be significant on univariate regression analyses were further investigated
using multivariable regression analyses to determine whether relationships remained after accounting for the
effect of age and scan quality.
Regression analyses assume residuals are independent, however, there is likely to be correlation between eyes
of an individual. To avoid loss of data from excluding eyes, analyses were conducted comparing worse and bet-
ter eyes and regression analyses was performed with standard errors adjusted to take into account observations
within individuals being non-independent. Standard errors were calculated based on aggregate scores from
individual patients using the STATA ‘cluster’ option31. All statistical analyses were performed in STATA (version
15.1; StataCorp LP, College Station, TX). The alpha level (type I error) was set at 0.05.
Results
The study included 70 eyes of 35 patients, however 14 eyes were excluded due to poor quality OCTA images,
leaving 57 eyes of 31 patients. Demographic and clinical characteristics of participants are summarized in Table 1.
Participants had an average age of 66.2 ± 7.9 years, 16 of 32 (50%) were female and 14 of 32 (43.8%) had a history
of glaucoma in a first degree relative.
MD in the worse and better eyes was − 6.5 ± 5.0 and − 1.4 ± − 1.8 dB respectively (P < 0.001), with cpRNFL
thicknesses of 75.8 ± 14.1 and 77.7 ± 12.0 μm in worse and better eyes respectively (P = 0.596). pfVD was 38.4 ± 4.9
and 41.3 ± 2.9% in worse and better eyes (P = 0.012). There was no significant difference in FAZ perimeter between
worse and better eyes (P = 0.941).
Regression analyses found a significant relationship between thinner mGCC ( R2 = 0.22), thinner cpRNFL
(R2 = 0.12), lower pfVD (R2 = 0.14), and worse MD (Table 2). MD decreased by 0.26 dB (95% CI 0.12 to 0.40 dB,
Scientific Reports | (2021) 11:1056 | https://doi.org/10.1038/s41598-020-80080-z 4
Vol:.(1234567890)www.nature.com/scientificreports/
Coefficient/odds ratio* 95% CI P value
Age (years) − 0.004 − 0.161 to 0.152 0.958
Gender* (female) 0.975 0.861 to 1.105 0.695
Hypertension* (yes) 0.951 0.839 to 1.079 0.439
CCT (μm) − 0.101 − 0.046 to 0.026 0.577
CH (mmHg) − 0.207 − 1.626 to 1.033 0.656
IOPg (mmHg) 0.103 − 0.178 to 0.384 0.465
IOPcc (mmHg) 0.127 − 0.188 to 0.443 0.420
mGCC (μm) 0.261 0.123 to 0.399 < 0.001
cpRNFL (μm) 0.119 0.029 to 0.209 0.010
IMT (μm) 0.094 − 0.002 to 0.190 0.056
pfVD (%) 0.377 0.109 to 0.645 0.007
MFSD − 64.83 − 133.36 to 3.69 0.063
FAZ perimeter (mm) 0.566 − 1.700 to 2.831 0.619
Table 2. Results of univariable regression analyses examine the relationship between MD and other variables.
Values with a P-value < 0.05 are highlighted in bold.
Coefficient/odds ratio* 95% CI P value
Age (years) − 0.21 − 0.35 to − 0.07 0.004
Gender* (female) 0.960 0.846 to 1.089 0.525
Hypertension* (yes) 0.877 0.759 to 1.012 0.072
CCT (μm) − 0.010 − 0.045 to 0.024 0.554
CH (mmHg) 0.527 − 0.529 to 1.582 0.321
MD (dB) 0.359 0.104 to 0.615 0.007
IOPg (mmHg) − 0.118 − 0.355 to 0.118 0.320
IOPcc (mmHg) − 0.166 − 0.431 to 0.100 0.213
mGCC (μm) 0.170 0.034 to 0.205 0.015
cpRNFL (μm) 0.063 − 0.027 to 0.153 0.165
IMT (μm) 0.166 0.085 to 0.248 < 0.001
MFSD 82.91 19.81 to 146.01 0.011
FAZ perimeter (mm) − 2.02 − 4.10 to 0.06 0.057
OCTA quality 2.046 1.227 to 2.865 < 0.001
Table 3. Results of univariable regression analyses examine the relationship between pfVD and other
variables. Values with a P-value < 0.05 are highlighted in bold.
P < 0.001) for every 1 μm decrease in mGCC thickness, by 0.12 dB (95% CI 0.03 to 0.21 dB, P = 0.010) for every
1 μm decrease in cpRNFL and by 0.38 dB (95% CI 0.11 to 0.65 dB, P = 0.007) for every 1% decrease in pfVD.
There was also a significant relationship between lower pfVD and older age (R2 = 0.14), thinner mGCC
(R = 0.10), thinner IMT ( R2 = 0.24), lower MFSD ( R2 = 0.11) and worse OCTA scan quality score ( R2 = 0.32)
2
(Table 3, Fig. 2). pfVD decreased by 0.17% (95% CI 0.03 to 0.21, P = 0.015) for every 1 μm decrease in mGCC,
by 0.17% (95% CI 0.09 to 0.25, P < 0.001) for every 1 μm decrease in IMT, and by 82.9% (95% CI 19.81 to 146.01,
P = 0.011) for every 1 μm decrease in MFSD. pfVD was also significantly higher with better OCTA quality score,
and younger age, with a 0.21% (95% CI 0.35 to 0.07, P = 0.004) decrease in pfVD per year older.
Multispectral fractal dimensions ranged from 1.774 to 1.857. Lower multispectral fractal dimensions were
found in eyes with lower pfVD, worse quality score, and in patients with systemic hypertension, but there were no
other significant associations (Table 4). Mean MSFD was 1.82 ± 0.02 in non-hypertensives compared to 1.81 ± 0.02
in hypertensives (P = 0.036) (Fig. 3). A regression analysis examining the potential relationship between MD and
multispectral fractal dimensions found a 0.1 increase in MSFD was associated with a 6.5 dB worse MD, however
the 95% confidence interval crossed zero, at − 3.7 to 13.3 (P = 0.063), indicating non-significance.
In multivariable analyses, accounting for age and quality score, lower pfVD on OCTA remained signifi-
cantly associated with thinner IMT, worse MD and thinner mGCC, but not with MSFD (Table 5). The relation-
ship between MSFD and hypertension remained after accounting for quality score in multivariable analysis
(OR = 1.91 × 10⁻²¹, 95% CI 1.88 × 10−39 to 0.002, P = 0.024).
Discussion
This study examined the relationship between established functional and structural markers of glaucoma and
measures of retinal vasculature integrity in patients with NTG washed out of glaucoma medication. At present,
OCTA devices perform only limited automated analyses, largely restricted to quantification of pfVD. We explored
Scientific Reports | (2021) 11:1056 | https://doi.org/10.1038/s41598-020-80080-z 5
Vol.:(0123456789)www.nature.com/scientificreports/
Figure 2. (A) Relationship between multispectral fractal dimensions and average pfVD ( R2 = 0.124, P = 0.008).
(B) Relationship between MD and average pfVD (%) (R2 = 0.136, P = 0.007). (C) Relationship between IMT
and average pfVD (%) (R2 = 0.237, P < 0.001). (D) Relationship between IMT and average pfVD (%) (R2 = 0.104,
P = 0.015).
Coefficient/odds ratio* 95% CI P value
Age (years) − 0.001 − 0.001 to 0.000 0.064
Gender* (female) 0.0001 5.31e−17 to 9.39e+09 0.638
8.68 × 10⁻³³
Hypertension* (yes) 5.62 × 10 −17
0.044
to 0.364
CCT (μm) 0.000 − 0.001 to 0.002 0.370
CH (mmHg) 0.000 − 0.005 to 0.004 0.960
MD (dB) − 0.001 − 0.002 to 0.000 0.063
IOPg (mmHg) 0.00 − 0.00q to 0.001 0.838
IOPcc (mmHg) 0.00 − 0.001 to 0.001 0.871
mGCC (μm) 0.00 − 0.001 to 0.000 0.208
cpRNFL (μm) 0.00 0.00 to 0.00 0.808
pfVD (%) 0.001 0.00 to 0.002 0.008
IMT (μm) 0.00 0.00 to 0.001 0.420
FAZ perimeter (mm) − 0.007 − 0.015 to 0.001 0.079
OCTA quality 0.004 0.001 to 0.008 0.024
Table 4. Results of univariable regression analyses examine the relationship between MSFD and other
variables. Values with a P-value < 0.05 are highlighted in bold.
whether other characteristics of the superficial retinal capillary network might provide useful information in
the evaluation of glaucoma, in particular, measurement of the complexity of capillary branching, measured
as MSFD. MSFD is an interesting area for study given the changes in MSFD noted in patients with conditions
such as hypertension and lacunar stroke and the role of ocular blood flow in the pathogenesis of glaucoma23,24.
Scientific Reports | (2021) 11:1056 | https://doi.org/10.1038/s41598-020-80080-z 6
Vol:.(1234567890)www.nature.com/scientificreports/
Figure 3. Box plot summarizing MSFD in glaucoma patients with and without systemic hypertension
(P = 0.036).
Coefficient 95% CI P value
IMT (μm) 0.15 0.08 to 0.21 < 0.001
Age (years) − 0.09 − 0.20 to 0.02 0.104
Quality score 1.74 1.02 to 2.46 < 0.001
MSFD 29.63 − 30.33 to 89.59 0.217
Age (years) − 0.06 − 0.22 to 0.11 0.495
Quality score 1.77 0.86 to 2.67 < 0.001
Hypertension (yes) − 1.20 − 3.97 to 1.58 0.391
MD (dB) 0.38 0.18 to 0.58 < 0.001
Age (years) − 0.14 − 0.26 to − 0.03 0.017
Quality score 1.59 0.82 to 2.37 < 0.001
mGCC (μm) 0.19 0.09 to 0.30 < 0.001
Age (years) − 0.12 − 0.23 to − 0.00 0.045
Quality score 1.90 1.14 to 2.66 < 0.001
Table 5. Results of multivariable regression analyses examine the relationship between pfVD and IMT, MFSD,
MD and mGCC, accounting for age, quality score and hypertension.
In agreement with previous OCTA studies, we observed a significant relationship between worse MD and
lower pfVD, which in this study was measured in the perifoveal superficial capillary network9,12,32–37. As expected,
there was also a significant relationship between worse MD and thinner mGCC and cpRNFL (Table 2). There
was a 0.377 dB (95% CI 0.109 to 0.645 dB, P = 0.007) decrease in MD for every 1% decrease in pfVD. In addition,
pfVD was significantly lower in the worse eyes of glaucoma patients (P = 0.012), when worse eye was determined
according to MD. pfVD was lower in eyes with thinner mGCC and IMT, and there was a relationship between
lower pfVD and lower MSFD in univariable analysis. pfVD also decreased with age, at a rate of 0.21% (95% CI
0.07 to 0.35%) per year, however, even after accounting for age, and quality of the OCTA scan, the relationship
between lower pfVD and thinner IMT, thinner mGCC and worse MD remained. In contrast, accounting for
these confounders, the relationship between pfVD and MSFD was no longer significant.
MSFD was not significantly associated with MD, however, the 95% CI for the regression coefficient only just
crossed zero (− 133.36 to 3.69, P = 0.063). The study was limited by a relatively small sample size and a lack of
patients with severe glaucoma. It is therefore possible that the analysis was underpowered to detect an associa-
tion between MSFD and MD and given the known association between MSFD and systemic vascular diseases,
Scientific Reports | (2021) 11:1056 | https://doi.org/10.1038/s41598-020-80080-z 7
Vol.:(0123456789)www.nature.com/scientificreports/
further study of MSFD in glaucoma is warranted. In addition, considering the relative lack of test points in the
central visual field using the 24-2 SAP test pattern, it may also be useful to examine the relationship between
MFSD and the results from 10-2 visual fields, however, this comparison may also find poor correlation, given
the lack of relationship between MFSD and mGCC and IMT (Table 4).
The other novel vascular parameter investigated was FAZ perimeter, however this did not seem to be a useful
marker of glaucoma in this particular cohort. There was no evidence of a significant difference in FAZ perimeter
between better and worse eyes, and no relationship between MD and FAZ. Though the relationship between
FAZ and pfVD was not statistically significant (P = 0.057, Table 3), again the 95% CI interval only just crossed
zero (coefficient − 2.02, 95% CI − 4.10 to 0.06), and it may be worth examining this potential relationship in a
larger cohort.
Unfortunately, 14 eyes were excluded from the analysis due to poor quality OCTA scans, and even in those
remaining, OCTA quality score significantly affected measurements. For this reason, it was important to include
quality score in the multivariable analyses examining the relationship between measurements obtained from
OCTA and other parameters. Table 4 shows that even after accounting for quality score, pfVD remained associ-
ated with MD, mGCC thickness, and IMT. Interestingly, our sample included 17 patients (29.8%) on treatment
for systemic hypertension. Although patients with hypertension had significantly lower MSFD (P = 0.036), hyper-
tension was not associated with MD or pfVD on multivariate analyses. However, it does emphasize the potential
value of measures of vascular branching complexity as a biomarker of systemic h ypertension23,24.
We recognize that this study has several limitations and have already emphasized the small sample size and
lack of patients with advanced glaucoma. Due to the glaucoma medication washout required for participation
in this study, it was not deemed safe to include patients with advanced disease. Patients were asked to stop
glaucoma medications to obtain a baseline IOP and due to the potential effects of IOP lowering medication on
OCTA measurements, however, it would be useful to repeat the study without stopping medications to enable
safe recruitment of more patients with advanced disease. The study was also limited by a cross-sectional design
prohibiting analysis of the temporal relationship between changes to pfVD, MSFD, mGCC, cpRNFL and visual
fields. In addition, we only examined average thickness and pfVD measurements and only examined one sum-
mary index of visual field loss. It is possible that examination of localized changes may reveal other associations,
however, the small sample size and diversity of visual field defects did not make this feasible. A further limitation
was that the diagnosis of systemic hypertension was based on history and patients were using a range of anti-
hypertensive medications at the time of imaging.
In conclusion, this study provides further evidence of changes to retinal vasculature in glaucoma. Perifoveal
vascular density was significantly lower in worse affected compared to fellow eyes and there was a significant
relationship between pfVFD and MD. However, as pfVD also declines with age and is affected by quality of the
OCTA image, it is important to take into account these potential confounders when interpreting pfVD data.
Additional measures of integrity of retinal vasculature including MSFD and FAZ size were not related to mark-
ers of glaucoma severity and there was no significant difference in these parameters between better and worse
eyes, however, MSFD was significantly reduced in NTG patients with systemic hypertension. There is growing
evidence of potential value of MSFD as a biomarker for cardiovascular and neurodegenerative disease, which
warrants further study in glaucoma.
Received: 5 July 2020; Accepted: 29 October 2020
References
1. Weinreb, R. N. & Khaw, P. T. Primary open-angle glaucoma. Lancet Lond. Engl. 363, 1711–1720 (2004).
2. Iwase, A. et al. The prevalence of primary open-angle glaucoma in Japanese: The Tajimi Study. Ophthalmology 111, 1641–1648
(2004).
3. Mitchell, P., Smith, W., Attebo, K. & Healey, P. R. Prevalence of open-angle glaucoma in Australia. The Blue Mountains Eye Study.
Ophthalmology 103, 1661–1669 (1996).
4. Sommer, A. et al. Relationship between intraocular pressure and primary open angle glaucoma among White and Black Americans:
The Baltimore eye survey. Arch. Ophthalmol. 109, 1090–1095 (1991).
5. Dielemans, I. et al. The prevalence of primary open-angle glaucoma in a population-based study in The Netherlands. The Rot-
terdam Study. Ophthalmology 101, 1851–1855 (1994).
6. Galassi, F., Giambene, B. & Varriale, R. Systemic vascular dysregulation and retrobulbar hemodynamics in normal-tension glau-
coma. Invest. Ophthalmol. Vis. Sci. 52, 4467–4471 (2011).
7. Bojikian, K. D. et al. Optic disc perfusion in primary open angle and normal tension glaucoma eyes using optical coherence
tomography-based microangiography. PLoS ONE 11, e0154691 (2016).
8. Yarmohammadi, A. et al. Optical coherence tomography angiography vessel density in healthy, glaucoma suspect, and glaucoma
eyes. Invest. Ophthalmol. Vis. Sci. 57, OCT451–OCT459 (2016).
9. Penteado, R. C. et al. Optical coherence tomography angiography macular vascular density measurements and the central 10-2
visual field in glaucoma. J. Glaucoma 27, 481–489 (2018).
10. Hou, H. et al. Macula vessel density and thickness in early primary open-angle glaucoma. Am. J. Ophthalmol. 199, 120–132 (2019).
11. Bonomi, L. et al. Vascular risk factors for primary open angle glaucoma: The Egna–Neumarkt Study. Ophthalmology 107, 1287–1293
(2000).
12. Moghimi, S. et al. Macular and optic nerve head vessel density and progressive retinal nerve fiber layer loss in glaucoma. Ophthal-
mology 125, 1720–1728 (2018).
13. Liew, G. et al. The retinal vasculature as a fractal: methodology, reliability, and relationship to blood pressure. Ophthalmology 115,
1951-1956.e1 (2008).
14. Cheung, C. Y. et al. Quantitative and qualitative retinal microvascular characteristics and blood pressure. J. Hypertens. 29, 1380–
1391 (2011).
15. Avakian, A. et al. Fractal analysis of region-based vascular change in the normal and non-proliferative diabetic retina. Curr. Eye
Res. 24, 274–280 (2002).
16. Cheung, N. et al. Quantitative assessment of early diabetic retinopathy using fractal analysis. Diabetes Care 32, 106–110 (2009).
Scientific Reports | (2021) 11:1056 | https://doi.org/10.1038/s41598-020-80080-z 8
Vol:.(1234567890)www.nature.com/scientificreports/
17. Frost, S. et al. Retinal vascular biomarkers for early detection and monitoring of Alzheimer’s disease. Transl. Psychiatry 3, e233
(2013).
18. Cheung, C.Y.-L. et al. Microvascular network alterations in the retina of patients with Alzheimer’s disease. Alzheimers Dement. J.
Alzheimers Assoc. 10, 135–142 (2014).
19. Williams, M. A. et al. Retinal microvascular network attenuation in Alzheimer’s disease. Alzheimers Dement. Diagn. Assess. Dis.
Monit. 1, 229–235 (2015).
20. Cheung, C. Y. et al. Retinal vascular fractal dimension is associated with cognitive dysfunction. J. Stroke Cerebrovasc. Dis. 23,
43–50 (2014).
21. Ong, Y.-T. et al. Microvascular structure and network in the retina of patients with ischemic stroke. Stroke 44, 2121–2127 (2013).
22 Ng, E. Y. K., Tan, J. H., Acharya, U. R. & Suri, J. S. Human Eye Imaging and Modeling (CRC Press, Boca Raton, 2012).
23. Doubal, F. N. et al. Fractal analysis of retinal vessels suggests that a distinct vasculopathy causes lacunar stroke. Neurology 74,
1102–1107 (2010).
24. Kirin, M. et al. Determinants of retinal microvascular features and their relationships in two European populations. J. Hypertens.
35, 1646–1659 (2017).
25. Ciancaglini, M. et al. Fractal dimension as a new tool to analyze optic nerve head vasculature in primary open angle glaucoma.
Vivo 29, 273–279 (2015).
26. Wu, R. et al. Retinal vascular geometry and glaucoma: The Singapore Malay eye study. Ophthalmology 120, 77–83 (2013).
27. Jia, Y. et al. Split-spectrum amplitude-decorrelation angiography with optical coherence tomography. Opt. Express 20, 4710–4725
(2012).
28. Soares, J. V. B., Leandro, J. J. G., Cesar, R. M., Jelinek, H. F. & Cree, M. J. Retinal vessel segmentation using the 2-D Gabor wavelet
and supervised classification. IEEE Trans. Med. Imaging 25, 1214–1222 (2006).
29. Lam, L., Lee, S.-W. & Suen, C. Y. Thinning methodologies—a comprehensive survey. IEEE Trans. Pattern Anal. Mach. Intell. 14,
869–885 (1992).
30. Stosic, T. & Stosic, B. D. Multifractal analysis of human retinal vessels. IEEE Trans. Med. Imaging 25, 1101–1107 (2006).
31. Rogers, W. H. Regression standard errors in clustered samples. Stata Tech. Bull. 13, 19–23 (1993).
32. Wang, Y. et al. Macular vessel density versus ganglion cell complex thickness for detection of early primary open-angle glaucoma.
BMC Ophthalmol. 20, 17 (2020).
33. Kromer, R., Glusa, P., Framme, C., Pielen, A. & Junker, B. Optical coherence tomography angiography analysis of macular flow
density in glaucoma. Acta Ophthalmol. (Copenh.) 97, e199–e206 (2019).
34. Richter, G. M. et al. Structural and functional associations of macular microcirculation in the ganglion cell-inner plexiform layer
in glaucoma using optical coherence tomography angiography. J. Glaucoma 27, 281–290 (2018).
35. Chen, H.S.-L., Liu, C.-H., Wu, W.-C., Tseng, H.-J. & Lee, Y.-S. Optical coherence tomography angiography of the superficial micro-
vasculature in the macular and peripapillary areas in glaucomatous and healthy eyes. Invest. Ophthalmol. Vis. Sci. 58, 3637–3645
(2017).
36. Shoji, T. et al. Progressive macula vessel density loss in primary open-angle glaucoma: a longitudinal study. Am. J. Ophthalmol.
182, 107–117 (2017).
37. Takusagawa, H. L. et al. Projection-resolved optical coherence tomography angiography of macular retinal circulation in glaucoma.
Ophthalmology 124, 1589–1599 (2017).
Author contributions
K.C.—Data acquisition, drafting, revision and final approval of manuscript, data analysis and statistics, data
interpretation. B.T.—Data acquisition, drafting, revision and final approval of manuscript, data interpretation.
L.B.—data acquisition, drafting, revision and final approval of manuscript. C.G.—Creation of new software used
in work, drafting, revision and final approval of manuscript. E.B.—Data acquisition. B.D.—Revision and final
approval of manuscript. T.M.—Creation of new software used in work, revision and final approval of manuscript.
A.J.T.—Concept and study design, data interpretation, data analysis and statistics, drafting, revision and final
approval of manuscript.
Competing interests
The authors declare that there are no conflicts of interest regarding the publication of this article. Disclosures:
Dr. A.J.T. provides research support for Allergan, is a speaker for Allergan, Heidelberg Engineering, Santen and
Thea and is a consultant for Allergan and Santen.
Additional information
Correspondence and requests for materials should be addressed to A.J.T.
Reprints and permissions information is available at www.nature.com/reprints.
Publisher’s note Springer Nature remains neutral with regard to jurisdictional claims in published maps and
institutional affiliations.
Open Access This article is licensed under a Creative Commons Attribution 4.0 International
License, which permits use, sharing, adaptation, distribution and reproduction in any medium or
format, as long as you give appropriate credit to the original author(s) and the source, provide a link to the
Creative Commons licence, and indicate if changes were made. The images or other third party material in this
article are included in the article’s Creative Commons licence, unless indicated otherwise in a credit line to the
material. If material is not included in the article’s Creative Commons licence and your intended use is not
permitted by statutory regulation or exceeds the permitted use, you will need to obtain permission directly from
the copyright holder. To view a copy of this licence, visit http://creativecommons.org/licenses/by/4.0/.
© The Author(s) 2021
Scientific Reports | (2021) 11:1056 | https://doi.org/10.1038/s41598-020-80080-z 9
Vol.:(0123456789)You can also read