Magellan Ammonia Pipeline Closure: An Impact Assessment - July 2019 - Fertecon - Agribusiness Intelligence
←
→
Page content transcription
If your browser does not render page correctly, please read the page content below

Fertecon
                       Agribusiness intelligence

Magellan Ammonia
Pipeline Closure:
An Impact Assessment
July 2019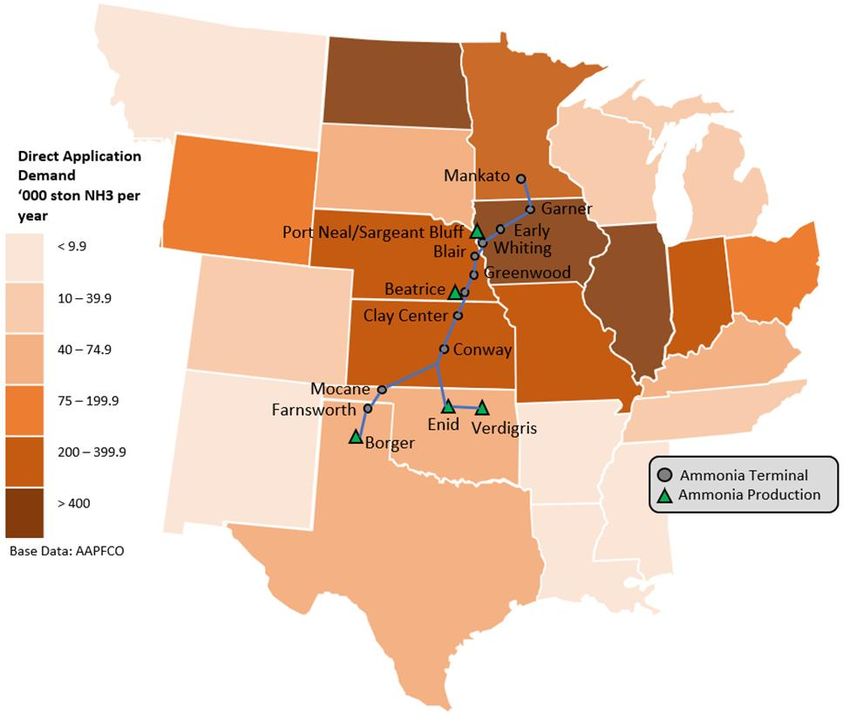
Magellan Ammonia Pipeline Closure: An Impact Assessment

July 2019

CONTENTS

1    Magellan Ammonia Pipeline Closure: An Impact Assessment ............................................................ 2

     1.1    Magellan Ammonia Pipeline Closure ...................................................................................................................................2

     1.2    Bullet-Point Summary ..........................................................................................................................................................2

     1.3    Overview of the Magellan Pipeline ......................................................................................................................................3

     1.4    Why is it closing? ..................................................................................................................................................................4

     1.5    What will the impact be? .....................................................................................................................................................6

     1.6    Conclusion ..........................................................................................................................................................................10

     1.7    Appendix ............................................................................................................................................................................10

© 2019 IHS Markit | July 2019                                                                      1                                                                www.fertecon.com
Magellan Ammonia Pipeline Closure: An Impact Assessment

1      Magellan Ammonia Pipeline Closure: An Impact Assessment

1.1    Magellan Ammonia Pipeline Closure

Magellan Midstream Partners, L.P. announced 31 January in its Q4 2018 financial results that it had made the decision to
discontinue commercial operations of the Magellan ammonia pipeline beginning in late 2019 due to the system’s low profitability
and the expected decline in anhydrous ammonia production.

Magellan is expected to start closing the southern end of the pipeline in September 2019 and the northern end in March 2020,
when current commitments with customers come to an end. The terminals along the pipeline, about half of which are owned by
other parties, will most likely continue to be utilized by either railing or trucking in the ammonia, though some will need to be
retrofitted to do so.

1.2    Bullet-Point Summary

       •   The main line of the Magellan ammonia pipeline was built in 1968
       •   The Magellan ammonia pipeline generates revenue by volumes shipped and by terminalling fees
       •   Magellan primarily serves three companies – CF, Koch, and Nutrien – but also indirectly serves all their ammonia
           customers across the Plains and Western Cornbelt
       •   Merchant ammonia from the 3 main injecting sites – Borger (Nutrien), Enid (Koch), and Verdigris (CF) –
           is estimated at 785,000 t/y post-2017, compared to 1.424 million t before
       •   Shipments on the Magellan in 2018-2019 are estimated at 325-525,000 t/y, compared to 671,000 t/y from 1996-2012
       •   Substantial maintenance work is reportedly required and considering declining revenues,
           Magellan can no longer justify operating the pipeline
       •   The closure announcement did not come as a surprise to the domestic fertilizer industry
       •   Producers have taken steps ahead of the closure, e.g. investing in storage, truck fleets,
           and alternative marketing strategies
       •   Trade flows will mostly remain the same, as many terminals and storage capacity along the pipeline
           will continue to be used and fed by the same production sources
       •   However, distributors will need to rely on other means of transportation – mostly truck but also barge, rail, and pipeline
           – but this will be costlier and less timely
       •   Freight advantageous customers of the Magellan pipeline are estimated to face a $0-40/ston cost/price increase,
           holding everything else constant, to replace tons that were historically pipelined
       •   One change in trade flow will be from Verdigris where CF has the option to ship barges
       •   More tonnes from Verdigris are likely to be barged to the Gulf for export
       •   These tonnes could be replaced by increased shipments to the Cornbelt from CF’s Medicine Hat plant in Alberta as well
           as increased injections from CF’s Donaldsonville into the NuStar pipeline
       •   Increased imports into the US Gulf for the NuStar pipeline is also an option if CF decides to focus more on exports
           rather than domestic direct application demand
       •   Ultimately, the loss of efficiency that is provided by the pipeline will lead to increased farm-gate ammonia prices for
           farmers in the Central Plains and to a lesser the Western Cornbelt
       •   Over time this may support the general farmer movement away from direct application ammonia towards the usage of
           other nitrogen fertilizer products

© 2019 IHS Markit | July 2019                                         2                                          www.fertecon.com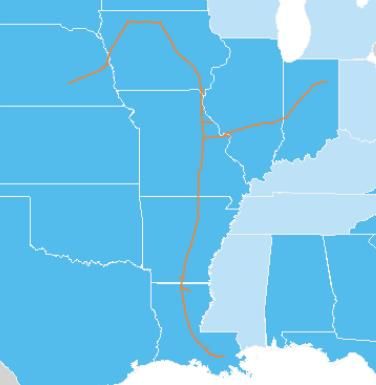
Magellan Ammonia Pipeline Closure: An Impact Assessment

1.3    Overview of the Magellan Pipeline

MAGELLAN AMMONIA PIPELINE

The Magellan 1,100-mile common carrier ammonia pipeline system (shown in blue above) was the worlds’ first common carrier
ammonia pipeline. The main line was completed in 1968. It is one of two ammonia pipelines operating in the US.

There are two legs on the southern end of the pipeline. The western leg originates in Borger, Texas at the Nutrien nitrogen facility
and runs north through the panhandle of Texas to Partridge, Kansas where it intersects with the eastern leg. The eastern leg begins
in Verdigris, Oklahoma at the CF plant and runs west to Koch’s facility at Enid before turning north to connect with the western leg
in Partridge, Kansas. From there the pipeline runs north into southeast Nebraska where a small leg splits off westward to Koch’s
Beatrice plant. The pipeline then crosses the Iowa border between Sioux City and Omaha. A small leg splits off to CF’s Port Neal
facility outside of Sioux City. From the Iowa/Nebraska border, the pipeline runs northeast to Garner, Iowa, a major ammonia hub
for the Cornbelt, and then turns northwest, finally ending in Mankato, Minnesota.

The Magellan ammonia pipeline has an annual maximum capacity of 900,000 stons per year. It mostly receives product from
production facilities in Texas and Oklahoma and delivers it to terminals in the Midwest. There are essentially 13 main delivery
points along the pipeline system. From these locations the ammonia is either stored for future use or distributed to end-
users/retailers, primarily in the agricultural industry, across Iowa, Kansas, Minnesota, Missouri, Nebraska, Colorado, Oklahoma,
and South Dakota.

Ammonia can also be injected at other points along the pipeline. For example, ammonia is sometimes transferred from the NuStar
pipeline at Garner, Iowa into the Magellan terminal at the same location, or vice-versa. Also, if there is excess ammonia at the
storage facilities along the pipeline, it can be injected back in. At certain times, CF has also trucked ammonia from its production

© 2019 IHS Markit | July 2019                                         3                                          www.fertecon.com
Magellan Ammonia Pipeline Closure: An Impact Assessment

facility in Woodward, Oklahoma to inject into the pipeline terminal at Mocane, Oklahoma. Nutrien, when possible and necessary,
has also pulled tons into Borger to be upgraded when ammonia production on site was unable to meet requirements, for example
due to maintenance work or unplanned outages of the ammonia plants.

In the past the pipeline also served to transport ammonia to other plants to be upgraded into other nitrogen products. For
example, Agrium used to ship ammonia from Borger to be upgraded into ammonium nitrate at its Homestead plant in Nebraska.
However, Agrium discontinued ammonium nitrate operations in 2005 and has since only used Homestead for distribution
purposes. CF could theoretically pipeline ammonia from Verdigris to Port Neal, or vice-versa, to be upgraded but nameplate
capacity at Port Neal suggests more than enough ammonia can be produced on site. Similarly, Koch could pipeline ammonia from
Enid to Beatrice but there is not a defined requirement.

The primary competition for the Magellan system comes from truck and rail carriers, though rail shipments have come under
pressure over recent years, as a result of increased regulation combined with rail companies’ concerns over potential liability in the
event of an incident. This has led to an unwillingness of rail operators to carry ammonia; however, the Common Carrier Obligations
in the US prevent them from denying access to ammonia users, and their response has been to escalate freight rates in order to
minimize ammonia shipments.

In the northern markets Magellan also competes with the NuStar ammonia pipeline, which transports domestically produced and
imported ammonia from the US Gulf into the Cornbelt. More detail on the NuStar can be found in the Impact section below.

The Magellan ammonia pipeline system primarily generates revenue through transportation tariffs (see tariff rates in the Appendix)
on volumes shipped. Magellan also generates revenues from terminalling and service fees at the six sites which it owns along the
pipeline.

Magellan owns all of the terminal assets at Mocane, OK, Conway, KS, and Whiting, IA. Magellan shares the assets at Greenwood,
NE, Mankato, MN, and Clay Center, KS with Enterprise Products. There are convertible bays at these shared sites which allows for
Enterprise to use the terminals for shipping propane during the propane season while Magellan can utilize them during the
ammonia season.

The pipeline mostly ships product for the three companies who own production facilities that inject directly into the pipeline: CF
Industries’ plant in Verdigris, OK; Koch’s Enid, OK facility; and Nutrien’s (ex-Agrium) plant in Borger, TX. Magellan has agreements
with these three customers that contain minimum volume commitments and volume incentives (see details in Appendix). Magellan
has stated that one of these contracts expires in 2019 while the other two expire in 2020.

Magellan has not reported ammonia volumes shipped on the pipeline since 2012 when it shipped 770,000 stons (698,533 t). From
1996-2012, the Magellan pipeline moved an average of 671,000 t ammonia per year. This means the Magellan pipeline was used in
transporting around 15-20% of all direct application ammonia consumed in the US each year (Source: Magellan, Fertecon,
AAPFCO). In the company’s 2012 10-k report, Magellan stated it had 3-year rolling agreements with its three main customers, in
which an aggregate minimum total of 575,000 t was agreed to be shipped during July 2012 - June 2013. From July 2007- June 2013,
the aggregate minimum volumes committed ranged from 525-575,000 stons, but actual volumes shipped during CY 2008-2012
were higher than the minimum commitments averaging 685,000 stons. Since then, the language in the 10-k reports changed and
the report simply states that Magellan has agreements in place with its three main ammonia customers. It is therefore difficult to
estimate how much ammonia has been pipelined through the Magellan in recent years; industry sources widely agree that the
pipeline is shipping less volumes than it did in 1996-2012, but estimations beyond that vary significantly with suggestions ranging
from 250-650,000 t/y. It is likely the minimum volumes committed each year have been renegotiated lower since the 575,000 t
agreed in 2012. Considering the increased maintenance work, and also the decrease in merchant ammonia from the three main
injecting sites (both of which are discussed below), it is Fertecon’s view that the Magellan has likely moved volumes in the 325-
525,000 t/y range post 2017.

1.4    Why is it closing?

The Magellan ammonia pipeline closure announcement did not come as a surprise to the domestic fertilizer industry; it was widely
understood that the pipeline had been suffering from profitability issues in recent years and issues surrounding the pipeline have
been deteriorating in recent years.

On October 17, 2016, an ammonia leak occurred on the pipeline near Tekamah, Nebraska which resulted in the death of a local
man and the evacuation of all residents within two miles of the breach. A lawsuit was filed against Magellan claiming the
company’s negligence led to the incident, though this is understood to have been dismissed as of 2 January 2019.

© 2019 IHS Markit | July 2019                                         4                                           www.fertecon.com
Magellan Ammonia Pipeline Closure: An Impact Assessment

                                              Since the fatal incident, however, Magellan has been under increased scrutiny by
                                              environmental agencies as well as occupational safety organisations. As a result, the company
                                              has undertaken increased maintenance projects and hydrostatic testing which have increased
                                              the amount of downtime for the pipeline. Hydrostatic testing was undertaken in 2017 but the
                                              impact this had on costs and ammonia volumes shipped was not reported.

                                              This is not the first time this has happened to the pipeline in its 50 years of existence. In
                                              June 2008, Magellan was given a Notice of Probable Violation from the Department of
                                              Transportation, Pipeline and Hazardous Materials Safety Administration for alleged
                                              violations associated with a May 2005 pipeline release that occurred in Kansas. This matter
                                              was settled in October 2009 and Magellan paid a penalty of $0.6 million.

                                              In the following year, 2010, hydrostatic testing rendered the pipeline unavailable for shipments
                                              for much of the year, and ammonia volumes shipped fell to just 462,000 stons. Revenues from
                                              the pipeline decreased by $5 million y-o-y due to decreased ammonia volumes. At the same
                                              time expenses increased by $2.9 million y-o-y due to the hydrostatic testing.

In 2011, Magellan evaluated the potential sale of the ammonia pipeline system but decided to retain it.

Since the Tekamah leak in 2016, two urea projects have come onstream which have reduced the amount of merchant ammonia
available at two of the main three injecting sites:

          •   The first to come onstream was Nutrien’s new urea facility at Borger, Texas (ex-Agrium). The new 608,000 t/y urea
              plant (of which 100,000 t/y is for DEF) was successfully commissioned in April 2017 and reached full operational
              capacity by the end of June 2017. The additional urea plant has decreased the merchant ammonia available at the
              Borger site by roughly 355,000 t/y (assuming operation at 100% capacity), bringing the total down to just 80,000 t,
              compared to a little over 430,000 t before the expansion.
          •   In November 2017 Koch’s new urea plant in Enid, Oklahoma was also up and running and tonnes were being marketed.
              The additional line added 816,000 t/y urea capacity to the site. The exact impact this had on merchant ammonia
              availability is hard to assess as debottlenecking activities of the two ammonia plants were reported to happen
              concurrently with the construction of the urea plant. In March 2014, Koch applied for a permit to increase the
              production at the two ammonia plants at Enid via debottlenecking by a total of 400 short tons per day, equivalent to
              12.5% of the existing capacity, or alternatively 115,000 t/y. This estimate is in line with feedback from market
              participants as well as other industry sources.

Given the assumption that debottlenecking of the ammonia plants added 115,000 t/y capacity to the plants brings the total ammonia
capacity at Enid to 1.031 million t/y. The new urea plant brought total urea capacity at the site to 1.286 million t/y, and assuming all plants
including AN and UAN are running at capacity, this resulted in a net loss of about 360,000 t/y of merchant ammonia. The site is now
estimated to have about 275,000 t/y merchant ammonia available, compared to 635,000 t/y before the expansions.

Therefore, both expansion projects taken together have reduced merchant ammonia available at two of the three main injecting
sites for the Magellan by about 715,000 t/y. This leaves just 785,000 t/y available to inject from the three main sites, including
430,000 t/y from CF’s Verdigris (according to CF’s latest 10-k), compared to 1.5 million t/y pre-2017. Considering also that there is
demand from truck and rail markets as well as potential export opportunities from CF’s Verdigris plant, the reduction in merchant
ammonia available at these sites meant there was significantly less demand for the Magellan pipeline.

                               Urea Project Impacts on Merchant Ammonia Availability at 3 Main Injection Points
                                         Merchant                                                        Merchant              Merchant
                                                            Net Ammonia             Net Urea
                                         Ammonia                                                         Ammonia               Ammonia
                                                               Change                Change
                                         Pre 2017                                                        Post 2017              Change
 Borger, Texas (Nutrien)                  435,0001                 -                 608,000              80,0001              (-) 355,000
                                                  1                    1                                          1
 Enid, Oklahoma (Koch)                    635,000              115,000               816,000              275,000              (-) 360,000
 Verdigris, Oklahoma (CF)                 430,0002                 -                    -                 430,0002                  -
 Total                                   1,500,000             115,000              1,424,000             785,000              (-) 715,000
 1                       2
     Fertecon Estimate       Company 10-k/Annual Report

© 2019 IHS Markit | July 2019                                                5                                            www.fertecon.com
Magellan Ammonia Pipeline Closure: An Impact Assessment Moving forward there was substantial maintenance work reportedly needed on large sections of the pipeline and considering declining revenues, Magellan could no longer justify operating the pipeline due to the increasing costs of maintaining it. There were some rumours that the pipeline could be repurposed; however, Magellan representatives dismissed this idea in its Q4 2018 conference call, stating that the forecasted forward maintenance capital expense on the pipeline is too much to make the economics work for any service. 1.5 What will the impact be? It is important to remember that the Magellan pipeline did not produce any ammonia, nor did Magellan take ownership of the ammonia it was transporting. Without the pipeline ammonia producers and distributors will have to rely on other means of transportation to service demand – mostly truck but also barge, rail, and pipeline – which will be costlier and less efficient. These increased costs and inefficiencies will impact the industry in various ways but essentially it will increase the cost-to-market ammonia in areas of the Midwest and change domestic trade flows. However, these impacts are not expected to be too disruptive or costly as the fertilizer industry appears to be in a decent position to manage without the pipeline. As mentioned above, the Magellan closure did not come as a surprise to the domestic fertilizer industry, especially not to Nutrien, CF, and Koch. It may have happened sooner than expected but it was still expected. All three producers have been preparing and continue to prepare for the closure. Koch and Agrium’s decision to increase urea production at Enid and Borger but not ammonia by the same degree could have been a preparatory move ahead of the closure. As we know, there was 1.5 million t/y merchant ammonia availability from the three main sites before 2017. The maximum annual capacity of the Magellan pipeline is only 816,000 t, according to the company’s latest 10-k. Therefore, pre-2017 these three sites were reliant on other means of transportation for roughly 684,000 t/y – not much less than the 785,000 t/y expected after the closure. Therefore, marketing these types of ammonia volumes without the pipeline is not uncharted territory for producers. Producers have also begun investing in more ammonia storage in areas of Nebraska and Kansas. For example, Koch is reported to have increased its storage capabilities at Conway, Kansas as well as signed a new storage agreement in Hastings, Nebraska. The Magellan pipeline is believed to have had roughly 35,000 ston holding capacity. Without the pipeline, existing storage space in the surrounding areas will become more valuable and there is likely to be some further investment in new storage capability to make up for the loss. Producers and distributors have also been making plans to increase volumes moved by other means of transportation - mostly by truck but also by rail and barge and potentially via the NuStar pipeline. CF announced back in August of 2018 that it plans to increase ammonia supply at its Garner, Iowa terminal by up to 150,000 ston / year with low-cost ammonia railed from its Medicine Hat plant. Bert Frost, SVP at CF, commented in the company’s Q4 2018 conference call, “Regarding the Magellan, we are disappointed, but not surprised by their decision to shut down the pipeline. They've had operational issues for the past several years which has challenged them to support... the tons we've wanted to move up in the upper Midwest. We ship about 4% to 5% of our ammonia on the Magellan and kind of projecting what we thought would happen. We've been working with our system, with our team to create options and different avenues to move our tons up into that market. One is barge loading out of Verdigris which we're able to do now, as well as increasing our storage capabilities in certain terminals and working with our truck providers.” Only Verdigris has the option to load ammonia onto barges. CF owns its own ammonia tows. This gives CF, who post-2017 has the most merchant ammonia availability of the three main plants, the option to ship tons into the Cornbelt by barge but also to the US Gulf for export. In the same conference call Anthony Will, CEO at CF, stated “…because of the [natural gas] basis differential favourability in Oklahoma we can actually move Verdigris ammonia down into New Orleans for about the same price or even some days cheaper than what we can produce it in Donaldsonville. And because Donaldsonville is already on the NuStar, what we tend [to do] when we do an ammonia export is lot of times end up making that the Verdigris tons that go out.” Therefore, it seems the Magellan closure will likely result in a shift in CF’s ammonia distribution. More tonnes from Verdigris are likely to be barged to the Gulf for export, especially when the Midwest is out of season. These tonnes could be replaced by increased shipments from CF’s Medicine Hat plant in Alberta as well as increased injections from Donaldsonville into the NuStar pipeline, which can more efficiently reach some areas of the Cornbelt than trucks or rail out of Verdigris can. However, there may also be an opportunity for increased imports into the US Gulf for the NuStar pipeline if CF decides to focus more on exports rather than domestic direct application demand. © 2019 IHS Markit | July 2019 6 www.fertecon.com
Magellan Ammonia Pipeline Closure: An Impact Assessment

On 22 October 2018, CF and the J. R. Simplot Company announced an agreement that allows CF to ship, store and distribute
anhydrous ammonia from Simplot’s Rivergate Terminal in Portland, Oregon, starting in 2019. The arrangement will enable CF to
meet growing demand for anhydrous ammonia in Pacific Rim countries, a region that imported over 4.1 million metric tonnes of
the product in 2017. CF intends to supply the ammonia from its Medicine Hat, Alberta nitrogen complex. Additionally, CF
anticipates selling to local customers from the terminal.

Therefore, if netbacks from potential exports sales via either the US Gulf with Verdigris tonnes, and/or through Rivergate with
product from Medicine Hat, are more attractive than trucking or railing into the Cornbelt from those sites, then CF could have less
ammonia available for customers in the Cornbelt. In this case, increased imports through the NuStar pipeline may be one way to
meet the shortfall.

NUSTAR AMMONIA PIPELINE

                                                                          The NuStar ammonia pipeline system is a 2,000-mile
                                                                          pipeline which originates at Taft and Donaldsonville in
                                                                          Louisiana and travels north through the Midwestern regions
                                                                          of the United States, forking east and west to terminate in
                                                                          Nebraska and Indiana.

                                                                          It connects to three third-party marine terminals and three
                                                                          anhydrous ammonia plants on the Mississippi River (CF
                                                                          Industries’ Donaldsonville site, Mosaic’s Faustina facility,
                                                                          and the PCS site at Geismar). The pipeline is connected to
                                                                          multiple third-party-owned terminals, which include
                                                                          industrial facility delivery locations.

                                                                          Unlike the Magellan, the NuStar pipeline can also receive
                                                                          imported product directly into the system.

                                                                          NuStar reported throughput for the ammonia pipeline at
                                                                          1.16 million t in 2016, 1.27 million t in 2017, and 1.21
                                                                          million t in 2018.

                                                                          Ref: http://nustarenergy.com/

Capacity for the NuStar pipeline was not stated in the company’s 10-k filing but industry sources reported it at 2 million stons,
which is equivalent to 1.814 million t. Therefore, some of the potential shortfall in the Cornbelt as a result of the Magellan closure
could be made up from increased shipments through the NuStar pipeline, either by increased injections from the plants connected
to it or by increased injections from imports. CF, as mentioned above, will be well placed to ship more from Donaldsonville through
the NuStar. Via the NuStar, CF has the ability to transport ammonia to ten terminals and shipping points in the Midwest and
Cornbelt. However, as mentioned CF will have to weigh the netbacks from these shipments against other opportunities on the
export market.

The storage terminals along the Magellan pipeline, most of which are owned by other parties, will continue to be utilized by either
railing or trucking in the ammonia. Therefore, one of the impacts will be the increased expense of delivering the ammonia to these
terminals by truck or rail compared to by pipeline. A quick cost impact assessment exercise is shown on page 8.

© 2019 IHS Markit | July 2019                                         7                                            www.fertecon.com
Magellan Ammonia Pipeline Closure: An Impact Assessment
COST IMPACT ASSESSMENT
Miles Base Case Truck Rate - $5.00/mile
FROM FROM
TO
Enid, OK Borger, TX Verdigris, OK Enid, OK Borger, TX Verdigris, OK
(Koch) (Nutrien) (CF) (Koch) (Nutrien) (CF)
Farnsworth, TX 184 58 318 43.81 13.81 75.71
Borger, TX (Nutrien) 234 - 358 55.71 - 85.24
Conway, KS (Koch, A term) 175 326 257 41.67 77.62 61.19
Beatrice, NE (Nutrien, Koch) 328 490 348 78.10 116.67 82.86
Early, IA 524 706 496 124.49 168.10 118.10
Garner, IA, (Nutrien, CF,
618 817 553 147.14 194.52 131.67
Koch)
Blair, NE 445 608 444 105.95 144.76 105.71
Port Neal, IA, (CF) 507 681 502 120.71 162.14 119.52
Sargeant Bluff, (IA) 510 684 505 121.43 162.86 120.24
Mankato, MN, (Koch, A term) 709 859 663 168.81 204.52 157.86
Clay Center, KS, A Terminal 250 412 294 59.52 98.10 70.00
Greenwood, NE, A Terminal 414 557 387 98.57 132.62 92.14
Whiting, IA, A Terminal 497 665 486 118.33 158.33 115.71
Mocane, OK A Terminal 163 124 294 38.81 29.52 70.71
Pipeline Base Tariff Rate Cost Differential Base Case
FROM FROM
TO
Enid, OK Borger, TX Verdigris, OK Enid, OK Borger, TX Verdigris, OK
(Koch) (Nutrien) (CF) (Koch) (Nutrien) (CF)
Farnsworth, TX 47.84 45.53 48.88 (4.03) (31.72) 26.83
Borger, TX (Nutrien) 48.30 - 49.36 7.41 - 35.88
Conway, KS (Koch, A term) 46.29 47.54 47.33 (4.62) 30.08 13.86
Beatrice, NE (Nutrien, Koch) 47.67 48.88 48.72 30.43 67.79 34.14
Early, IA 49.20 50.45 50.27 75.56 117.65 67.83
Garner, IA, (Nutrien, CF,
50 51.25 51.10 97.14 143.27 80.57
Koch)
Blair, NE 48.47 49.68 49.51 57.48 95.08 56.20
Port Neal, IA, (CF) 48.87 50.13 49.93 71.84 112.01 69.59
Sargeant Bluff, (IA) 48.84 20.12 49.92 72.59 112.74 70.32
Mankato, MN, (Koch, A term) 50.71 51.96 51.74 118.10 152.56 106.12
Clay Center, KS, A Terminal 47.02 48.29 48.08 12.50 49.81 21.92
Greenwood, NE, A Terminal 47.98 49.20 49 50.59 83.42 43.14
Whiting, IA, A Terminal 48.72 49.93 49.76 69.61 108.40 69.95
Mocane, OK A Terminal 47.38 93
45.98 48.45 (8.57) (16.46) 22.26
© 2019 IHS Markit | July 2019 8 www.fertecon.comMagellan Ammonia Pipeline Closure: An Impact Assessment For this analysis, the standard pipeline tariff rates were used although Koch, CF, and possibly Nutrien are likely paying the 3-year incentive rates (See Appendix) for some of these routes. Industry sources report ammonia trucking rates have been increasing in recent years and currently run between $4.50-5.50 per mile, depending on the time of year and route. A $5.00 per mile trucking rate was assumed as the base case. The low and high case scenarios are presented in the Appendix below, although the outcomes did not impact the main takeaways of the analysis. Ammonia trucks generally carry between 20-21 stons and for this exercise we assumed a 21-ton truck to calculate the $/ston truck rate for each route. Rail alternatives were left out of this analysis as rail carriers would be likely to charge extremely high rates to take on any further ammonia volumes, so the gap left by the pipeline closure is expected to mostly be filled by truck shipments. For a small number of routes rail transport may be used, but since rail rates are non-transparent, and often vary greatly between the carrier and route, there is no simple way to include it in this analysis. The main inference from the table above is that truck rates are just as competitive, or in some cases more, as the pipeline is for shipments to as far north on the pipeline as Conway, Kansas. Therefore, storage facilities in the southern half of Kansas as well southeast Colorado, southwest Missouri, and the entirety of Oklahoma should not feel much impact from the Magellan closure. As we move north on the pipeline past Conway we do not quite make it to the Nebraska/Kansas border before supply points from the NuStar pipeline, or plants in Iowa or Nebraska, start to look more competitive on a freight rate basis. However, supply points further north command a higher fob value for ammonia. For example, the spread between Oklahoma ex plant prices and fob truck prices in Sioux City, Iowa and Omaha, Nebraska is typically between $50-70/ston and has averaged about $52 post-2017 compared to about $70 in 2015-2017. Therefore, freight rates from northern supply points will need to be about $50-70/ston less than the freight rates from the Oklahoma plants to match the delivered price. This will start to happen in Beatrice, Nebraska and will become more prevalent further north into Nebraska and Iowa as the Magellan pipeline runs near the NuStar. This will give producers and distributors in these areas as well as their customers the option to source tons from plants in Iowa or Nebraska or from the NuStar pipeline instead of the 3 plants that inject into the pipeline. They will do so at an increased cost relative to when the Magellan was operating but the cost will not be as high as the trucking rate estimates from the 3 main injecting plants as shown in the table above. However, it should be noted that these price spreads are likely to change following the Magellan closure, but nonetheless the overall takeaway is still useful. Producers who look to maintain shipping tons from the 3 main injecting sites to storage facilities up north, via truck or rail, will face increased transportation costs. How much exactly will depend on each producers’ truck and rail capabilities and agreements. Following the Magellan closure, we would expect the spread between ex plant prices in Oklahoma and fob values in the Western Cornbelt/Northern Plains to widen as sellers in the south look to absorb some of the freight cost increases and sellers in the north see greater demand. This effect however will be mitigated by the fact that Koch and CF also have production facilities in the north, which they could utilize. Some of the cost increase will also have to be met by increased prices paid by retailer /dealer, which will eventually be passed on to the end-user/grower. It should be noted that some of the pipeline terminals on the Magellan are “hot”, meaning that there is no storage onsite, so ammonia trucks load directly from the pipeline. Or if there is storage on-site, it is very little, only around 140 stons, and can only be fed via the pipeline. Customers serviced by these “hot” terminals will no longer have their local source of ammonia supply. These are the markets where the impact of the Magellan closure will be felt the strongest. One of these “hot” terminals is Clay Center, Kansas, owned by Magellan, which also happens to be in the middle of the impact zone where trucking from supply points in the south will be more economical than trucking from supply points from the north (in this case due to the fob spreads) but will not be as cost-efficient as the pipeline. Some of these terminals may still find some value if distributors decide to but them from Magellan and invest in adding storage capabilities and/or retrofitting so they can be fed by truck. Without a local source of supply, these customers will have to source from the next best alternative. This will mean greater demand for the surrounding areas’ terminals. So, in addition to paying higher freight, fob values from northern supply points are also likely to increase. Longer delivery time will make it harder for distributors to have tons in place at the right time. It will also stretch the truck market as each delivery utilizes a truck for a longer period time. Ammonia storage already built in these areas will increase in value following the Magellan closure. There will likely be some investment by producers/distributors/retailers to offset this. Generally, it seems certain customers that were freight advantageous of the Magellan pipeline will be seeing anywhere from $0- 40/ston price increase, holding everything else constant, to replace tons that were historically pulled from the pipeline with tons that are trucked from either the 3 former injecting sites, plants in the Cornbelt, or NuStar pipeline terminals. © 2019 IHS Markit | July 2019 9 www.fertecon.com
Magellan Ammonia Pipeline Closure: An Impact Assessment

1.6     Conclusion

The Magellan ammonia pipeline provided the industry a relatively safe, efficient, and affordable means of transporting a valuable
but hazardous product, during times when rail carriers have tried to stray away from shipping ammonia and the trucking industry
has seen a shortage in capacity. Profitability and maintenance issues were widely known, and the closure announcement did not
come as a surprise. Producers and distributors have been preparing for this eventuality. The Magellan closure will lead to increased
ammonia transportation costs for much of the Plains region as well as increase the value of existing ammonia storage. Already
seasonally-tight truck markets will be further stretched and there will likely be increased investment in ammonia storage in Kansas
and Nebraska and to a lesser extent potentially Iowa and Missouri. Mini standalone ammonia plants will also make more sense. The
changes in transportation costs and logistical capabilities are likely to lead to increased barge shipments from Verdigris, either to
the Gulf for export or up into the Cornbelt for sale. Some of the ammonia demand in the northern areas of the Magellan pipeline
that can no longer be efficiently served from Enid/Verdigris/Borger will be met with increased rail shipments from Canada and/or
increased shipments on the NuStar pipeline. Increased transportation costs for ammonia from Enid/Verdigris/Borger will
incentivize producers with existing upgrade capacity to upgrade more ammonia into urea, UAN, and other nitrogen products. It will
also increase the fob spreads between plants in Oklahoma and terminals in the Cornbelt. Generally, it seems certain customers that
were freight advantageous of the Magellan pipeline will be seeing anywhere from $0-40/ston price increase, holding everything
else constant, to replace tons that were historically pulled from the pipeline. However, this cost increase will ultimately be met by
higher farmgate ammonia prices. Considering supply lines will be less efficient, it will also make it more difficult for distributors to
have product in place when needed, which has always been a difficult task for ammonia distributors. Over time, the increase in the
cost of farmgate ammonia for the Plains farmers relative to other nitrogen products, as well as the difficulties in having product in
place at the right time, may support the general farmer movement away from direct application ammonia towards the usage of
other nitrogen fertilizer products.

1.7     Appendix

1.7.1

                                             Magellan Local Rates – STB No. 26 - $ per ston
                                                                                 FROM
              TO                   Enid, OK        Beatrice,    Borger, TX Verdigris, OK        Blair,       Mocane,      Port Neal, IA
                                    (Koch)           NE         (Nutrien)      (CF)              NE            OK             (CF)
 Farnsworth, TX                      47.84          47.84         45.53          48.88          49.20          45.53         49.63
 Borger, TX (Nutrien)                48.30          48.30            -           49.36          49.68          45.98         50.13
 Conway, KS (Koch)                   46.29          46.29         47.54          47.33          47.21          46.33         47.61
 Beatrice, NE (Nutrien)              47.67          47.67         48.88          48.72          45.98          47.54         46.45
 Early, IA                           49.20          49.20         50.45          50.27          46.04          49.52         45.79
 Garner, IA, (Nutrien)                50              50          51.25          51.10          46.84          50.32         46.59
 Blair, NE                           48.47          48.47         49.68          49.51            -            48.76         45.65
 Port Neal, IA, (CF)                 48.87          48.87         50.13          49.93          45.65          49.17            -
 Sargeant Bluff, (IA)                48.84          48.84         20.12          49.92          45.64          49.17         45.09
 Garner, IA, (Koch)                   50              50          51.25          51.10          46.84          50.32         46.59
 Mankato, MN, (Koch)                 50.71          50.71         51.96          51.74          47.47          50.95         47.29
 Garner, IA, (CF)                     50              50          51.25          51.10          16.75          50.32         46.59
 Clay Center, KS, A Terminal         47.02          47.02         48.29          48.08          46.50          47.33         46.87
 Greenwood, NE, A Terminal           47.98          47.98         49.20            49           45.55          48.26         45.94
 Whiting, IA, A Terminal             48.72          48.72         49.93          49.76          45.52          48.98         45.30
 Mankato, MN, A Terminal             50.71          50.71         51.96          51.74          47.44          50.95         47.29
 Conway, KS, A Terminal              46.29          46.29         48.54          47.33          46.78          46.59         47.61
 Mocane, OK A Terminal               47.38          47.38         45.98          48.45          48.48            -           49.17
The rate became effective July 1, 2018 and are subject to change.

© 2019 IHS Markit | July 2019                                            10                                          www.fertecon.com
Magellan Ammonia Pipeline Closure: An Impact Assessment
1.7.2
Three Year Incentive Rates– STB No. 26 - $ per ston – any origin to any destination
Annual Commitment Tonnage Incentive Rates
75,000 48.89
100,000 48.42
125,000 47.45
150,000 46.52
175,000 45.58
200,000 44.48
225,000 43.12
250,000 41.35
>324,999* 36.36*
* Upper tier volume incentive rate
1.7.3
Low Case Rate - $4.50/mile High Case Rate - $5.50/mile
FROM FROM
TO
Enid, OK Borger, TX Verdigris, OK Enid, OK Borger, TX Verdigris, OK
(Koch) (Nutrien) (CF) (Koch) (Nutrien) (CF)
Farnsworth, TX 39.43 12.43 68.14 48.19 15.19 83.29
Borger, TX (Nutrien) 50.14 - 76.71 61.29 93.76
Conway, KS (Koch, A term) 37.50 69.86 55.07 45.83 85.38 67.31
Beatrice, NE (Nutrien, Koch) 70.29 105.00 74.57 85.90 128.33 91.14
Early, IA 112.29 151.29 106.29 137.24 184.90 129.90
Garner, IA, (Nutrien, CF,
132.43 175.07 118.50 161.86 213.98 144.83
Koch)
Blair, NE 95.36 130.29 95.14 116.55 159.24 116.29
Port Neal, IA, (CF) 108.64 145.93 107.57 132.79 178.36 131.48
Sargeant Bluff, (IA) 109.29 146.57 108.21 133.57 179.14 132.26
Mankato, MN, (Koch, A term) 151.93 184.07 142.07 185.69 224.98 173.64
Clay Center, KS, A Terminal 53.57 88.29 63.00 65.48 107.90 77
Greenwood, NE, A Terminal 88.71 119.36 82.93 108.43 145.88 101.36
Whiting, IA, A Terminal 106.50 142.50 104.14 130.17 174.17 127.29
Mocane, OK A Terminal 34.93 26.57 63.64 42.69 32.45 77.79
© 2019 IHS Markit | July 2019 11 www.fertecon.comMagellan Ammonia Pipeline Closure: An Impact Assessment
Cost Differential Low Case Cost Differential High Case
FROM FROM
TO
Borger, TX Verdigris, OK Enid, OK Borger, TX Verdigris, OK
Enid, OK (Koch)
(Nutrien) (CF) (Koch) (Nutrien) (CF)
Farnsworth, TX (8.41) (33.10) 19.26 .35 (30.34) 34.41
Borger, TX (Nutrien) 1.84 - 27.35 12.99 - 44.40
Conway, KS (Koch, A term) (8.79) 22.32 7.74 (.46) 37.84 19.98
Beatrice, NE (Nutrien, Koch) 22.62 56.12 25.85 38.23 79.45 42.42
Early, IA 63.09 100.84 56.02 88.04 134.45 79.63
Garner, IA, (Nutrien, CF,
82.43 123.82 67.40 111.86 162.73 93.73
Koch)
Blair, NE 46.89 80.61 45.63 68.08 109.56 66.78
Port Neal, IA, (CF) 59.77 95.80 57.64 83.92 128.23 81.55
Sargeant Bluff, (IA) 60.45 96.45 58.29 84.73 129.02 82.34
Mankato, MN, (Koch, A
101.22 132.11 90.33 134.98 173.02 121.90
term)
Clay Center, KS, A Terminal 6.55 40.00 14.92 18.46 59.61 28.92
Greenwood, NE, A Terminal 40.73 70.16 33.93 60.45 96.68 52.36
Whiting, IA, A Terminal 57.75 92.57 54.38 81.45 124.24 77.53
Mocane, OK A Terminal (12.45) (19.41) 15.19 (4.69) (13.50) 29.34
Prepared by Karl Stenerson
Email: marketing@agri.informa.com
Call: +1 212 204 4332 | +44 (0)20 7017 4017 | +852 2234 2919
Published by: FERTECON, Agribusiness Intelligence, IHS Markit, The Blue Fin Building, 110 Southwark Street, London SE1 0TA, UK.
© 2019 IHS Markit
© 2019 IHS Markit | July 2019 12 www.fertecon.comYou can also read


