Melbourne's Water Outlook 2020 - 29 November 2019 - Melbourne Water
←
→
Page content transcription
If your browser does not render page correctly, please read the page content below
Melbourne’s
Water
Outlook 2020
29 November 2019

        With warmer, drier climatic conditions and a growing
        population, it’s important that we all play our part in
                        securing Melbourne’s water storages.
Melbourne’s water supply availability for the coming year                                                                                                  Melbourne’s Water Outlook 2020

                                                                                                                 63.9%
   Our water system storages are secure, though real and growing
   challenges to supply availability and demand require us all to act.                                                                                        Current system storage
                                                                                                                                                              level at 27 November 2019
                                                                                                                                                              (storage level is inclusive of water provided
Our water security is dependent on how much water we have in storage. At the end of November each                                                             from the desalination order to date)
year, Melbourne’s metropolitan water corporations review our system storage position based on water
outlook zones and corresponding actions (Figure 1).
Melbourne’s water supplies are currently secure for the coming year, however it’s important we all
                                                                                                                   This year’s desalination order:           125 billion litres
continue working together to protect them for the future. Challenges such as our increasing population
and a warming, drying climate have contributed to Melbourne’s storages decreasing by an annual
average of 61 billion litres over the last five years.                                                          Zone                Actions per zone
Modelling indicates that in some scenarios, storages may continue to decline over the next few years.
Under severe dry conditions, storage levels could approach the low zone. More action is required to                                 Water efficiency programs
decrease demand and increase supplies to build storage volumes.                                                                     (eg Target 155, Permanent Water Use Rules)
Melbourne’s average per-person water consumption has increased slightly to about 162 litres per                 High                Use of the Victorian Desalination Project as required
day. With community input, we have developed the Make Every Drop Count campaign, in support of                  (secure)
                                                                                                                                    Continued investment in alternative water sources
Victorian Government’s Target 155 (T155) voluntary water efficiency program. Alongside Permanent                zone                (eg recycled water)
Water Use Rules, the campaign aims to increase community understanding of our water availability
                                                                                                                                    Ongoing planning for water availability
challenge and actions we are taking to secure supplies and to promote efficient residential water use.
                                                                                                                                    Ongoing engagement with customers
The Victorian Desalination Project makes an important contribution to our supply system. Since 2017 the
Victorian Desalination Project has contributed around 150GL of water and total storage volume would
be around 8% lower without this volume. With rainfall and streamflow trends suggesting less water                                   Increased use of the Victorian Desalination Project
                                                                                                                Medium              Start planning for augmentation
will be available from surface water sources in the future, we will increasingly use desalinated water to
maintain water supply resilience. For the 2019/20 year, Melbourne is being supplied with 125 billion litres     (take action)
                                                                                                                                    Increased use of customer behaviour and efficiency
of desalinated water, the largest annual volume to date.                                                        zone                programs
                                                     System storage level without                                                   Further water saving measures including possible
                                                     desalinated water received to date 55.5%                                       Stage 1 and 2 restrictions
                            40%
                                                           60%
                                      Medium
                                                                   Current system                                                   Expanded use of customer behaviour and efficiency
                                                                   storage level 63.9%                          Low                 programs
                                    (take action)
                                                                                                                (emergency)         Implementation of augmentations
                                        zone
                                                                                                                zone                Stage 3 and 4 restrictions
                     Low                                       High                                                                 Investment in emergency supply options
                  (emergency)                                (secure)                                                               Maximise use of the Victorian Desalination Project
                     zone                                      zone
                                                                                                              Figure 1: Our water outlook zones and corresponding actions
    0%                                                                          100%
                                                                                                                                                                                                              2
Melbourne’s water supply system Melbourne’s Water Outlook 2020
Melbourne’s retail water corporations, City West Water, Yarra Valley Water and
South East Water deliver water to the community. Melbourne Water provides 13
wholesale water services to the retail water corporations (see Figure 2). As
at 31 October 2019 about half of the water stored in the Melbourne water
supply system is available for Melbourne, with the remaining allocated to other
entitlement holders. 2
Western Water
Melbourne Water also supplies water to Southern Rural Water and regional water 1 3
corporations including Barwon Water, Gippsland Water, South Gippsland Water, 4 5
6
7
Western Water and Westernport Water (Figure 3). Each regional water corporation Yarra Valley
has their own Water Outlook but are considered along with other Melbourne City West Water 8
Water customers when planning for Melbourne’s water security. Water is also Water
10
allocated to the environment to ensure the health of waterways.
9
11
How water gets to you... Port Phillip Bay South East
Gippsland
Barwon Water
Water Water
Melbourne Water Western Port
Wholesaler manages the source and supply of water
and manages delivery to retailers
Bass Strait
Westernport South Gippsland
Water Water
12
Water supply storage reservoirs: Other sources of water:
Retailers
City West Yarra Valley South East Melbourne 1 Greenvale 7 Upper Yarra 12 Victorian Desalination Project Rivers
Provide water
to your tap
Water Water Water Water 2 Toorourrong 8 Thomson 13 Sugarloaf (North-South) Pipeline
subject to rules as set out in the
Water corporation boundaries
Supply 3
4
Yan Yean
Sugarloaf
9
10
Tarago
Silvan
Statement of Obligations (System
Management)
Water supply pipelines and aqueducts
Water pipeline owned by AquaSure
System 5 Maroondah 11 Cardinia Water supply catchment area
Metropolitan 6 O’Shannassy Mid Yarra catchment
Figure 4
Figure 3: Melbourne water supply system
Community
Figure 2: How
Figure 3 water is supplied
3
Long-term outlook                                                                                                                                                 Melbourne’s Water Outlook 2020

   Population growth, the potential impacts of climate change and
   other factors influence the long-term supply and demand for water.

In June 2017, each retail water corporation released its Urban Water Strategy,
coupled with Melbourne Water’s release of the Melbourne Water System
Strategy. We work collaboratively to inform the development of these strategies
and review them every five years, to ensure ongoing water availability.
These strategies align with the Victorian Government’s Water for Victoria                                                                                                          With lower demands and
                                                                                                                                                With medium demands and            lower climate change impacts,
plan. A joint summary of our actions is outlined in Water for a Future-Thriving                                                                 medium climate change              we have enough water until
Melbourne. We work with government, business and community partners to                                    With higher demands and               impacts, we have enough            beyond 2065.
                                                                                                          high climate change impacts,          water until around 2043.
implement these actions, finding innovative and sustainable ways to secure                                we have enough water until
                                                                                  Average                                                                                                      e
our water supplies. We are implementing water efficiency measures, investing                              around 2028.                                                                  d ra
                                                                                                                                                                                             ng
                                                                                  annual                                                                                              an
in recycled water initiatives and harvesting more stormwater for irrigation and                                                                                                   Dem
                                                                                  volume
other fit-for-purpose uses. We are also working with Government to review         (gigalitres)                                     Highest approx. supply level
options to provide for additional supplies for the Melbourne system when it is                                                                                             Medium demand
required.
Alongside these strategies, we also have Drought Preparedness Plans which set
                                                                                                                                                                                     Medium supply
out actions to prepare for, and respond to, periods of water shortage.
Impacts on our long-term outlook, which are driving demands above forecast
are:
                                                                                                                                                                                   Lowest approx. supply level
  •    rapid population growth, increasing water usage
  •    steady rather than declining average per-person water consumption
		     over recent years
                                                                                                   2015                   2025                   2035                2045                  2055                    2065
  •    a warming and drying climate over recent decades, in Victoria.
A warming and drying climate also impacts our long-term outlook for water
supply. In comparison to historical conditions we’re already experiencing:
                                                                                  Figure 4: Long-term water supply and demand (Source: Water for a future-thriving Melbourne, 2017)
  •    higher temperatures
  •    reductions in rainfall in autumn and winter
  •    in many catchments, less streamflow is being generated from the same
		     amount of rainfall.
Figure 4 shows projected long-term water supply and demand trends for
Melbourne, assuming full use of the Victorian Desalination Project (noting that
there will be variability in specific years).

                                                                                                                                                                                                                   4
Melburnians’ water use Melbourne’s Water Outlook 2020
Residential customers are Melbourne’s biggest water
GL users, using 500
60
around two and a half times more water than industry. 450
56
53
GL 500 47 48 45 51 47
Environmental 400 48 42
60 138 45 42 42 42
450 Flow Releases 53 350 126
131
42 108
56 117 41 36 40 108
Melbourne’s water usage in 2018-19 increased by 1.3% compared to the previous year (Figure 47 300 48 45
118 118
108
36
100
106
51
10647
Environmental 400 100 4899 42
5). Residential water use comprised 65% of Melbourne’s total water use in 2018-19 (Figure 6).
Volumne (billion litres)
45 100 92
138 97 93
42 8942 42
Flow Releases 131 250
350 126 42
Litres per person per day
The residential per-person consumption for 2018-19 was 162 litres per person per day (Figure 117 41 36 40 108 108
118 200118 36 106 106
100
300 delivering
7). This is slightly higher than the previous year and requires further focus through 108 100 99
Volumne (billion litres)
150 303
280 295 100 97 27393 92 277 287
on actions from our Urban Water Strategies and working with the community to make every
250
267 265 249 89228
223 220 218 229
252 253 257 272 268
100
drop count and reach Target 155.
200 50
Since 2011-12 (Figure 8), the Victorian Environmental Water Holder has released water 0
available from environmental entitlements to the Thomson, Yarra and Tarago150
303 295
Rivers to 280 267 265 273
249 252 253 257 272 268 277 287
228 223 220 218 229
improve environmental outcomes and the health of water ecosystems. 100 17
26 Residen>al Non-Residen>al System Losses (i.e. fire figh>ng, leakage)
50
250 29
250
45 Figure 5: Melbourne’s total water use by segment
1 47 247
51 47 234 247 0
48 42 226
234 23 System Losses (i.e.
200 50
208 205226208
Litres per person per day
108
08
200 34 fire figh>ng,
Litres per person per day
108
108 188208 205 208 leakage) 45
106 106
188
17 44
150 166 161 160 160 166 161 161 162 Residen>al Non-Residen>al11% System Losses (i.e. fire figh>ng, leakage) 40
159 152 26 161 30
Volume (billion litres)
149
150 147 166
159 160 160 166 161 161 162 35
29
152 147 149
30
287 100
77
287 100 45 25
272 268 277
23 System Losses (i.e.
Did you know?5045
50 20
34 fire figh>ng, Non-Residen>al 15
50 17
leakage) 24%
0 44 10
11% 40
31%
30 Residen>al 5
Volume (billion litres)
0
65% 35 0
age)
Figure 7: Melbourne’s per capita residential consumption 30
50 25
45
50 18/19 442 20
40 45 44
17/18 436 Non-Residen>al 15
Volume (billion litres)
45
35 45 16/17
18/19
416
442 17
24%
of residential
40 44
30 34 17/18 436 10
Volume (billion litres)
35 30
25 29 16/17 416
26 Residen>al 5
water use is
30 34
20 23 30
15
17
25
26
29 65% 0
20
in the shower
10 23
5 15
17
0 10
5
0
Figure 8: Environmental flow releases Figure 6: Water use breakdown 2018-19 5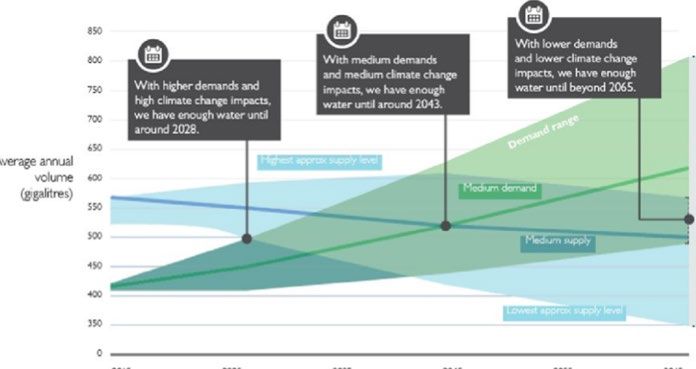
A drier, warmer season ahead                                                                                                                       Melbourne’s Water Outlook 2020

   Bureau of Meteorology outlooks show below average rainfall,
   warmer temperatures and low storage inflows are more likely for
   the Melbourne region over the coming months.

Temperature and rainfall influence water use, particularly during summer periods when
it’s used for watering gardens, parks, and sportsgrounds. At the same time, rainfall and
temperature also influence inflows to Melbourne’s storage reservoirs.
The latest Bureau of Meteorology climate outlook issued on 21 November 2019 indicated
that below average rainfall and warmer-than-average day time temperatures are likely for
the Melbourne region for the season ahead (December 2019 to February 2020).
The latest seasonal streamflow forecast issued in mid-November 2019 for Melbourne’s
four major storage reservoirs indicated low inflows are likely for the three-month period
(November 2019 to January 2020).
We continually monitor storage conditions and the Bureau of Meteorology’s seasonal
climate outlooks.                                                                           Figure 9: Seasonal rainfall outlook for December 2019 – February 2020

                                                                                            Figure 10: Seasonal temperature outlook for December 2019 – February 2020
                                                                                                                                                                               6
What this means for Melbourne                                                                                                                             Melbourne’s Water Outlook 2020

   Permanent Water Use Rules, increased efforts to achieve T155 and
   water from the Victorian Desalination Project are all necessary to
   keep our water supply secure.

As of 27 November 2019, the total system storage level is 63.9%, 0.9% higher than the
same time last year. As a result of the Victorian Government’s desalinated water orders,
since 2017 storage levels are 8.4% higher than they otherwise would have been.
While storage levels are likely to remain in the high (secure) zone (above 60%) at 29
November 2020, modelling suggests that in some scenarios they could be in the medium
(take action) zone if dry conditions occur during 2020 (Figure 11). The modelling has taken
into account the potential water requirements of regional urban water corporations to be
met through the water grid and environmental needs. We have several actions (as detailed
in Figure 1) in the medium (take action) zone and based on this, water restrictions are
unlikely for Melbourne over the next 12 months. However Permanent Water Use Rules
will continue to apply to ensure sensible water use. Permanent Water Use Rules are a set
of common-sense rules to make sure we use water more efficiently and encourage all
Victorians to value this precious resource for the long term.
Use of the Victorian Desalination Project, supported by increasing community awareness
of efficient water use practices and targeting water consumption of 155 litres per person
per day, reduces the risk of entering the medium (take action) zone and contributes to                                           Desalination water (%)
maintaining a safe and secure drinking water supply for Melbourne.

                                                                                              Figure 11: Melbourne total system storage outlook (projected from 27 November 2019)

                                                                                                                                                                                      7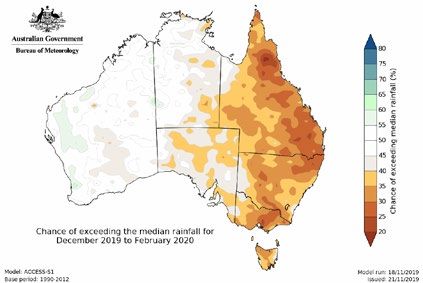
What this means for Melbourne                                                                                                                                    Melbourne’s Water Outlook 2020

  We’ve identified a number of actions in our Urban Water Strategies and the Melbourne Water System Strategy, as well as the actions we’ve
  taken collaboratively in Water for a Future-Thriving Melbourne.

Here’s a summary of key actions we’re working on both together and individually to enhance water availability:

                             The metropolitan Melbourne water corporations have developed a water security community awareness campaign in a renewed focus on working together with the
   Make Every Drop Count     community to manage our precious water resources for future generations. The campaign has been developed to help Melburnians conserve water and specifically
   campaign                  to support the Victorian Government’s overarching Target 155 (T155) objective. This is in line with our commitment to supporting efficient use of water across the
                             community as stated in Water for a Future-Thriving Melbourne, where we forecast demands of 150 litres per person per day for residential drinking water use across
                             Melbourne by 2022. We will continue to aim for this water use target while being aware of the environment we’re operating in which includes low inflows to dams, a
                             growing population and hotter, drier weather.

                             This part-government funded program supports vulnerable customers to undertake plumbing improvements at home so they can avoid unnecessary and inefficient
   Community Rebates
   Program                   water usage. This includes engaging a plumber to do a water audit, and subsequently carry out minor plumbing works (e.g. replacement washers, dual-flush toilets, fixing
                             leaking taps, replacement showerheads).
   Integrated Water          Continuing Catchment scale IWM strategies for each of the IWM Forums that support Forum members (eg metropolitan water corporations, Councils, and Traditional
   Management (IWM)          Owners) to achieve IWM strategic objectives including the development of place based IWM plans. Outcomes include the use of stormwater and recycled water.

   Desalinated water order   With desalinated water playing an important role in maintaining security of Melbourne’s water supply system, desalinated water order volumes are reviewed annually and
   advice                    advice is provided to the Minister for Water to decide on the volumes required to provide ongoing water security. Since 2017, desalinated water has increased our water
                             supplies by 8.4%.
   Digital Metering Joint    We’re working collaboratively on a program to explore digital metering and understand the benefits that could be delivered through water efficiency, leak detection and
   Program                   informing behaviour change. Pilots have already resulted in identification and rectification of customer leaks in more than 5% of properties with digital meters installed.

   Network efficiency        Undertaking active leak detection, reticulation mains renewals, district metering and trialing intelligent network technologies to minimise non-revenue water.

                             Schools Water Efficiency Program (SWEP): over 1000 schools have now participated in the program which helps them identify leaks, faulty appliances and inefficient
                             practices. Approximately 3.5 gigalitres has been saved since inception of the program in 2012.

                             Greenhouse gas emissions reduction: The retailers and Melbourne Water are working to reduce greenhouse gas emissions associated with delivery of our services. The
                             retailers are three of 13 water corporations that have formed Zero Emissions Water, using collective purchasing power to negotiate a 78GWh renewable energy Power
                             Purchase Agreement that will reduce water sector emissions and energy costs. Melbourne Water has pledged to halve net greenhouse gas emissions by 2025 and achieve
   Key achievements          net zero emissions by 2030. Using big data and a sophisticated algorithm, Melbourne Water has better synchronised water pumps at the Winneke water treatment plant,
                             reducing greenhouse electricity gas emissions and reducing energy costs by 20%. This process will be rolled out to other pump stations in the future.

                             Choose Tap: The Retailers through Choose Tap have continued installing public drinking fountains and serving free tap water at events across the country, as well as
                             working with community groups, schools and sports clubs to support local communities and promote the quality of Melbourne’s tap water. Choose Tap is now focusing
                             efforts on tackling the environmental issues associated with single use plastics, helping Melbournians reduce their bottled water consumption.

                             Recycled Water: Retailers and Melbourne Water are investigating the feasibility of a recycled water ring main being incorporated into the suburban rail loop.

                                                                                                                                                                                                           8
City West Water                                                                                                                        Melbourne’s Water Outlook 2020
programs and projects

                             We operate and continue to develop schemes to supply recycled water to commercial, industrial
  Altona and West Werribee   and residential customers and for the irrigation of open spaces. City West Water supplies 8,220
  Recycled Water Schemes     residential properties and 64 non-residential properties with Class A recycled water delivering over
                             2500 ML/yr and reducing demand on drinking water.

                             We’re working with local partners to identify and implement opportunities to expand our current
  Western Area Recycled      recycled water supply area within Wyndham. To date this work has identified opportunity to provide
  Water Expansion            additional recycled water to our customers and therefore reduce demand on drinking water. Stage 1
                             of this project is scheduled for completion in 2021.

                             We are launching Greening the West Strategy Refresh driving Greening the West to 2025 and will
                             continue delivering regional green infrastructure projects in partnership with state government,
  Greening the West
                             local government, industry bodies and community groups, linking sustainable water supplies to
                             enabling healthy, liveable communities.

                             We are continuing to implement the Stormwater Harvesting Partnership Fund through completion
  Stormwater Harvesting
                             of a number of projects in 2020, including Balmoral Park, Arndell Park, Edinburgh Gardens,
  Partnership Fund
                             Woodlands Park and Laverton Baseball Centre.

                             We’re currently developing an infrastructure plan to supply alternative water to the Arden Macaulay
                             precinct. This plan will see supply of alternative water for use in all homes and businesses within the
  Arden Macaulay
  Alternative Water Plan     Arden Central area around the future North Melbourne station and also for irrigation of open space
                             throughout Arden Macaulay. We are working with our stakeholders to understand all costs, benefits
                             and funding mechanisms to enable the supply of alternative water to this important precinct.

                             Digital Metering: We have successfully installed approximately 900 digital meters in the Richmond
                             area and have achieved water efficiencies through identification of leaks on residential and non-
                             residential properties.

                             Greening the West: Partnered with key stakeholders to complete the ambitious plan to plant 1
                             million trees across Melbourne’s Western suburbs, delivering wide-ranging improvements to the
  Key achievements
                             liveability of Melbourne’s west. This program received a Premier’s Sustainability Award in 2019.

                             Stormwater Harvesting Partnership Fund: Awarded funding to six stormwater harvesting projects.
                             Melbourne Olympic Park Tennis Centre Stormwater Harvesting Scheme completed and now
                             supplying stormwater for urban greening.

                                                                                                                                                                   9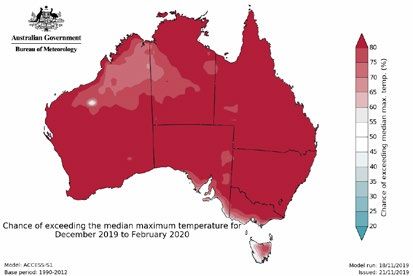
South East Water                                                                                                                        Melbourne’s Water Outlook 2020
programs and projects

  Water efficiency             We continue to raise awareness with current and future customers about the long-term benefits of
  campaigns                    water efficiency through social media campaigns, a new page on our online portal and information
                               in our customers’ bills.

                               We’ll be strengthening our relationships with local councils in our catchment area so we can help
                               contribute to healthier communities. For example, in 2019–20 we’ll be conducting trials with
  Local council partnerships   Frankston City Council and the City of Casey to improve water efficiency and affordability in their
                               communities. We’ll also collaborate with local councils to co-create greener, more liveable spaces for
                               their communities to enjoy.

                               By the end of 2020 we’ll have installed up to 15,000 digital meters in homes throughout Melbourne’s
  Digital metering             south east. The meters take readings every 30 minutes and send us a usage report once every day,
                               so we can let customers know if we notice anything unusual – like continuous water use – that could
                               mean they have a water leak.

                               We’re committed to supporting and assisting our most vulnerable customers. Our ‘Customer
                               First’ program is business-wide and proactively identifies and supports vulnerable customers. The
  Customer First program
                               program provides access to services to better enable these customers to manage their usage and
                               improve their water efficiency.

                               We’ll continue to create and support liveable, sustainable and climate resilient communities through
                               the integration of water sensitive design principles into our planning and delivery of water services.
  Supporting liveable
                               This will be achieved through projects including Fishermans Bend and Aquarevo, where we will
  communities
                               maximise use of water resources including rainwater and recycled water. We’ll also be delivering on
                               customer expectations to increase supply and use of recycled water, with a focus on new estates.

                               We appointed the John Holland SUEZ Beca (JHSB) joint venture to deliver and then manage a
                               major upgrade of our Boneo Water Recycling Plant. They’ll be implementing innovative treatment
                               technologies designed to reduce energy consumption in the water recycling process and protect
                               the local environment.

                               Lang Lang Water Recycling Plant: Our eight water recycling plants each produce Class A or Class C
  Key achievements             recycled water. In 2018–19, we supplied 6.9 billion litres of recycled water, saving the same amount
                               of drinking water. In 2018–19, construction continued on the upgrade to our Lang Lang Water
                               Recycling Plant to produce Class A recycled water, as well as Class C.

                               Aquarevo: We’ve welcomed the first homeowners at Aquarevo, our partnership developed with
                               Villawood Properties in Lyndhurst. All homes are equipped with smart tanks that capture, store and
                               use rain and stormwater, so residents only use drinking water where it’s really needed – and as a
                               result, they’ll use around 70% less water than an average home.

                                                                                                                                                                    10
Yarra Valley Water Melbourne’s Water Outlook 2020
programs and projects
We’re working to provide recycled water to more than 100,000 homes in Melbourne’s fast-growing
Recycled Water northern suburbs of Beveridge, Craigieburn, Epping, Kalkallo and Wallan, as well as Chirnside Park
and Lilydale. We’re also working with farmers and Yarra Ranges Council to develop a plan to use
recycled water to irrigate peri-urban agriculture at Coldstream.
Collaboration with our Integrated Water Management forum partners in the Yarra, Maribrynong and
Dandenong Creek catchments will deliver initiatives including:
• The Merri Creek Upper Integrated Water Management Sub-Catchment Plan
Integrated Water • Progressing plans to supply recycled water to about 5500 properties in Doncaster
Management
• Creation of a community farm in Whittlesea
• Naturalisation of Taralla Creek
We’re involved in water recycling planning at Monash (with South East Water) and LaTrobe National
Water Recycling at National Employment Clusters. We’re also working with the Department of Environment, Land, Water and
Employment Cluster Planning, Melbourne Water and local councils to review opportunities for water recycling in areas
undergoing redevelopment.
We’re working with about 800 customers in Vermont South to trial digital meters. Early results have
Digital metering been very positive, with data helping customers identify and address leaks on their property. The
findings have saved customers $7,858 a year and the equivalent of 18,000 bath tubs of water.
Non-revenue water
We continue to invest in ways to reduce water loss through leaks. We have proactive leak detection
reduction processes and are installing 29 network flow and pressure monitoring devices throughout the
network to identify hidden leaks and reduce non-revenue water losses.
Integrated Water Management: We partnered with the Wurundjeri Woi Wurrung Cultural Heritage
Aboriginal Corporation, Melbourne Water, Victorian Planning Authority and Whittlesea, Hume and
Mitchell councils, to investigate options for integrated water management outcomes for the Merri
Creek Sub-Catchment. This collaborative working group identified opportunities and concerns,
and came up with collective solutions. This will result in an integrated water plan, developed with
community involvement, which all partners will use in their individual planning processes.
Key achievements Climate Resilience: In 2018-19 we completed our Climate Resilience Plan which sets out key actions
that build our capacity, reduce our vulnerabilities and support long-term planning for an uncertain
future. Our waste to energy plant, “ReWaste”, has transformed more than 45,000 tonnes of food
waste into 10,000 Megawatt hours of clean energy since its launch two years ago.
Water Conservation Awareness: We created pop-up hubs at major shopping centres to share water
saving tips and spread the word about our programs to support vulnerable customers. We had
specialist customer service teams at Broadmeadows, Northland and Greensborough shopping
centres, and feedback was overwhelmingly positive.
11You can also read


