MAPPING SPATIOTEMPORAL DISTRIBUTION OF MANGROVES IN MAFIA ISLAND IN TANZANIA USING LANDSAT IMAGERY
←
→
Page content transcription
If your browser does not render page correctly, please read the page content below
The International Archives of the Photogrammetry, Remote Sensing and Spatial Information Sciences, Volume XLII-4/W8, 2018
                             FOSS4G 2018 – Academic Track, 29–31 August 2018, Dar es Salaam, Tanzania

    MAPPING SPATIOTEMPORAL DISTRIBUTION OF MANGROVES IN MAFIA ISLAND
                    IN TANZANIA USING LANDSAT IMAGERY

                                                     J.S.Mayunga* and G.A. Uhinga

     Center for Information and Communication Technology (CICT), Ardhi University, P. O. Box 35176, Dar es Salaam, Tanzania,
                                       mayungax@gmail.com, guidouhinga@gmail.com.

                                                        Commission IV, WG IV/4

KEY WORDS: Mapping; Mangroves; Satellite Image; Landsat; Mafia Island

ABSTRACT:

Mangroves are important for survival of coastal communities as they provide ecosystem services that support coastal population and
their livelihoods. Most coastal communities largely depend on ecosystem services provided by mangroves such as fuel wood,
building poles, charcoal, and also mangroves provide spawning ground for coastal fishes. Most importantly mangroves act as a buffer
that protects coastal communities from natural hazards such as tropical storms, strong winds, beach erosion, and even tsunami.
Despite the important role that mangroves play, yet mangroves are under serious threat to extinction worldwide. Many mangrove-rich
developing countries, including Tanzania, are facing challenges in establishing effective management plans to protect increasingly
threatened mangrove ecosystems. Most of these challenges are associated with inadequate or nonexistent of up-to-date and accurate
geospatial information. Knowledge on extent and spatial distribution of mangroves is critical in planning and effective management
of mangroves. The aim of this study was to assess the spatial and temporal distribution of mangroves in Mafia Island using remotely
sensed data for three decades (1985-2013). Results revealed a decrease of mangroves from 3,708.36 ha in 1985 to 3,187.25 ha in
2013. From the spatiotemporal dimension point of view, the results show that overall mangroves in Mafia Island have been gradually
decreasing over time. This trend suggests a decline rate of about 14% for the period of 28 years, which is an average rate of 0.5% per
year. This rate of mangrove loss should not be underestimated; effective protection measures and sustainable utilization of mangrove
resources are needed.

                     1. INTRODUCTION

Mangroves are important for survival of coastal communities as         Mangroves in Mafia Island are under high pressure and
they provide ecosystem services that support coastal population        threatened by increasing anthropogenic activities that contribute
and their livelihoods. Most coastal communities depend heavily         to high rate of mangrove depletion. Tanzania like many other
on ecosystem services provided by mangroves. For example,              mangrove-rich developing countries is facing challenges in
mangroves provide spawning ground for coastal fishes (Wang et          establishing effective management plans to protect increasingly
al. 2003 and Kuenzer et al. 2011) as well as useful products           threatened mangrove ecosystems. Most of these challenges are
such as fuel wood, building poles, charcoal, tannin and                associated with inadequate or nonexistent of up-to-date and
traditional medicines. Most importantly mangroves act as a             accurate geospatial information. For example, the only
buffer that protects coastal communities from natural hazards          estimation of spatial extent of mangroves coverage in the Island
(Chen et al. 2013) such as tropical storms, strong winds, beach        was that of 1989 inventory (Semesi 1992). Spatial and temporal
erosion, and even tsunami (Spalding et al. 2014, Mchenga and           distribution of mangroves in the Island is currently not known.
Ali 2015). Mangroves are also known as blue carbon sinks               Therefore the aim of the present study was to quantify and map
because they can transfer and store carbon in their sediments          the extent and spatiotemporal distribution of mangroves in the
more than those of terrestrial forests (Rhyma 2016, Kiruia et al.      Island using LANDSAT imagery in order to enhance spatial
2013 and Lawrence 2012). Despite the important role that               information for mangroves protection and management. The
mangroves play, yet mangroves are under serious threat to              basic reserch questions guiding this paper are: 1)How many
extinction in many parts of the world (Helliwell et al. 2004),         hectares of mangroves have been cleared for the past three
particularly in developing countries. Threats on mangroves are         decades?; 2)What have been the major causes of mangrove
projected to increase due to the increasing anthropogenic              forest deforestation in Mafia Island for the past three decades?;
activities, sea-level rise and climate change. Globally, it is         and 3)How do the results help to guide planning and policy
estimated that about 35% of mangroves has been lost from 1980          formulation for mangrove management?
to 2000 (Giri et al. 2011 and Kuenzer et al. 2011). This rate is
expected to increase, especially in developing countries due to
                                                                                      2.    MANGROVES MANAGEMENT
anthropogenic pressures such as over-harvesting of mangroves
                                                                                       INITIATIVES IN TANZANIA
for timber and fuel-wood production, aquaculture activities and
salt-pond constructions (Kairo et al. 2001). It is predicted that if    Previous studies reported that there are nine mangrove species
the current rate of mangrove clearance continues worldwide, all         found in Tanzania (Haule 2003, Helliwell et al. 2004 and
mangroves could disappear in the next 100 years (Duke et al.            Mangora 2011), all of which are also present in Mafia Island.
2007).                                                                  These mangroves species are:1) Rhizophora mucronata, 2)
1
                                                                        Ceriops tagal,3) Avicennia marina, 4) Bruguieria
                                                                        gymnorrhiza, 5) Heritiera littoralis, 6) Lumnitzera racemosa,
1                                                                       7) Sonneratia alba, 8) Xylocarpus granatum, and 9) Pemphis
    *Corresponding author

                                                 This contribution has been peer-reviewed.
                    https://doi.org/10.5194/isprs-archives-XLII-4-W8-133-2018 | © Authors 2018. CC BY 4.0 License.                  133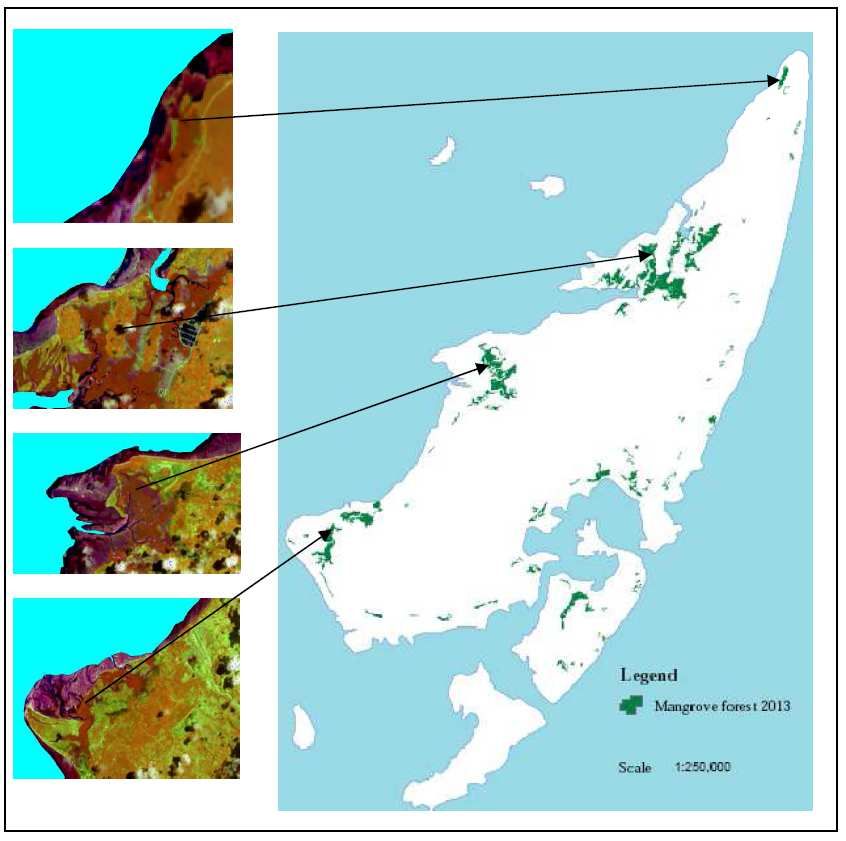
The International Archives of the Photogrammetry, Remote Sensing and Spatial Information Sciences, Volume XLII-4/W8, 2018
                           FOSS4G 2018 – Academic Track, 29–31 August 2018, Dar es Salaam, Tanzania

 acidula. Mangroves in Tanzania are found on the coasts of          more than doubled for the past ten years while the highest rate
 Tanga, Kilwa, Lindi, Muheza, Bagamoyo, Kisarawe, Mtwara            of mangrove loss was observed in Lindi (-11%) followed by
 and the delta of the Rufiji River, including Mafia Island (Wang    Bagamoyo (-10%) and Rufiji delta (-10%).
 et al. 2003). The last estimation of coverage area of mangroves
 in Tanzania Mainland was done in 2000 which estimated that            Region/District    1989          2000        1989-2000
 Tanzania mainland has a total of 108,138 ha (Wang et al.                                 Mangrove      Mangrov Rate of
 2003). However, this estimation did not include mangroves in                             s coverage    es          loss/gain of
 Mafia Island (Table 1). Mangroves in Tanzania are gazetted as                            area(ha)      coverage mangroves
 forest reserve since 1928 (Wang et al. 2003). Hence, they are                                          area(ha)    (%)
 protected areas of land by government law to regulate and             Mkinga & Tanga 9,403.3           9,313       -1
 control extraction and to ensure sustainable management of            Pangani             1,755.6      3,879       +121
 mangrove ecosystems and services (Mangora 2011).                      Bagamoyo            5,635.8      5,051       -10
 Historically, the government of Tanzania has been developing          Dar es Salaam       2,168.2      2,516       +16
 various initiatives to ensure protection and sustainable              Kisarawe            3,858.3      4,092       +6
 management of mangroves in the country. In 1988, the                  Rufiji              53,254.8     48,030      -10
 government established a national wide Mangrove
                                                                       Mafia               3,472.9      -           -
 Management Plan (MMP) to monitor mangrove habitats over
                                                                       Kilwa               22,438.7     21,755      -3
 time and prepare effective management plans. In 1995, a large
                                                                       Lindi               4,546.5      4,044       -11
 part of mangrove ecosystems in Mafia Island became under
 the protection of the Mafia Island Marine Park (MIMP)                 Mtwara              8,941.5      9,458       +6
 (Helliwell et al. 2004 and Lewis et al. 2011). The MIMP               Total               115,475.6    108,138     -6
 initiative was established by the government under the                       Table 2. Mangroves loss in Tanzania for the period
 Fisheries Act of 1970, which declared all small areas of reef in             between 1989 and 2000. Source: Semesi (1992) and
 the country, including those in Mafia Island as Marine                       Wang et al., (2003)
 Reserves for total protection. The MIMP in the Island covers
 an area of 1,745 ha (Lewis et al. 2011), which is about 2% of                   4. DATA AND METHODOLOGY
 the total area of the Island. In 2004, Mafia Island became part
 of the Rufiji-Mafia-Kilwa Marine Ramsar site (Helliwell et al.     4.1 The Study Area
 2004), which further called for protection of all coastal areas,
 including mangroves in the Island. Table 1 summarizes the          Mafia Island is one of the six districts that form the Coast
 government initiatives to protect mangrove forest in Mafia         Region in Tanzania and it covers an area of 972 km2, of which
 Island for the period between 1985 and 2013.                       407 km2 is dry land and 565 km2 is covered by water. Mafia
                                                                    Island and its chain of small islets lie approximately 120 km
  Period         Year   Government Initiatives to                   south of Dar es Salaam city and 20 km offshore from the eastern
                        Protect Mangroves in Mafia                  extent of the Rufiji Delta, which is the largest mangrove forest
  1985-1995    1987     Tanzania Forest Division declared           in the eastern Africa region (Semesi 1992). The Mafia main
                        a ban on cutting mangroves                  Island is about 48 km long and 17 km wide at its widest point
               1988     Establishment of Mangrove                   (Lewis et al. 2011). Islets are mainly scattered to the west and
                        Management Plan (MMP)                       south of the main Island and virtually lacking on the eastern and
  1995-2006    1995     Establishment of Mafia Island               northern sides of the main Island. The southern part of the
                        Marine Park (MIMP)                          Island is under the conservation program through the Mafia
               2002     Tanzania Forest Act allowed                 Island Marine Park (MIMP). Natural vegetations on Mafia
                        cutting of mangroves with a                 Island include the tidal mangrove thickets and scrubby coastal
                        permit                                      moorlands. According to the 2012 Tanzania housing and
               2004     Mafia Island became part of the             population census, the population of the Island was 46,438
                        Rufiji-Mafia-Kilwa Marine                   (URT 2012). Figure 3 depicts the location of Mafia Island in
                        Ramsar site                                 Tanzania.
  2006-2013    2006     No recorded initiatives during this
                        period
               2013     No recorded initiatives during this
                        period
    Table 1. Summary of government initiatives to protect
                mangroves in Mafia Island

           3. MANGROVE LOSS IN TANZANIA

Mangrove loss in Tanzania is well documented by Semesi
(1992) and Wang et al (2003).Their findings show that for the
period between 1989 and 2000 mangroves in Tanzania
decreased from 115,475.6 ha to 108,138 ha. This is a decrease
of 7,337.6 ha or 6% for the period of ten years (Table 2). The
data in Table 2 show that for the period of ten years, mangroves
in Pangani, Dar es Salaam, Kisarawe, and Mtwara have slightly
increased due to various restoration and sustainable utilization
programmes. Conversely, the data show that mangroves in
Mkinga & Tanga, Bagamoyo, Rufiji, Kilwa and Lindi are
declining. Important to note is that mangroves in Pangani have

                                                This contribution has been peer-reviewed.
                   https://doi.org/10.5194/isprs-archives-XLII-4-W8-133-2018 | © Authors 2018. CC BY 4.0 License.                134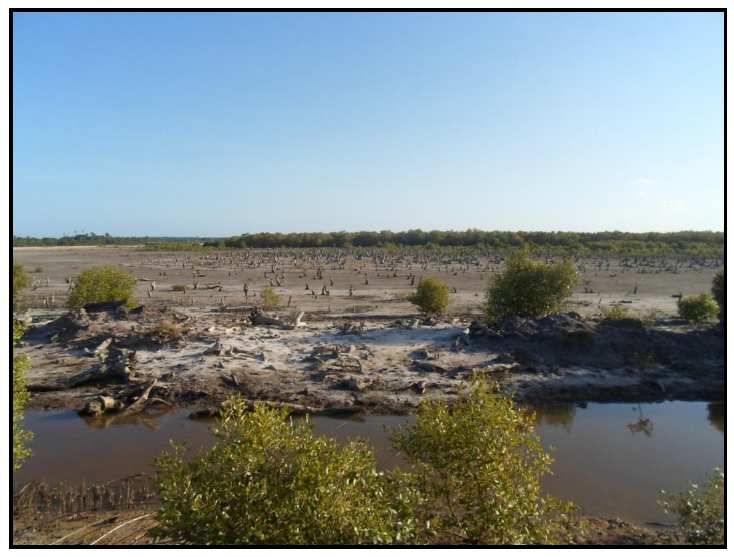
The International Archives of the Photogrammetry, Remote Sensing and Spatial Information Sciences, Volume XLII-4/W8, 2018
                           FOSS4G 2018 – Academic Track, 29–31 August 2018, Dar es Salaam, Tanzania

                                                                     (northern and southern parts of the Island). Training for image
                                                                     classification was done based on the GPS data collected from
                                                                     the field and the expert knowledge of mangrove areas in the
                                                                     Island. We used exiting land use maps and high resolution
                                                                     images (Google earth) to preliminary identify land cover types
                                                                     in the study area before the field data collection. Two files were
                                                                     created during the training exercise. One file was used as a
                                                                     training set for image classification while the other file was used
                                                                     for ground truthing to assess the accuracy of the classification
                                                                     results.

              Figure 3. Mafia Island Location Map

4.2 Data

A set of Landsat images (Landsat 5 and Landsat 8 OLI) were
used to quantify the mangrove forest changes in Mafia Island
for three decades (1985-1995; 1995-2006; and 2006-2013). The          Figure 4. Flowchart of the methodological procedures used to
Landsat 5 images were acquired for year 1985, 1995 and 2006                            analyzed mangrove forest
while Landsat 8 OLI image was acquired for year 2013. The
Landsat TM data have seven spectral bands, with a spatial            Supervised image classification using maximum likelihood
resolution of 30 m for bands 1–5 and 7. The Landsat 8 OLI data       algorithm was carried out to classify the colour composite
have nine spectral bands with a spatial resolution of 30 m for       images using the following band combination: band 5(Red),
bands 1–7 and 9. The images were obtained free of charge from        6(Green), 3(Blue). The classification process was done using
United States Geological Survey (USGS) and the Regional              the two training sample site files. Maximum likelihood
Center for Mapping of Resources for Development (RCMRD).             algorithm was chosen because it has a well-developed
Data for image classification and ground truthing for accuracy       theoretical base and it is more accurate than the other algorithms
assessment were collected using a Hand Held Global                   such as box algorithm, minimum distance to mean and
Positioning Systems (GPS) with a horizontal accuracy of ± 10         minimum mahalanobis distance algorithm (Bolstad 1991 and
meters.                                                              Chen et al. 2013). Confusion matrix/Standard Error Matrix
                                                                     established by using sample site data and ground truthing data
4.3 Methods                                                          was used to assess the accuracy of classification results. The
                                                                     final output of the classification process was mangrove spatial
There are several open source software available for GIS             distribution maps for the years 1985, 1995, 2006, and 2013.
analysis and image processing, that are very good alternatives to
commercial software e.g., ILWIS, QGIS and GRASS. In this                           5. RESULTS AND DISCUSSION
study we used ILWIS software for image processing and
ArcGIS software which is commercial software for preparation         Results of the accuracy assessment indicated a satisfactory rate
of final output maps. Analysis of the satellite images involved      of classification accuracy with an overall accuracy of 82.14%
the following processes: Georeferencing of the satellite images,     based on the maximum likelihood classification algorithm. The
Preparation of sample site map (Training site), Classification of    results further show a user accuracy of 90.30% and producer
the satellite images, Accuracy assessment of the classification      accuracy of 67.23%.
results and generation of spatial extent map. Figure 4 depicts the
Flowchart of the methodological procedures used in this study.       The colour composite scheme allowed mangroves to be easily
The images were georeferenced using four control points              detected in the image. In the colour composite generated,
extracted from Mafia Island topographic map sheet at a scale of      mangroves appear in dark red since they have a high reflectance
1:50,000. The control points were used to georeference all           in the Near Infrared band. Figure 5 shows selected mangrove
individual image bands of the images. The images were                sites along the western coast of the Island. The dark red colored
registered to the Universal Transverse Mercator System (UTM),        areas on the images represent the distribution of healthy
Zone 37 S, and Datum Arc 1960. Mafia Island falls in two             mangrove forest. The green areas on the map show the spatial
images scenes; therefore the georeferencing process enabled          distribution of mangroves in the Island.
mosaicking of the satellite images from the two scenes

                                                This contribution has been peer-reviewed.
                   https://doi.org/10.5194/isprs-archives-XLII-4-W8-133-2018 | © Authors 2018. CC BY 4.0 License.                   135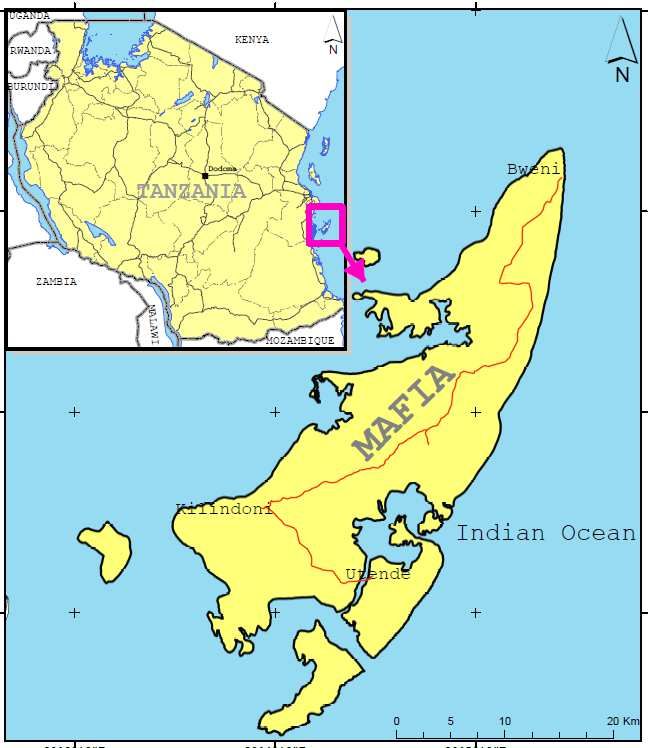
The International Archives of the Photogrammetry, Remote Sensing and Spatial Information Sciences, Volume XLII-4/W8, 2018
FOSS4G 2018 – Academic Track, 29–31 August 2018, Dar es Salaam, Tanzania
Figure 5. Sections of colour composite of mangrove rich areas
in Mafia Island and the final output map of classified images
showing distribution of mangrove in the year 2013
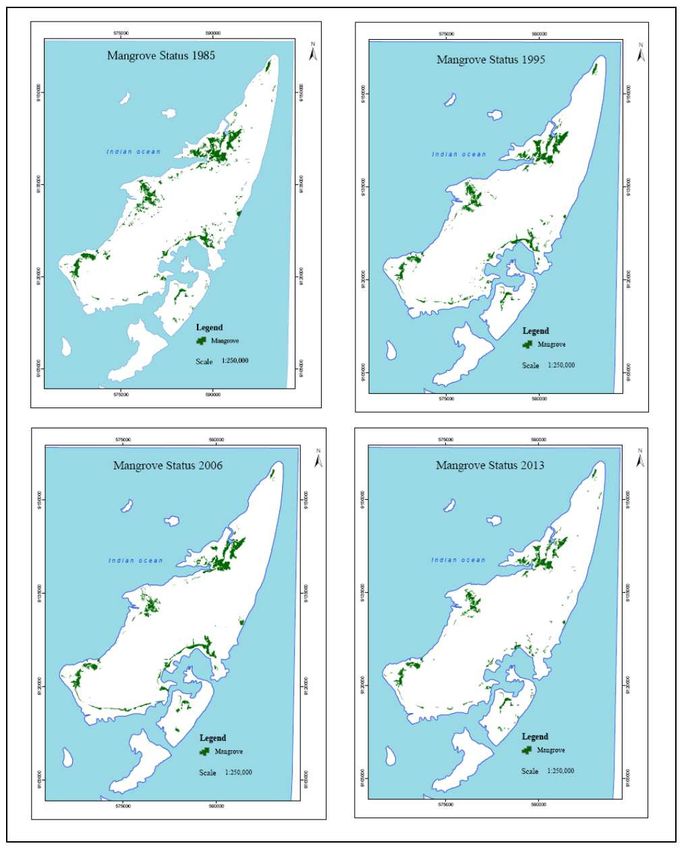
The results of spatiotemporal distribution of mangroves in
Mafia Island reflecting the trend of about three decadal of Figure 6. Spatial distribution of mangroves in Mafia Island in
changes (28 years) are presented in Figure 6. The image 2013
classification results indicate that most mangroves are found in
the western and southern part of the Island. There are few Year 1985 1995 2006 2013
mangroves in the northern part of the Island while there is Estimated
almost none in the eastern part of the Island where the Mlola Mangrove 3,708.36 3,671.07 3,438.16 3,187.25
Forest Reserve is located. From the spatiotemporal dimension Forest
point of view, the classification results show that overall Area (ha)
mangroves in Mafia Island have been gradually decreasing Table 7. Summary of status of mangrove forest area extent in
over time. Table 7 summarizes the estimated area coverage of Mafia Island from 1985-2013
mangrove forest in Mafia Island for three decades. The
classification results show that approximately 3,708.36 ha of Results further show that decline of mangroves in the Island is
mangroves existed in 1985, while about 3,671.07 ha existed in largely contributed by increasing anthropogenic activities such
1995. In 2006 the study estimated area coverage of 3,438.16 as aquiculture. In recent years, aquaculture has become an
ha of mangroves and in 2013 there were 3,187.25 ha. From increasing business in the Island and if this business is not
1985 to 2013, the trend suggests a loss of 521.11 ha of properly controlled, there is the potential for massive
mangroves in the Island which is about 14% or 0.5% per year. degradation of mangroves in the Island. Studies show that
shrimp farming in Eastern Africa region is becoming a biggest
threat to mangroves (Kairo et al.2001). Our study confirms
earlier findings that mangroves in many parts of the country are
generally declining (Mangora 2011 and Wang et al. 2003).
Furthermore, our findings are consistent with that of Lewis et al.
(2011) who noted some evidence of human impacts on
mangroves in Chole, the area that is completely located within
the Mafia Marine Park.
Overall results show that for the past three decades the trend of
mangrove forest in Mafia Island has been decreasing. However,
for the period between 2006 and 2013 there was a dramatic
decrease of mangroves in the Island. The high rate of mangrove
loss for the period between 2006 and 2013 can be associated
with mainly two factors: lack of sustainability of most donor
funded conservation projects established during the period
between 1985 and 2006 and increasing development of
aquaculture activities in the Island. Shrimp farming was
identified as a major cause of direct and indirect loss of
mangrove ecosystems in the island due to deforestation for pond
construction. Figures 8 and 9 show the progressive destruction
of mangrove forest due to shrimp farming in the Island.
This contribution has been peer-reviewed.
https://doi.org/10.5194/isprs-archives-XLII-4-W8-133-2018 | © Authors 2018. CC BY 4.0 License. 136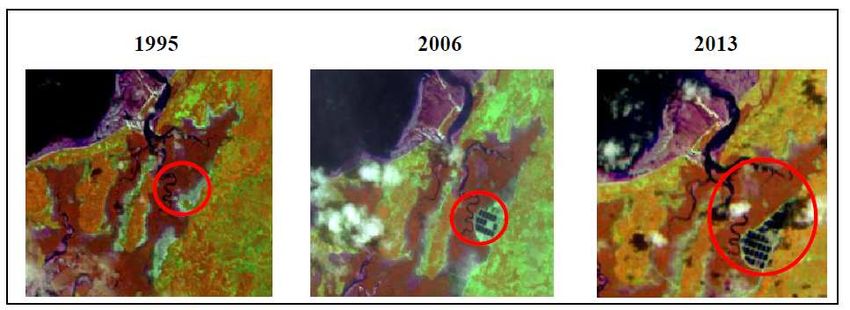
The International Archives of the Photogrammetry, Remote Sensing and Spatial Information Sciences, Volume XLII-4/W8, 2018
                           FOSS4G 2018 – Academic Track, 29–31 August 2018, Dar es Salaam, Tanzania

                                                                                       ACKNOWLEDGEMENTS

                                                                     The study was funded by SERVIR-Eastern and Southern Africa,
                                                                     which is a joint initiative of USAID (United States Agency for
                                                                     International Development) and NASA (National Aeronautics
                                                                     and Space Administration). The SERVIR-Eastern and Southern
                                                                     Africa is implemented in partnership with RCMRD (Regional
                                                                     Center for Mapping and Resources Development). The financial
 Figure 8 Mangrove clearance due to Shrimp Farming in Mafia          support is gratefully acknowledged. However, the findings,
                           Island                                    conclusions, and opinions expressed in this paper are solely
                                                                     those of the authors.

                                                                                             REFERENCES

                                                                     Bolstad, P., Lillesand, T.M., 1991. “Rapid maximum likelihood
                                                                     classification.” Photogrammetric Engineering & Remote
                                                                     Sensing 57(1), pp.67-74.

                                                                     Chen, C., Son, N., Chang, N., Chen, N., Chang, L., Valdez, M.,
                                                                     Centeno, G., Thompson, C., and Aceituno, J., 2013. “Multi-
                                                                     Decadal Mangrove Forest Change Detection and Prediction in
                                                                     Honduras, Central America, with Landsat Imagery and a
                                                                     Markov Chain Model.” Remote sensing 5, pp. 6408-6426.
                                                                     https://doi.org/10.3390/rs5126408.

                                                                     Duke, N.C., Meynecke, J. O., Dittmann, S., Ellison, A. M.,
                                                                     Anger, K., Berger, U., Cannicci, S., Diele, K., Ewel, .C., Field,
                                                                     C.D., Koedam, N., Lee, S.Y., Marchand, C., Nordhaus, I. and
                                                                     Dahdouh-Guebas, F., 2007. “A world without mangroves?”
Figure 9. The photo depicts widespread mangrove clearance for        Science 317: 5834, pp. 41–42.
shrimp farming in Mafia Island. The photo was taken in March,        http://hdl.handle.net/10453/14847.
                             2015.
                                                                     Giri1,C., Ochieng, E., Tieszen, L., Zhu, Z., Singh, A., Loveland,
Results further suggest that mangroves in the Island are             T., Masek, J., and Duke, N., 2011. “Status and distribution of
declining but not at a very high rate. The rate of mangroves loss    mangrove forests of the world using earth observation satellite
in the Island is estimated to be 0.5% per year. This rate is         data.” Global Ecology and Biogeography 20, pp.154–159.
relatively lower than that of the Tanzania mainland which is         https://doi.org/ 10.1111/j.1466-8238.2010.00584.x.
estimated to be 0.6% per year. However, the average annual rate
of decline of 0.5% should serve as a wakeup call to the              Green, E.P., Clark, C.D., Mumby, P. J., Edwards, A. J., and
government. More efforts must be taken to ensure effective           Ellis, A. C., 1998. “Remote sensing techniques for mangrove
protection of the threatened mangroves, not only in the Island       mapping.” International Journal of Remote Sensing 19(5),
but also across the country.                                         pp.935-956. ://doi.org/10.1080/014311698215801.

                      6. CONCLUSION                                  Helliwell, K., Tichler, M. and Cacre, E. 2004. “Tanzania Forest
                                                                     Research Programme, Utende Village, Mafia Island, Tanzania.”
There is still inadequate geospatial information for effective       TZF Phase 142 Science Report, Frontier.
mangrove planning and management in the Island. The spatial          https://frontiergap.com/Publications/Files (20 December, 2016)
information generated in this study may help the decision
making processes for rehabilitation and conservation efforts that    Kairo, J. D., Dahdouh-Guebas, F., Bosire. J., and Koedam, N.
are currently needed to protect and restore the depleted             2001. “Restoration and Management of Mangrove Systems: A
mangroves in the Island. Most importantly the existing               lesson for and from the East African region.” South African
mangrove policy and management plans could be improved by            Journal of Botany 67, pp.383–389.
utilizing the geospatial information and the maps generated by
this study. However, our results should be interpreted with          Kuenzer, C., Bluemel , A., Gebhardt, S., Quoc, T., and Dech,
caution as LANDSAT are low resolution satellite imagery              S. 2001. “Remote Sensing of Mangrove Ecosystems: A
which may underestimate the mangrove area coverage. Further          Review.” Remote Sensing 3, pp.878-928.
studies on mapping mangrove spatial and temporal distribution        https://doi.org/10.3390/rs3050878.
in the Island should focus on the use of high resolution satellite
imagery in order to improve the mangrove coverage estimation.        Lewis, E., Margerison, B., Sobkowiak, B. and Fanning, E. 2011.
This study contributes to our understanding on the status of         “Assessing the health of Mafia Island’s marine ecosystems.”
mangroves coverage, mangrove losses and its underlying causes        Frontier Tanzania Environmental Research Report 129. The
and the need to improve and strengthen the current planning and      Society for Environmental Exploration, London, UK.
management programmes and initiatives in the Island.                 http://frontier-dk.org/Publications/Files/2011_083.pdf (16
                                                                     March 2017).

                                                                     Lawrence, A. 2012. “Blue Carbon: A new concept for reducing
                                                                     the impacts of climate change by conserving coastal ecosystems

                                                This contribution has been peer-reviewed.
                   https://doi.org/10.5194/isprs-archives-XLII-4-W8-133-2018 | © Authors 2018. CC BY 4.0 License.                  137
The International Archives of the Photogrammetry, Remote Sensing and Spatial Information Sciences, Volume XLII-4/W8, 2018
FOSS4G 2018 – Academic Track, 29–31 August 2018, Dar es Salaam, Tanzania
in the Coral Triangle.”WWF report, Brisbane, Queensland,
WWF-Australia. http://www.taccire.suanet.ac.tz /(10 June
2017).
Mangora, M.M. 2011. “Poverty and institutional management
stand-off: a restoration and conservation dilemma for mangrove
forests of Tanzania.” Wetlands Ecology and Management, 19,
pp. 533-54. https://doi.org/10.1007/s11273-011-9234-2.
Mchenga, I.S.S. and Ali A.I. 2015. “A review of status of
mangrove forest in Zanzibar Island, Tanzania.” International
Journal of Research and Review 2(8), pp.518-526.
www.gkpublication.in.
Rhyma, P., Norizah K ., Ismail Adnan A. M., and Shamsudin I.
2016. “A review of uses of satellite imagery in monitoring
mangrove forests.” Earth and Environmental Science 37, pp.1-
14. https://doi.org/10.1088/1755-1315/37/1/012034.
Samoilys, M., Pabari, M., Andrew, T., Maina, G.W., Church,
J.,Momany, A., Mibei, B., Monjane, M., Shah, A.,
Menomussaga, M. and Mutta, D., 2015. Resilience of Coastal
Systems and their Human Partners in the Western Indian Ocean,
Nairobi Conversion, Nairobi Kenya.
https://portals.iucn.org/library/sites/library/files/documents/201
5-019.pdf (22 May 2017).
Semesi, A. K. 1992. “Developing Management Plans for the
Mangrove Reserves of Mainland Tanzania.” Hydrobiologia 247,
pp. 1–10.
Spalding, M., McIvor, A., Tonneijck, F.H., Tol, S. and Van Eijk,
P. 2014. Mangroves for coastal defence: Guidelines for coastal
managers & policy makers. Wetlands International and the
Nature Conservancy.
https://www.nature.org/media/oceansandcoasts/mangroves-for-
coastal-defence.pdf (12 October 2017).
United Republic of Tanzania (URT) .2012. Population and
Housing Census. National Bureau of Statistics, Ministry of
Finance, Dar es Salaam, Tanzania http://www.nbs.go.tz/
.(15 April 2017).
Wang, Y., Bonynge, G., Nugranad, J., Traber, M., Ngusaru, A.,
Tobey, J., Hale, L., Bowen, R., and Makota, V., 2003. “Remote
sensing of mangrove change along the Tanzania coast.” Marine
Geodesy 26, pp.1-2.
https://doi.org/10.1080/01490410390181243.
This contribution has been peer-reviewed.
https://doi.org/10.5194/isprs-archives-XLII-4-W8-133-2018 | © Authors 2018. CC BY 4.0 License. 138You can also read