MARKET ACCESS Estimating the implications of net-zero targets - Forest and Wood Products Australia
←
→
Page content transcription
If your browser does not render page correctly, please read the page content below
MARKET ACCESS

      Estimating the implications of
            net-zero targets

    Project number: PRE562-2021           August 2021

Level 11, 10-16 Queen Street
Melbourne VIC 3000, Australia
T +61 (0)3 9927 3200 E info@fwpa.com.au
W www.fwpa.com.au
Estimating the implications of net-zero targets
Prepared for
Forest & Wood Products Australia
by
Mitchell Perry, Lili Pechey and Jim BinneyEstimating the implications of net-zero targets
Project No: PRE562-2021
IMPORTANT NOTICE
This work is supported by funding provided to FWPA by the Department of Agriculture, Water and the
Environment (DAWE).
© 2021 Forest & Wood Products Australia Limited. All rights reserved.
Whilst all care has been taken to ensure the accuracy of the information contained in this publication,
Forest and Wood Products Australia Limited and all persons associated with them (FWPA) as well as
any other contributors make no representations or give any warranty regarding the use, suitability,
validity, accuracy, completeness, currency or reliability of the information, including any opinion or
advice, contained in this publication. To the maximum extent permitted by law, FWPA disclaims all
warranties of any kind, whether express or implied, including but not limited to any warranty that the
information is up-to-date, complete, true, legally compliant, accurate, non-misleading or suitable.
To the maximum extent permitted by law, FWPA excludes all liability in contract, tort (including
negligence), or otherwise for any injury, loss or damage whatsoever (whether direct, indirect, special
or consequential) arising out of or in connection with use or reliance on this publication (and any
information, opinions or advice therein) and whether caused by any errors, defects, omissions or
misrepresentations in this publication. Individual requirements may vary from those discussed in this
publication and you are advised to check with State authorities to ensure building compliance as well
as make your own professional assessment of the relevant applicable laws and Standards.
The work is copyright and protected under the terms of the Copyright Act 1968 (Cwth). All material
may be reproduced in whole or in part, provided that it is not sold or used for commercial benefit and
its source (Forest & Wood Products Australia Limited) is acknowledged and the above disclaimer is
included. Reproduction or copying for other purposes, which is strictly reserved only for the owner or
licensee of copyright under the Copyright Act, is prohibited without the prior written consent of FWPA.
ISBN: 978-1-925213-41-6
Researchers: Mitchell Perry, Lili Pechey and Jim Binney
Natural Capital Economics Pty Ltd
Level 1, 105-115 Dover St, Cremorne 3121
2EXECUTIVE SUMMARY
Context
With the recent publication of the Intergovernmental Panel on Climate Change Sixth Assessment
Report providing more evidence of the need for urgent action to address climate change, Australian
companies are increasingly expressing an ambition to achieve net-zero emissions by 2050.
The quantum of emissions reductions required is significant and there are often limited options for
companies to achieve their targets through changes to their own operating processes in the short
term. Therefore, many companies are considering the use of carbon offsets to reduce their overall net
contribution to climate change, where the costs of their own mitigation options are excessively high.
To date, there has been limited Australian analysis of the opportunity this presents for timber
plantations and environmental plantings or the area of land required to support such targets.
Approach
This study investigated the greenhouse gas emissions (GHG) of the 50 highest valued companies
traded on the Australian Stock Exchange (ASX50) to understand the quantity of emissions which
would need to be mitigated or offset annually to achieve net zero emissions by 20501. The reported
emissions of these companies were used to determine the area of timber plantations or environmental
plantings required to produce an equivalent volume of carbon abatement each year. From this, a
measure of the carbon abatement efficiency (i.e. ha / tonne CO2-e abated) was estimated for both
timber plantations and environmental plantings.
The analysis relies on a simplified model of net carbon abatement from plantations and environmental
plantings, which was developed as part of this study. The model is informed by the approach used to
calculate net carbon abatement and to issue Australian Carbon Credit Units (ACCUs) set out in current
Emissions Reduction Fund (ERF) methods. Estimates of carbon abatement for plantations are based
estimates associated with radiata pine plantations while estimates of carbon abatement for
environmental plantings are based on carbon sequestration rates associated with mixed species native
plantings.
Findings
Key findings from this study include:
• Companies making up the ASX50 produce about 66 Mt CO2-e each year (Scope 12 and Scope 23).
Roughly half of these companies are currently using or have expressed some interest in the use
carbon offsets to achieve carbon emissions reduction targets.
• Under the current plantation forestry method, radiata pine plantations can provide between 14
and 17 tonnes CO2-e of net abatement per hectare each year over a 25 year period. By
comparison, environmental plantings provide between 5 to 11 tonnes CO2-e of net abatement per
1
Noting that not all ASX50 companies have made commitments to achieve net zero emissions by 2050.
2
Scope 1 greenhouse gas emissions are the emissions released to the atmosphere as a direct result of an activity, or series of
activities at a facility level. Scope 1 emissions are sometimes referred to as direct emissions (CER, 2021).
3
Scope 2 greenhouse gas emissions are the emissions released to the atmosphere from the indirect consumption of an energy
commodity (CER, 2021).
Estimating the implications of net zero targets iiihectare each year, over the same period. These estimates are based on a permanence period4 of
100 years.
• Plantations are found to abate more carbon per hectare than environmental planting due to
higher growth rates in plantation species, which leads to higher rates of carbon sequestration, as
well as the repeated cycles of harvesting, which create harvested wood products (HWP) that store
carbon over long periods.
• To offset 10% of the annual emissions of all ASX50 companies for the next 25 years would require
establishing 377 to 463 thousand hectares of plantations or 585 to 1,313 thousand hectares of
environmental plantings. This comparison is presented in aggregate in Figure 1 and for a select
number of companies in Table 1. For context, Australia’s total commercial plantation area is
currently about 2 million hectares. Therefore, to offset 10% of the ASX50’s GHG emissions for the
next 25 years using plantations would require establishing an area about 1 fifth the size of the
current commercial plantation area, when midpoint estimates are considered.
• Along with storing carbon, HWP that are used in buildings can displace the use of more carbon
intensive materials within the construction value chain. This can include the use of timber to
replace steel and concrete in structural elements of buildings. This study has estimated the
additional carbon abatement provided when timber replaces steel and concrete to demonstrate
the additional advantages associated with establishing timber plantations to abate carbon
emissions. Findings indicate that, when 1 hectare of plantation timber is used to construct
predominantly timber buildings instead of predominantly steel or concrete buildings, embodied
emissions are reduced by between 55 and 547 t CO2-e. These emissions avoided are somewhat
similar to Scope 3 emissions.5
30
Annual GHG emissions / Annual net carbn
25
abatement (Mt CO2-e)
20
15
10
5
0
0 100 200 300 400 500 600 700 800 900 1,000 1,100 1,200 1,300 1,400 1,500
Land area (000's hectares)
Environmental plantings Plantations Annual ASX50 emissions (10%)
4
A permanence period defines how long a project must remain in place and may extend beyond the period for which a project
can earn ACCUs. Plantation and environmental planting projects can choose between a permanence period of 25 or 100 years.
Choosing the lesser permanence period will lead to a discounted number of ACCUs being issued (CER, 2016; CER, n.d.-b; CER,
2021-b)
5
Scope 3 emissions are indirect greenhouse gas emissions other than scope 2 emissions that are generated in the wider
economy. They include the emissions associated the extraction and production of purchased building materials. Scope 3
emissions are not reported under the NGER scheme (CER, 2021).
Estimating the implications of net zero targets ivFigure 1. Estimated land requirements to offset 10% of ASX50 emissions for the next 25 years This study was commissioned to provoke thought about the implications of ASX50 companies meeting their net zero targets by using carbon offsets. It finds that, if forestry offsets were to be used by major companies, timber plantations are considerably more efficient (in terms of CO2-e tonnes sequestered per hectare of land) than environmental plantings. The study has relied on desktop research, publicly available data, and several simplifying assumptions to make broad comparisons possible. It has not considered, for example, the risks associated with fire which is applicable to both plantations and environmental plantings. It has also not considered the additional environmental benefits that could be generated from both plantations and environmental plantings, such as increased biodiversity, erosion protection or improved amenity. Estimating the implications of net zero targets v
Table 1. Estimated land requirements to offset 10% of the GHG emissions of select ASX50 companies for the next 25 years

 Company                                                   Market             Annual emissions        Land requirement         Land requirement           Wood volume
                                                        capitalisation         - scope 1 and 2         with plantations             with EP                produced
                                                          ($ million)              (Mt CO2e)           (000’s hectares)         (000’s hectares)        (000’s M3/harvest)

 Commonwealth Bank of Australia1                                        180                     0.1                0.6 - 0.7               0.9 - 2.1                327 - 402

 BHP2,4                                                                 158                     5.1                 29 - 36                46 - 102           16,184 – 19,872

 CSL3                                                                   134                     0.1                0.5 - 0.7               0.8 - 1.9                294 - 361

 Westpac Banking Corporation1                                            92                     0.1                0.6 - 0.7                 0.9 - 2                320 - 393

 National Australia Bank1                                                88                     0.1                0.5 - 0.6               0.8 - 1.8                282 - 347

 Australia and New Zealand Banking                                       80                     0.1                0.6 - 0.7                 0.9 - 2                319 - 392
 Group1

 Fortescue Metals Group2                                                 75                     2.1                  9 - 11                 14 - 32             5,024 – 6,169

 Wesfarmers2                                                             71                     1.6                 12 - 15                 18 - 41             6,540 – 8,030

 Woolworths Group2                                                       50                     2.4                 13 - 17                 21 - 47             7,422 – 9,114

 Rio Tinto2                                                              49                    15.0               86 - 106               134 - 300            47,374 – 58,170
1Certified   carbon neutral; 2Net zero target; 3No targets set; 4GHG emissions are based on reported emissions in 2019-20, with no consideration of the proposed deal which
would see Woodside Petroleum take control of BHP’s petroleum assets
Source: Market Index (2021); CER (2021-c); UniSuper, 2021; Macdonald-Smith (2021); NCEconomics calculations

Estimating the implications of net zero targets                                                                                                                               vi
CONTENTS
Executive summary iii
Context iii
Approach iii
Findings iii
1 Introduction 1
1.1 Project background 1
1.2 Project aims 1
2 Method 2
3 Results 4
3.1 ASX50 greenhouse gas emissions 4
3.2 Net abatement and ACCUs 6
3.3 Land requirements to offset ASX50 annual emissions 7
3.4 Establishment costs of plantations and environmental plantings 11
3.5 Harvested wood products 11
4 Discussion and conclusions 14
References 16
Appendix A – Comparing the carbon abatement of plantations with carbon abatement of
environmental plantings 20
Aim 20
Model Inputs and Approach 20
Appendix B – Use of harvested wood products in buildings 23
Aim 23
Model Inputs and Approach 23
FIGURES
Figure 1. Estimated land requirements to offset 10% of ASX50 emissions for the next 25 years v
Figure 2 Reported GHG emissions of ASX50 4
Figure 3. Reported annual GHG emissions of ASX50 by sector and market capitalisation (% of total) 5
Figure 4. Largest ASX50 GHG emitters 6
Figure 5. Estimated land requirements to offset 10% of ASX50 emissions for the next 25 years 8
Figure 6. Estimated reduction in embodied emissions through substitution of steel and concrete buildings for
wood 12
Figure 7. Avoided emissions when HWP are used to construct predominantly wood buildings instead of
predominantly steel or concrete buildings 13
Estimating the implications of net zero targets viiFigure 8. Net carbon abatement from plantations and environmental plantings (Based on model midpoint
estimates for 1 hectare) 20
TABLES
Table 1. Estimated land requirements to offset 10% of the GHG emissions of select ASX50 companies for the
next 25 years vi
Table 2. Total carbon abatement which can earn ACCU’s over project life 7
Table 3. Estimated average annual number of ACCUs earned over 25 year crediting period 7
Table 4. Estimated land requirements to offset ASX50 emissions for the next 25 years 8
Table 5. Estimated land requirements to offset 10% of the GHG emissions of select ASX50 companies for the
next 25 years 10
Table 6. Estimated establishment costs by project type 11
Table 7. Model Inputs - Comparing the carbon abatement of plantations with carbon abatement of
environmental plantings 21
Table 8. Model Inputs – Use of harvest wood products in buildings 24
Estimating the implications of net zero targets viii1 INTRODUCTION
1.1 Project background
Many publicly listed companies have set targets to achieve net zero6 emissions by 2050 (CER, 2021).
Such targets can be achieved through actions to reduce the production of a given company’s
greenhouse gas (GHG) emissions (i.e. mitigation) or through the purchase of nature-based solutions,
such as carbon offsets. These decisions are based on the marginal costs of reducing emissions
through mitigation versus the cost of purchasing offsets in the market.
1.2 Project aims
Natural Capital Economics (NCE) was engaged by Forest and Wood Products Australia (FWPA) to
undertake a thought-provoking investigation into the ability of nature-based mechanisms to deliver
the required volume of carbon offsets for major corporations to meet their net zero emissions targets
as well as the potential role timber plantations may have as an effective and efficient pathway for
achieving these targets.
This project has focused on four key areas of investigation which include:
• The volume of GHG emissions and the emission reduction targets set by Australian companies
which are part of the ASX507.
• The quantum of land required for ASX50 companies to achieve net zero using carbon offsets
generated through plantation forestry8 and how it compares to the quantity of land required
to generate carbon offsets through environmental plantings 9.
• The establishment costs of plantations and environmental plantings.
• The added carbon abatement benefits plantations provide by providing harvested wood
products (HWP) which can be used to reduce the use of more carbon intensive material.
Specifically, this was examined through the lens of using timber instead of steel or concrete as
a structural building material.
6
‘Net zero emissions’ refers to achieving an overall balance between GHG emissions produced and GHG emissions taken out of
the atmosphere (Climate Council, 2020)
7
ASX50 refers to the 50 highest valued companies publicly traded on the Australian Stock Exchange
8
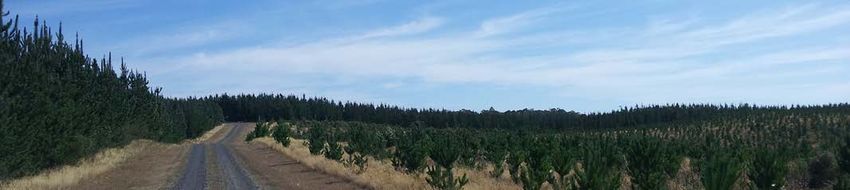
Plantations are defined as forests established for harvest (Australian Government, 2017)
9
Environmental plantings refer to non-harvested mixed species plantings. They may be established to enhanced biodiversity, to
sequester carbon, shelter for stock, manage salinity or for amenity value (CER, 2015; CSIRO, 2011)
Estimating the implications of net zero targets 12 METHOD This study has involved high-level desktop analysis, drawing on publicly available data, with limited data validation. It began with an investigation into the GHG emissions of ASX50 companies and their emissions targets, with information primarily gathered from the Clean Energy Regulator (CER). When CER data was unavailable, data was collected from company annual reports, company sustainability reports and news articles. This process is further detailed alongside findings in part 3.1 of this report Collecting emissions data on the ASX50 directly from the CER provided a high level of certainty as to the accuracy, timing, and boundaries of emissions estimates by companies. A lower level of certainty was available when collecting emissions data from other sources due to the presumption of less robust reporting requirements, and less explanatory information. For some companies, the boundaries of emissions reporting extended beyond those required when reporting to the CER (i.e. global emissions). In the absence of more detailed information, this data was included in our estimates of ASX50 emissions. This approach is not expected to have had a significant influence on the total estimated emissions of the ASX50, given the very high proportion of emissions which have been obtained directly from the CER. The review of ASX50 emissions was followed by the development of a model to estimate the net carbon abatement and number of Australian Carbon Credit Units (ACCUs) which could be earned per hectare for both timber plantations and environmental plantings. These estimates were compared to the emissions of ASX50 companies enabling the quantification of land required to offset these emissions. Data to develop this model were primarily sourced from the Australian Bureau of Agricultural and Resource Economics (ABARES), Commonwealth Scientific and Industrial Research Organisation (CSIRO) and the CER. The model draws on the approach used to calculate net abatement in the Emission Reduction Fund (ERF) Plantation Forestry Method10 and the Reforestation by Environmental or Mallee Plantings Method11. A full description of the model and its inputs is included in Appendix A. The final step of this study involved estimating the reduction in embodied carbon emissions that could be achieved by using HWP to replace more carbon intensive building materials. This benefit is not accounted for in the Plantation Forestry method. It is also not applicable to environmental plantings as the Reforestation by Environmental or Mallee Plantings Method does not allow for harvesting. However, it was included to provide an indication of the quantum of emissions that could be avoided, should there be an appropriate method for capturing reductions in embodied carbon emissions associated with building materials12. Quantification of embodied emissions reductions was estimated by drawing on previous research undertaken by NCEconomics (Perry et al., 2021), which described the volume of wood used in buildings of various types and the reduction in embodied emissions associated with constructing buildings which use wood for structural components instead of those buildings which use steel or concrete. This information was converted to a per ha basis using estimates of wood harvested from ABARES (2016). 10 The Plantation forestry method enables ACCUs to be earned for eligible and approved plantation forestry projects (CER, 2021-b) 11 The Reforestation by Environmental or Mallee Plantings Method enables ACCUs to be earned for eligible reforestation projects which involve establishing and maintaining vegetation. 12 The forestry industry is currently attempting to have a method accepted by the ERF that would allow reductions in embodied emissions associated with structural building materials to be eligible for ACCUs. Estimating the implications of net zero targets 2
In the models developed for this project, a range of values are used for most inputs, which reflects the
uncertainty associated with some of the input parameters. This allowed a Monte Carlo simulation with
20,000 iterations to be run for sensitivity analysis.

Estimating the implications of net zero targets                                                        3
3 RESULTS

3.1             ASX50 greenhouse gas emissions
The ASX50 includes 50 companies which emit about 66 Mt CO2-e annually when considering scope 113
and scope 214 emissions. This estimate is primarily based on emissions data from 2019-2020. Of these
50 companies, at least 26 report their emissions directly to the CER as required under the National
Greenhouse and Energy Reporting Act 2007. These 26 companies account for 98% of the estimated
emissions of the ASX50.
Figure 2 presents the number of companies in the ASX50 and their estimated annual emissions. It also
presents the number of companies which are part of the ASX50 and which have set a net zero target
or expressed an ambition / support for achieving net zero emissions. Finally, it presents the number of
ASX50 companies which are currently using / or have indicated an intention to use carbon offsets in
the future.
Figure 2 shows that 26 of the 50 companies in the ASX50, report net zero targets. Of these companies,
17 express targets that are linked to a 2050 timeframe, and 9 companies have committed to an earlier
timeframe. Of the ASX50, 24 companies have expressed some interest in using carbon offsets to meet
targets. These 24 companies emit about 50 Mt CO2-e or 75% of total reported emissions of the ASX50.

                70                                                                                                    50

                60
                                                                                                                      40

                                                                                                                           Number of companies
                50

                                                                                                                      30
     Mt CO2-e

                40

                30
                                                                                                                      20

                20
                                                                                                                      10
                10

                0                                                                                                     0
                           ASX50                  Companies with a net zero       Companies which have used/are
                                                      target/ambition                 interested in offsets
                                                  Annual emissions (scope 1 and scope 2)

Figure 2 Reported GHG emissions of ASX50

Figure 3 presents the annual emissions and market capitalisation of each sector in the ASX50 as a
percentage of the total. Sectors are ordered based on market capitalisation value. It shows that the
financial sector is the most valuable sector, accounting for 35% of the total value within the ASX50.
The financial sector is followed by materials and health care in terms of total value. By contrast, the
materials sector is the largest sector in the ASX50 based on GHG emissions accounting for 59% of the
total annual emissions. This is followed by the energy sector which accounts for 26% of the total

13
  Scope 1 greenhouse gas emissions are the emissions released to the atmosphere as a direct result of an activity, or series of
activities at a facility level. Scope 1 emissions are sometimes referred to as direct emissions (CER, 2021)
14
  Scope 2 greenhouse gas emissions are the emissions released to the atmosphere from the indirect consumption of an energy
commodity (CER, 2021)

Estimating the implications of net zero targets                                                                                                  4
emissions. Figure 3 illustrates that emissions and market value are not necessarily aligned and that
only a relatively small number of sectors are responsible for the majority of the total GHG emissions of
the ASX50.
Utilities
Energy
Consumer discretionary
Real Estate
Information Technology
Consumer staples
Communication services
Industrials
Health Care
Materials
Financials
0% 10% 20% 30% 40% 50% 60% 70%
% of total reported emissions
ASX50 GHG emissions ASX50 market capitalisation
Figure 3. Reported annual GHG emissions of ASX50 by sector and market capitalisation (% of total)
Source: Market Index (2021); CER (2021-c); Publicly reported emissions estimates
Figure 4 present the companies which are part of the ASX50 which emit the most GHG emissions each
year. The largest producer of GHG emissions in the ASX50 is Rio Tinto, which produces about 15 Mt
CO2-e each year or roughly 23% of all ASX50 annual emissions. The top three largest producers of
GHG emissions produce about half of the total emissions, while the top 5 and top 10 produce about
70% and 90% of the total, respectively. Like Figure 3, Figure 4 demonstrates how GHG emissions in the
ASX50 are highly concentrated, with only a few companies being responsible for most of the GHG
emissions. This finding is not unexpected due to the differing nature of companies involved.
Estimating the implications of net zero targets 516
14
GHG emissions ( CO2-e /year)
12
10
8
6
4
2
0
Figure 4. Largest ASX50 GHG emitters
Source: Market Index (2021); CER (2021-c); APA Group (2020); Publicly reported emissions estimates
3.2 Net abatement and ACCUs
The number of ACCUs that can be earned from a timber plantation and an environmental planting
depends on the relevant ERF methods and reflect the volume of net carbon abatement achieved. The
number of ACCUs which could be earned from a radiata pine plantation has been estimated based on
the Plantation Forestry Method. Similarly, the Reforestation by Environmental or Mallee Plantings
Method has been used to estimate the number of ACCUs which can be earned from environmental
plantings. Under both methods, ACCUs are earned at the end of each reporting period throughout the
crediting period, with both methods defining the crediting period as 25 years (CER, 2016; CER, n.d-b;
Queensland Government, 2021). Furthermore, each method defines a permanence period (i.e. how
long the plantings must remain in place) of either 25 or 100 years. Choosing the lesser permanence
period will lead to a discounted number of ACCUs being issued (CER, n.d.-b; CER, 2021-b). A further
5% discount also applies to all sequestration project, which is known as the “risk of reversal buffer”
(CER, 2018).
Under the Plantation Forestry Method, credited ACCUs cannot exceed the 100 year average value of
the carbon pool, which takes into consideration the carbon stored in plantation trees and HWP
(Australian Government, 2017). This condition does not apply to environmental plantings.
Table 2 present the estimated total carbon abatement which can be reported over the life of a given
plantation or environmental plantings project. Based on this modelling, 1 hectare of radiata pine
which is harvested every 30 to 35 years can abate about 355 - 435 t CO2-e when considering the 100-
year average volume of carbon stored in the plantation and HWP. By contrast, 1 hectare of
environmental plantings is estimated to abate between 125 – 281 t CO2-e, when considering the 25
year crediting period. These results indicate that plantations abate between 1.3 and 3.5 times more
CO2-e per hectare that environmental plantings.
Estimating the implications of net zero targets 6Table 2. Total carbon abatement which can earn ACCU’s over project life
Project type Carbon abatement per hectare (t CO2-e)
Low Mid High
Environmental planting 125 160 281
Radiata pine plantation 355 401 435
Source: NCEconomics calculations
The number of ACCUs that could be earned for each hypothetical project is presented in Table 3
based on the annual average number over a 25 year period. The number of ACCUs that a timber
plantation could earn is estimated to be 14 – 17 ACCUs each year when averaged over 25 years. For
environmental planting, the number of ACCUs is estimated to between 5 – 11 using the same
assumptions. These estimates assume a 100 year permanence period and take into account the risk of
reversal buffer.
In this studies modelling, a plantation project sequesters enough carbon to reach the long term
average value of its carbon pool before the end of the 25 year period, meaning the results reflect the
maximum number of carbon credits that could be earned. An environmental planting project also
sequestered enough carbon to reach its long term average value of its carbon pool before year 25,
however, to be consistent with the relevant ERF method this has not restricted the number of ACCUs
that can be earned. Therefore, for environmental plantings, ACCUs continue to be earned for all
carbon abatement up to year 25. Variation in annual net abatement and therefore accumulation of
ACCUs between plantations and environmental plantings is attributed to higher growth rates in
plantation species, which lead to greater rates of carbon sequestration. In addition, the process of
harvesting plantations results in the long-term storage of carbon in HWP.
Table 3. Estimated average annual number of ACCUs earned over 25 year crediting period
Project type Australian Carbon Credit Units (1 ACCU = 1 t CO2-e)
Low Mid High
Environmental planting 5 6 11
Radiata pine plantation 14 16 17
Note: the plantation estimates take into consideration emissions associated with harvesting and processing HWP.
Source: NCEconomics calculations
3.3 Land requirements to offset ASX50 annual emissions
Based on the estimated number of ACCUs which could be earned each year from plantations or
environmental plantings, the area of land required to offset 5, 10 and 20% of the GHG emissions of
the ASX50 for the next 25 years was estimated (Table 4). The 25 year period aligns with the crediting
period for both ERF methods. Using a longer assessment period also reflects the requirement that
recurrent emissions need to be offset annually to remain net zero. The 5, 10 and 20% scenarios reflect
our understanding that ASX50 companies will likely rely on a mixed approach (mitigation and offsets)
to achieve their emissions reduction targets.
Estimating the implications of net zero targets 7Table 4. Estimated land requirements to offset ASX50 emissions for the next 25 years
ASX50 GHG emissions offset Area of plantations Area of environmental plantings
over 25 years
(000’s hectares) (000’s hectares)
(% of total)
Low Mid High Low Mid High
5 188 205 231 292 513 656
10 377 410 463 585 1,025 1,313
20 754 820 926 1,169 2,051 2,625
Source: NCEconomics calculations
Figure 5 presents the upper, lower, and midpoint estimates of net carbon abatement from plantations
and environmental plantings and the area of land required to offset 10% of the annual GHG emissions
of the ASX50 (horizontal dashed line) over the next 25 years. The results indicate that it would require
between 377 and 463 thousand hectares of plantations or between 585 and 1,313 thousand hectares
of environmental planting to offset 10% of the annual GHG emissions of the ASX50 over the next 25
years. For context, Australia’s total commercial plantation area is about 2 million hectares, while the
area of agricultural land in Australia is estimated to be 377 million hectares (ABARES, 2019; ABS, 2021-
b). Therefore, the area of plantations required to offset 10% of the GHG emissions of the ASX50 over
the next 25 year is equivalent to about 20% of the current area of Australia’s commercial plantation
estate or 0.1% of Australia’s agricultural land. Figure 5 also highlights the relatively wide range in the
estimated environmental plantings results compared to the plantations results. This is primarily a
result of larger range in the estimated rates of carbon sequestration associated with environmental
planting. For both environmental plantings and plantations, the rate of carbon sequestration is
influenced by biomass growth rates (Unwin & Kriedemann, 2000). Growth rates, depend on the
species of tree or plant used as well as other factors including soil quality and water availability.
30
Annual GHG emissions / Annual net carbn
25
abatement (Mt CO2-e)
20
15
10
5
0
0 100 200 300 400 500 600 700 800 900 1,000 1,100 1,200 1,300 1,400 1,500
Land area (000's hectares)
Environmental plantings Plantations Annual ASX50 emissions (10%)
Figure 5. Estimated land requirements to offset 10% of ASX50 emissions for the next 25 years
Source: NCEconomics calculations
Estimating the implications of net zero targets 8Table 5 (overleaf) presents the market capitalisation and GHG emissions of the 10 most valuable companies within the ASX50 which report GHG emissions to the CER. For each of these companies Table 5 also presents the area of land required to offset 10% of their annual emissions if ACCUs generated from either plantations or environmental plantings were used as well as the volume of wood that could be obtained from a single harvest of this land. As the largest GHG emitter in the ASX50, Rio Tinto would require the greatest area of land to offset 10% of its GHG emissions (between 86 and 300 thousand hectares depending on the offset project).15 The GHG emissions of Rio Tinto have been obtained from the CER (2021-c). In 2020, Rio Tinto (2020) “set an ambition to reach 15 net zero carbon emissions across” its operations by 2050. Rio Tinto also indicated that carbon offsets will form part of its decarbonisation strategy. Estimating the implications of net zero targets 9
Table 5. Estimated land requirements to offset 10% of the GHG emissions of select ASX50 companies for the next 25 years

 Company                                                   Market             Annual emissions        Land requirement         Land requirement           Wood volume
                                                        capitalisation         - scope 1 and 2         with plantations             with EP                produced
                                                          ($ million)              (Mt CO2e)           (000’s hectares)         (000’s hectares)        (000’s M3/harvest)

 Commonwealth Bank of Australia1                                        180                     0.1                0.6 - 0.7               0.9 - 2.1                327 - 402

 BHP2,4                                                                 158                     5.1                 29 - 36                46 - 102           16,184 – 19,872

 CSL3                                                                   134                     0.1                0.5 - 0.7               0.8 - 1.9                294 - 361

 Westpac Banking Corporation1                                            92                     0.1                0.6 - 0.7                 0.9 - 2                320 - 393

 National Australia Bank1                                                88                     0.1                0.5 - 0.6               0.8 - 1.8                282 - 347

 Australia and New Zealand Banking                                       80                     0.1                0.6 - 0.7                 0.9 - 2                319 - 392
 Group1

 Fortescue Metals Group2                                                 75                     2.1                  9 - 11                 14 - 32             5,024 – 6,169

 Wesfarmers2                                                             71                     1.6                 12 - 15                 18 - 41             6,540 – 8,030

 Woolworths Group2                                                       50                     2.4                 13 - 17                 21 - 47             7,422 – 9,114

 Rio Tinto2                                                              49                    15.0               86 - 106               134 - 300            47,374 – 58,170
1Certified   carbon neutral; 2Net zero target; 3No targets set; 4GHG emissions are based on reported emissions in 2019-20, with no consideration of the proposed deal which
would see Woodside Petroleum take control of BHP’s petroleum assets
Source: Market Index (2021); CER (2021-c); UniSuper, 2021; Macdonald-Smith (2021); NCEconomics calculations

Estimating the implications of net zero targets                                                                                                                               10
3.4 Establishment costs of plantations and environmental plantings An understanding of establishment costs, ongoing costs and land acquisition costs is a key component in determining which is the most economically efficient method of abating GHG emissions from society’s perspective. The costs of establishing timber plantations and environmental plantings are presented in Table 6. Based on estimates from ABARES (2019-b), the cost of establishing a timber plantation is between $1,900 - $2,100 per hectare. By comparison, the costs of establishing environmental plantings are estimated to be between $1,000 - $9,100 per hectare (Environments by Design, 2016; CSIRO, 2011; Summers et al., 2014). These costs do not consider inflation or on-going costs. While the estimates are based on limited reference material, they demonstrate the wider range of establishment costs associated with environmental plantings. This is likely to reflect the diversity of species/locations in which environmental plantings are established compared to plantations. Table 6. Estimated establishment costs by project type Project Type Establishment cost range ($/hectare) Timber plantation costs 1,900 – 2,100 Environmental plantings 1,000 – 9,097 Source: ABARES, 2019-b; Environments by Design,2016; CSIRO, 2011; Summers et al., 2014 The costs of acquiring land can be considerable. Rural Bank (2021) report that the median value of Australian farmland was $5,907 per hectare in 2020. Industry representatives consider the cost of land in areas suitable for commercial plantation to be greater than $8,000 per hectare (C Taylor, pers. comms, 5 August 2021). Environmental plantings may be established as joint ventures with farmers, in which case, the purchase of land may not be required (CER, n.d.-b). Based on findings from this study, environmental plantings would require about 60% more land to achieve the same volume of carbon abatement. Notwithstanding the estimates in Table 6, similar costs for land and establishment would translate into costs which are 60% higher for environmental plantings than timber plantation per t CO2-e abated. This is significant given currently the ASX alone emit about 66 Mt CO2-e per year. These estimates are based on midpoint estimates of carbon abatement achieved by timber plantations and environmental plantings. 3.5 Harvested wood products The Plantation Forestry Method recognises the benefit HWP can have by storing carbon (embedded carbon) and reducing the volume of GHG emissions released into the atmosphere. The size of this benefit is linked to the length of time carbon remains stored, which is tied to the life expectancy of HWP. HWP used in construction, like structural timber, are expected to have a relative long life by comparison to a HWP like paper (Australian Government, 2017). In general, this means they can store carbon for longer creating more benefit. The Plantation Forestry Method only recognises carbon stored in HWP in use. This approach underestimates the carbon storage of HWP as these products can continue to store carbon for long periods after disposal in landfills (Ximenes et al., 2019). In addition to storing carbon, HWP can provide a benefit by reducing the volume of emissions released into the atmosphere through preventing the use of more carbon intensive materials (reducing embodied emissions). For example, if timber is used in place of steel and concrete when constructing buildings. The reduction in embodied emissions will depend on the difference between the embodied emissions of the materials being replaced and the embodied carbon of the replacement HWP. Estimating the implications of net zero targets 11
In a previous study, NCEconomics investigated the reduction in embodied emissions which could be
achieved by constructing buildings which primarily use wood for structural components instead of
buildings which primarily use steel or concrete. Drawing on estimates from this study (Perry et al.,
2021), the embodied emissions reductions have been estimated if plantation timber, which is planted
to generate ACCUs, is used for this purpose. The results of this analysis are presented in Figure 6.
Further information on the inputs and assumptions used for these calculations are provided in
Appendix B.
Figure 6 presents the estimated reduction in embodied emissions which can be achieved by using 1
hectare of plantation timber to construct houses predominantly made from timber instead of steel.
The benefit ranges from 55 to 197 t CO2-e. when between 5 and 13 timber houses are built instead of
steel houses. Alternatively, 1 hectare of plantation timber can be used to construct between 10 and 23
predominantly wood midrise apartments, which reduces embodied emissions by about 240 to 547 t
CO2-e when they are constructed instead of predominantly concrete apartments.

                              25                                                                                                600

                                                                                                                                500

                                                                                                                                      Avoided emissions (t CO2e)
                              20
    No of houses/apartments

                                                                                                                                400
                              15
                                                                                                                                300
                              10
                                                                                                                                200

                              5
                                                                                                                                100

                              -                                                                                                 -
                                   Substituting predominatly steel houses for   Substituting predominatly concrete apartments
                                                     wood                                         for wood

                                         Number of predominatly wood houses/apartments which can be built per hectare
                                         Avoided emissions (per hectare of wood harvested and used for substitution)

Figure 6. Estimated reduction in embodied emissions through substitution of steel and concrete buildings
for wood

Figure 7 demonstrates the cumulative benefit of using HWP to construct predominantly wood
buildings instead of predominantly steel houses or concrete apartments. The reduction in embodied
emissions shown is in addition to benefits derived from carbon sequestration that generate ACCUs.

Estimating the implications of net zero targets                                                                                                                    12
800,000
Maximum opportunity for Maximum opportunity
wood to be used in for wood to be used in
700,000 replacing predominatly replacing predominatly
Avoided embodied emissions (t CO2-e)
concrete midrise steel houses, each year.
600,000 apartments, each year.
500,000
400,000
300,000
200,000
100,000
-
0 200 400 600 800 1000 1200 1400 1600 1800 2000
Hectares wood harvest and used for building substitution
Substitution of steel houses Substitution of concrete midrise apartments
Figure 7. Avoided emissions when HWP are used to construct predominantly wood buildings instead of
predominantly steel or concrete buildings
Source: NCE modelling.
Estimates of market share and building approvals suggest about 15,500 steel houses and 5,000
concrete apartments were constructed in 2020. This limits the potential reduction in embodied
emissions to about 120,000 t CO2-e each year for the replacement of each building type. This is
equivalent to about 1,400 hectares of construction specific HWP for use in constructing timber houses
and 400 hectares of construction specific HWP for use in constructing midrise timber apartments.
Wood has the potential to be used in various applications across the construction industry to reduce
embodied emissions.
Estimating the implications of net zero targets 134 DISCUSSION AND CONCLUSIONS This study finds that based on the land area, plantations are more efficient than environmental plantings at carbon abatement. This is consistent with international research (Forster et al., 2021). Plantations have the potential to earn more ACCUs than environmental plantings per hectare and this means they could offset the GHG emissions of the ASX50 with a much lower land requirement. This finding includes consideration of the carbon released into the atmosphere during harvest events. Based on midpoint estimates, plantations require 60% less land than environmental planting to abate an equivalent volume of GHG emissions. This equates to 410 thousand hectares of timber plantations instead of 1,025 thousand hectares of environmental plantings if the ASX50 decided to offset 10% of their own emissions for the next 25 years. In 2017-18, Australia’s commercial plantation estate covered 1.95 million hectares (ABARES, 2019). To offset 10% of the ASX50 GHG emissions for the next 25 years, the plantation estate would need to be increased by around a fifth over the current area of commercial plantations, when midpoint estimates are considered. The scale of this increase is not inconsistent with existing industry strategies. The increase would still leave Australia’s commercial plantation estate more than 0.5 million hectares short of the target set for 2020 by the Planation 2020 vision (Plantations for Australia: The 2020 vision), which was established through a strategic partnership between Australian, State and Territory Governments and the plantation timber growing and processing industry. The Australian government also has a goal of planting 1 billion trees by 2030 (Australian Government, 2018). This is equivalent to about 400 thousand hectares of land. This number of trees would therefore be enough to offset about 10% of the ASX50 GHG emissions over the next 25 years or about 4% using environmental plantings, if eligible to earn ACCUs. Further emissions reductions would require further investment than is planned by this commitment. The use of HWP has been shown to reduce embodied emissions by replacing more carbon intensive materials. When replacing predominantly steel houses the additional reduction in emissions is about 87 t CO2-e per hectare of wood used. Constructing predominantly timber midrise apartments can reduce emissions by about 335 t CO2-e per hectare of wood used when they are constructed instead of predominantly concrete midrise apartments. The upper limit of these benefits is restricted by the number of these types of building currently being built. Embodied emissions reductions could however also be achieved when wood is used as an alternative material in other settings. Likewise, opportunities such as using harvest residues from new plantations to produce renewable energy, green hydrogen or biochar provide examples of further opportunities to potentially increase climate mitigation benefits (DAWE, 2019; Ximenes, 2021; Cho, 2021; Peacock, 2021). These pathways to reducing emissions are not available to environmental planting as they are not eligible for harvest under the current rules of the ERF. Considerations when interpreting the results This study has based its investigation of carbon abatement from plantations on a long rotation (harvested every 30 to 35 years) radiata pine plantation managed for sawlog production. In 2017-18, radiata pine accounted for 74.5% of Australia’s softwood plantation estate which is about 53% of the total commercial plantation area (ABARES, 2019). Further investigation into different plantation species (e.g. other softwood and hardwood species like southern pines or Tasmanian blue gum) and different harvest cycles (long rotation and short rotation plantations) would be expected to increase the range of outcomes associated with carbon abatement from plantations. This work has estimated the area of land required to offset the GHG emissions of the ASX50 if plantations or environmental planting were used to generate ACCUs. This study has not considered if estimate amount of land is available to use for this purpose. Currently, under the Plantation Forestry Estimating the implications of net zero targets 14
Method, new plantations are only eligible to earn ACCUs if they are occur in regions defined under the
national plantation inventory (CER, 2021-b).
Under the Plantation Forestry Method and the Reforestation by Environmental or Mallee Plantings
Method, participants are obligated to take actions to recapture carbon released during fire events if
they occur during the permanence period (CER, 2020). Alternatively, they can return an equivalent
number of ACCUs. This study has not considered the risks associated with fire, which would release
carbon into the atmosphere. This risk is applicable to both plantations and environmental plantings.
However, there may be a greater commercial incentive to protect plantations from fire, which means
such plantings are at lower risk.
Environmental plantings may comprise a range of species that have the potential to provide improved
biodiversity, erosion protection, sheltering stock, managing salinity or amenity as well as carbon
sequestration (CSIRO, 2011). Plantations also have the potential to provide wider environmental
benefits, for example by improving soil and water quality, salinity mitigation, carbon abatement and
improved biodiversity (DAWE, 2019).
As a trade-off to environmental benefits, plantations and environmental planting can also reduce
water availability by using more water than was previously used at the same site (i.e. by crops or
pasture) (O’Loughlin & Sadanandan Nambiar, 2001). Changes in water availability are influenced by
many factors including site and ecosystem details and management. This study has not attempted to
estimate the differences in the provision of environmental benefits between plantations and
environmental plantings. However, wider environmental benefits may be a factor in whether
plantation or environmental plantings are used to offset carbon emissions.

Estimating the implications of net zero targets                                                         15
REFERENCES
ABARES. (2011). Abatement potential from reforestation under selected carbon price scenarios.
Retrieved 13 August 2021 from https://treasury.gov.au/sites/default/files/2019-03/c2011-sglp-
supplementary-ABARES.pdf
ABARES. (2016). Australia’s plantation log supply 2015–2059. Retrieved 12 August 2021 from
https://data.gov.au/data/dataset/pb_afplsd9aafe20161215/resource/a8b5ebd3-6662-4884-82b7-
b42a323aef48
ABARES. (2019). Australian plantation statistics 2019 update. Retrieved 13 August 2021 from
https://www.agriculture.gov.au/sites/default/files/sitecollectiondocuments/abares/publications/AustPl
antationStats_2019_v.1.0.0.pdf
ABARES. (2019-b). Economic potential for new plantation establishment in Australia. Retrieved 13
August 2021 from
https://www.agriculture.gov.au/sites/default/files/abares/documents/PlantationEstablishmentOutlook
2050_v1.0.0.pdf
ABARES. (2020). Australia's forests. Retrieved 13 August 2021 from
https://www.agriculture.gov.au/abares/forestsaustralia/australias-forests
APA Group. (2021). Sustainability Report 2020. Retrieved 13 August 2021 from
https://www.apa.com.au/globalassets/about-apa/sustainability/sustainability-reports/apa-2020-
sustainability-report.pdf
Australian Construction Insights. (2018). Framing material used in residential construction. Retrieved
from https://www.fwpa.com.au/images/Newsletter_Images/Statistics-
count/2018/Dec18/ACI_Structural_framing_materials_used_in_residential_building_Final__3Dec2018.pd
f
Australian Bureau of Statistics. (2018). Characteristics of new residential dwellings – A 15 year
summary. Retrieved from https://www.abs.gov.au/articles/characteristics-new-residential-dwellings-
15-year-summary
Australian Bureau of Statistics. (2021). TABLE 20. Number of Dwelling Units Approved in New
Residential Buildings, Original – Australia. Building Approvals, Australia. Retrieved from
https://www.abs.gov.au/statistics/industry/building-and-construction/building-approvals-
australia/jan-2021
Australian Bureau of Statistics. (2021-b). Agricultural Commodities, Australia. Retrieved 26 August
2021 from https://www.abs.gov.au/statistics/industry/agriculture/agricultural-commodities-
australia/latest-release
Australian Government. (2017). Explanatory Statement - Carbon Credits (Carbon Farming Initiative—
Plantation Forestry) Methodology Determination 2017. Retrieved 12 Aug 2021 from
https://www.legislation.gov.au/Details/F2017L01038/Explanatory%20Statement/Text
Australian Government. (2018). Growing a Better Australia - A billion trees for jobs and growth.
Retrieved 13 August 2021 from
https://www.agriculture.gov.au/sites/default/files/sitecollectiondocuments/forestry/national-forest-
industries-plan.pdf
Cho, R. (2021). Why We Need Green Hydrogen. Retrieved 26 August 2021 from
https://news.climate.columbia.edu/2021/01/07/need-green-hydrogen/
Clean Energy Regulator [CER]. (2015). Returns on investment from sequestration projects. Retrieved 12
August 2021

Estimating the implications of net zero targets                                                        16
http://www.cleanenergyregulator.gov.au/ERF/Pages/Want%20to%20participate%20in%20the%20Emis
sions%20Reduction%20Fund/Planning%20a%20project/Feasibility%20and%20project%20planning/La
nd-based-projects%E2%80%93return-on-investment-considerations.aspx
Clean Energy Regulator [CER]. (2021). Greenhouse gases and energy. Retrieved 12 August 2021 from
http://www.cleanenergyregulator.gov.au/NGER/About-the-National-Greenhouse-and-Energy-
Reporting-scheme/Greenhouse-gases-and-energy
Clean Energy Regulator [CER]. (2021- b). Plantation forestry method. Retrieved 12 August 2021 from
http://www.cleanenergyregulator.gov.au/ERF/Pages/Choosing%20a%20project%20type/Opportunities
%20for%20the%20land%20sector/Vegetation%20and%20sequestration%20methods/Plantation-
forestry-
method.aspx#:~:text=The%20plantation%20forestry%20method%20increases,of%20harvesting%20for
%20forest%20products.
Clean Energy Regulator [CER]. (2021-c). Corporate emissions and energy data 2019-20. Retrieved 13
August 2021 from
http://www.cleanenergyregulator.gov.au/NGER/National%20greenhouse%20and%20energy%20report
ing%20data/Corporate%20emissions%20and%20energy%20data/corporate-emissions-and-energy-
data-2019-20
Clean Energy Regulator [CER]. (2020). Permanence obligations. Retrieved 15 August 2021 from
http://www.cleanenergyregulator.gov.au/ERF/Choosing-a-project-type/Opportunities-for-the-land-
sector/Permanence-obligations
Clean Energy Regulator [2016]. Make sure your timing is right. Retrieved 13 August 2021 from
http://www.cleanenergyregulator.gov.au/DocumentAssets/Pages/Make-sure-your-timing-is-right-
information-sheet.aspx
Clean Energy Regulator [CER]. (n.d.), Consultation Paper – Corporate Emissions Reduction
Transparency report. Retrieved 12 Aug 2021 from
http://www.cleanenergyregulator.gov.au/DocumentAssets/Documents/Corporate%20Emissions%20Re
duction%20Transparency%20Report%20consultation%20paper.pdf
Clean Energy Regulator [CER]. (n.d.-b) Environmental plantings projects. Retrieved 13 August 2021
from http://www.cleanenergyregulator.gov.au/csf/how-it-works/explore-project-
types/Pages/environmental-plantings-projects.aspx
Clean Energy Regulator [CER]. (2018). Risk of reversal buffer.
http://www.cleanenergyregulator.gov.au/ERF/Choosing-a-project-type/Opportunities-for-the-land-
sector/Risk-of-reversal-buffer
Climate Council. (2020). What does net zero emissions mean? Retrieved 12 August 2021 from
https://www.climatecouncil.org.au/resources/what-does-net-zero-emissions-mean/
CSIRO. (2011). Opportunities for carbon forestry in Australia: Economic assessment and constraints to
implementation. Retrieved 12 August 2021 from
https://publications.csiro.au/rpr/download?pid=csiro:EP113280&dsid=DS6
Department of Agriculture, Water, and the Environment [DAWE]. (2019). Plantations and farm forestry.
Retrieved 13 August 2021 from https://www.agriculture.gov.au/forestry/australias-forests/plantation-
farm-forestry
Department of Agriculture, Water, and the Environment [DAWE]. (2019-b). Biochar. Retrieved 26
August 2021 from https://www.agriculture.gov.au/ag-farm-food/climatechange/australias-farming-
future/biochar

Estimating the implications of net zero targets                                                     17
Department of Environment and Energy [DEE]. (2017). FullCAM Guidelines. Retrieved 13 August 2021
from https://www.industry.gov.au/sites/default/files/2020-07/fullcam-guidelines-plantation-
forestry.pdf
Environment by Designs. (2016). NRM Review and Price Guide for Significant Environmental Benefits.
Retrieved 13 August 2021 from
https://www.environment.sa.gov.au/files/sharedassets/public/native_veg/seb-price-guide.pdf
Forster, E., Healey, J., Dymond, C., and Styles, D. (2021). Commercial afforestation can deliver effective
climate change mitigation under multiple decarbonisation pathways. Retrieved 16 August 2021 from
https://www.nature.com/articles/s41467-021-24084-x
Market Index. (2021). List of ASX Companies. Retrieved from https://www.marketindex.com.au/asx-
listed-companies
Macdonald-Smith, A. (2021). BHP confirms oil ‘merger’ talks with Woodside. Retrieved 25 August 2021
from https://www.afr.com/companies/energy/bhp-confirms-oil-merger-talks-with-woodside-
20210816-p58j2f
Perry, M., Pechey, L., Lam, B., and Binney, J. (2021). Estimating the benefits of an emissions reduction
fund method for the use of timber products in buildings. Retrieved 13 August 2021 from
https://www.fwpa.com.au/images/marketaccess/2021/PRA541-
2021_Benefits_of_ERF_Method_Report_Final.pdf
Plantations for Australia: The 2020 vision. (2020). Retrieved 26 August 2021 from
https://www.agriculture.gov.au/sites/default/files/documents/plantations-australia-2020-vision.pdf
Private Forests Tasmania. (2011). Carbon Plantations Kit. Retrieved 13 August 2021 from
https://www.pft.tas.gov.au/__data/assets/pdf_file/0018/131841/Carbon_Plantations_Kit.pdf
Queensland Government. (2021). Frequently asked questions - Carbon farming. Retrieved 13 August
from https://www.qld.gov.au/environment/climate/climate-change/land-restoration-fund/about/faqs
Rio Tinto. (2020). Our Approach to Climate Change 2020. Retrieved 13 August 2021 from
https://www.riotinto.com/-/media/Content/Documents/Invest/Reports/Climate-Change-reports/RT-
climate-report-2020.pdf?rev=c415a8138bd7408496ccb3834511abc0
Rural Bank. (2021). Australian Farmland Values 2021. Retrieved 13 August 2021 from
https://www.ruralbank.com.au/knowledge-and-insights/publications/farmland-values/
O’Loughlin, E., & Sadanandan Nambiar, E. (2001). Plantations, Farm Forestry and Water. A discussion
paper. Retrieved 16 August 2021 from http://www.fao.org/forestry/5864-
0690f7cf152177f8518aef575aad3341d.pdf
Peacock, B. (2021). Can hydrogen made by burning wood really be considered green? Retrieved 25
August 2021 from https://www.pv-magazine-australia.com/2021/07/21/can-hydrogen-produced-by-
burning-biomass-really-be-considered-green/
Smith, H. & Ximenes, F. (2019). Production Forest Methodologies for the Emissions Reduction.
Retrieved 13 August 2021 from
https://www.researchgate.net/publication/335336415_Production_Forest_Methodologies_for_the_Emis
sions_Reduction
Summers, D., Bryan, B., Nolan, M., & Hobbs, T. (2014). The costs of reforestation: A spatial model of
the costs of establishing environmental and carbon plantings.
https://www.sciencedirect.com/science/article/abs/pii/S0264837714002737
UniSuper. (2021). Climate risk and our investments. Retrieved 25 August 2021 from
https://www.unisuper.com.au/-/media/files/investments/climate-risk-and-our-investments-2021.pdf

Estimating the implications of net zero targets                                                            18
Unwin, G., and Kriedemann, P. (2000). Principles and processes of carbon sequestration by trees.
Retrieved 15 August 2021 from
https://www.dpi.nsw.gov.au/__data/assets/pdf_file/0006/389859/Principles-and-Processes-of-Carbon-
Sequestration-by-Trees.pdf
Ximenes, F., Bjordal, C., Kathuria, A., Barlaz, M., Cowie, A. (2019). Improving understanding of carbon
storage in wood in landfills: evidence from reactor studies. Waste Management 85:341-350.
Ximenes, F. (2021). Forestry, bioenergy and climate – a way forward in Australia. Retrieved 26 August
2021 from https://www.researchgate.net/publication/350075945_Forestry_bioenergy_and_climate_-
a_way_forward_in_Australia
Victorian Building Authority. (2020). VBA DataVic Building permits 2020. Retrieved from
https://www.vba.vic.gov.au/about/data

Estimating the implications of net zero targets                                                           19
You can also read