Market possibilities within offshore wind - Jon Dugstad, Director Wind & Solar - norcowe

Page created by Marion Lucas
 
CONTINUE READING
Market possibilities within offshore wind - Jon Dugstad, Director Wind & Solar - norcowe
Market possibilities within offshore wind

          Jon Dugstad, Director Wind & Solar
Market possibilities within offshore wind - Jon Dugstad, Director Wind & Solar - norcowe
Founders
                                      Government
                                      •   Ministry of Petroleum and Energy
                                      •   Ministry of Trade and Fisheries
                                      •   Ministry of Foreign Affairs

                                      Trade organisations:
                                      •   Energy Norway
                                      •   Federation of Norwegian
• Merger of INTSOK and INTPOW             Industries
                                      •   Norwegian Oil and Gas
                                          Association
• Independent non-profit foundation   •   Norwegian Shipowners’
                                          Association
• 270 partners/members                •   The Norwegian Confederation of
                                          Trade Unions

                                      Industry
                                      •   Statoil
                                      •   Statkraft
Market possibilities within offshore wind - Jon Dugstad, Director Wind & Solar - norcowe
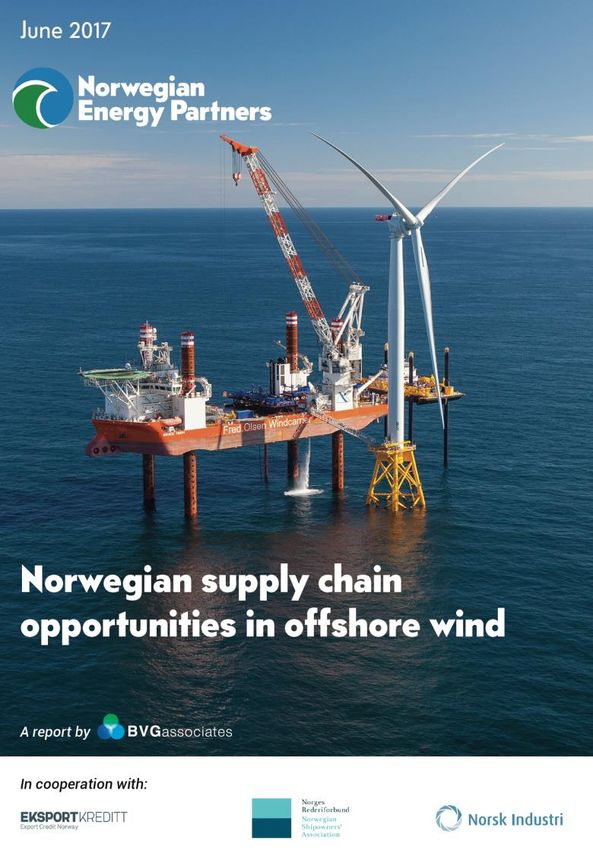
170 of 270 Norwegian Energy
Partners´ members interested
in offshore wind
Market possibilities within offshore wind - Jon Dugstad, Director Wind & Solar - norcowe
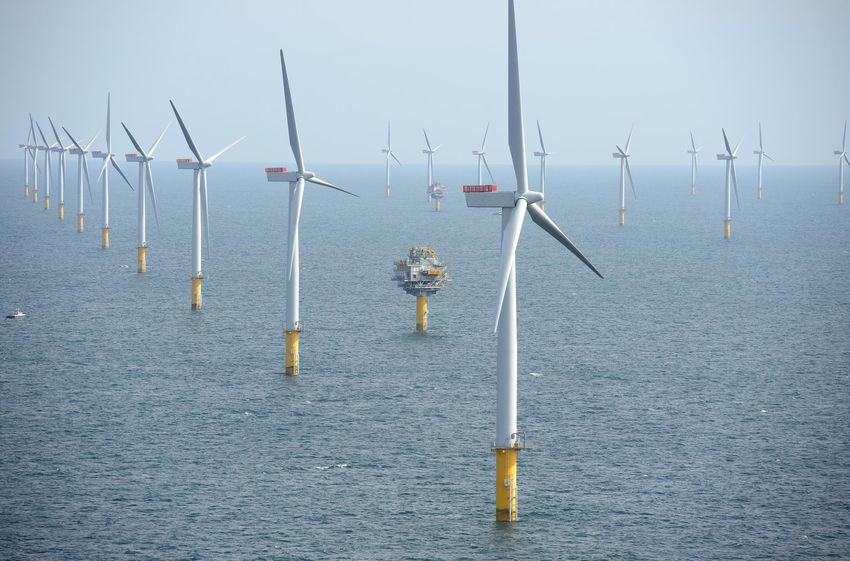
Offshore Wind – a growth market
Market possibilities within offshore wind - Jon Dugstad, Director Wind & Solar - norcowe
… based in Europe!
                                 3,5                                                                                  18

                                                                                                                           Cumulative installed capacity (GW)
                                              15,780 MW
Annual installed capacity (GW)
                                                                   Installed capacity                                 16
                                 3,0
                                                   4,419           Grid-connected turbines                            14
                                 2,5
                                                                                                                      12
                                 2,0
                                                            94     Grid connected sites
                                                                                                                      10

                                 1,5                                                                                  8

                                                                                                                      6
                                 1,0
                                                                                                                      4
                                 0,5
                                                                                                                      2

                                 0,0                                                                                  0
                                       1995   1998   2001   2003   2005   2007   2009     2011   2013   2015   2017
Market possibilities within offshore wind - Jon Dugstad, Director Wind & Solar - norcowe
Cost reductions quicker than expected..

                                                                                                                                                     180
                                                                                                                                                                                                                           Source: BVG Associates
                                                                                                                                                     160
   156
               145                                                                                                                                   140

                           124

                                                                                                                                      LCOE (€/MWh)
                                       122                                                                                                           120

                                                   102                                                                                               100

                                                                                                           85                                        80
                                                                78
                                                                             69          68                           65       65
                                                                                                 62                                                  60

                                                                                                                                                     40

                                                                                                                                                     20

  2014        2015        2015         2015        2015        2016        2016          2016   2017      2017       2017     2017                    0
                                                                                                                                                           2015 2016 2017 2018 2019 2020 2021 2022 2023 2024 2025 2026 2027 2028 2029 2030
 Walney Race Bank East               Borkum Horns Rev Borssele            Krigers    Borssele Cluster 1   Triton   Hornsea II Moray
extension         Anglia            Riffgrund  III     I & II              Flak       III & IV            Knoll                                             Offshore wind       NNG (UK)            EA1 (UK)             Horns Rev 3 (DK)
                                                                                                                                                            Borssele 1&2 (NL)   Vesterhav (DK)      Kriegers Flak (DK)   Borssele 3&4 (NL)
                                                                                                                                                            Triton Knoll (UK)   Hornsea 2 (UK)      Moray Firth (UK)
Sources: BEIS, DONG Energy, Bundesnetzagentur, NEV, Energinet.dk, Danish Energy Agency
Market possibilities within offshore wind - Jon Dugstad, Director Wind & Solar - norcowe
-… has made offshore wind competitive!

     Kilde: Wind Power Monthly/BEIS
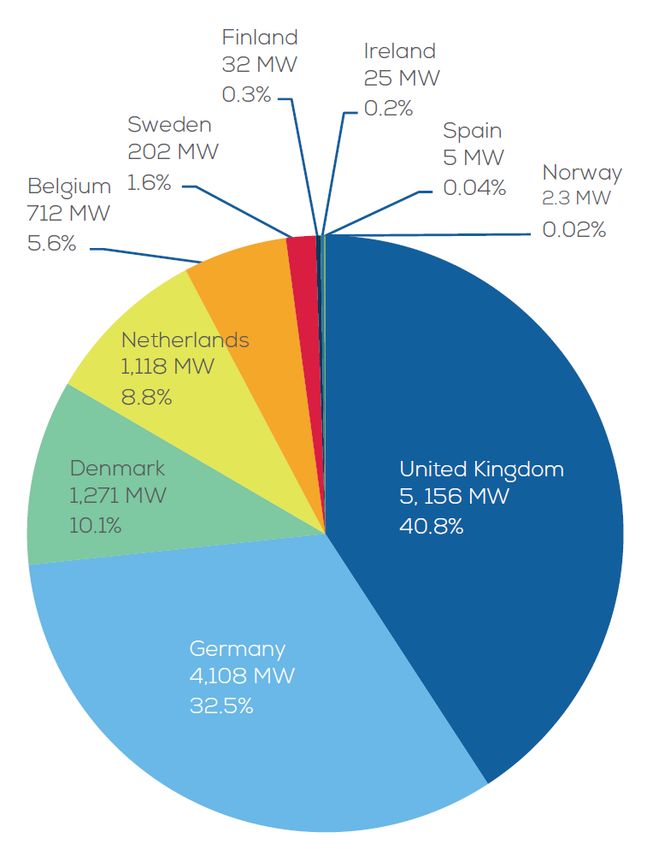
Market possibilities within offshore wind - Jon Dugstad, Director Wind & Solar - norcowe
Market to 2022
                                                                                                                       Installed capacity end 2022:
                                  10                                              50

                                                                                       Cumulative installed capacity
 Annual installed capacity (GW)

                                       Source: BVG Associates
                                                                        15.0% 40                                       Global                46.4GW
                                  8
                                                                                                                       Major markets: China, Germany and the UK
                                  6                                               30
                                                                                                                       Europe               33.9GW

                                                                                                 (GW)
                                                                                                                       Major markets: UK, Germany, Netherlands,
                                  4                                               20
                                                                                                                       and Denmark
                                  2                                               10                                   Asia                  11.3GW
                                                                                                                       Major markets: China, Japan, Taiwan and
                                  0                                               0                                    Korea
                                        '18       '19     '20   '21      '22
                                         Europe                       Asia                                             North America        1.2GW
                                         North America                Cumulative                                       Major markets: The US (east coast)

                                                                               © BVG Associates 2017
Market possibilities within offshore wind - Jon Dugstad, Director Wind & Solar - norcowe
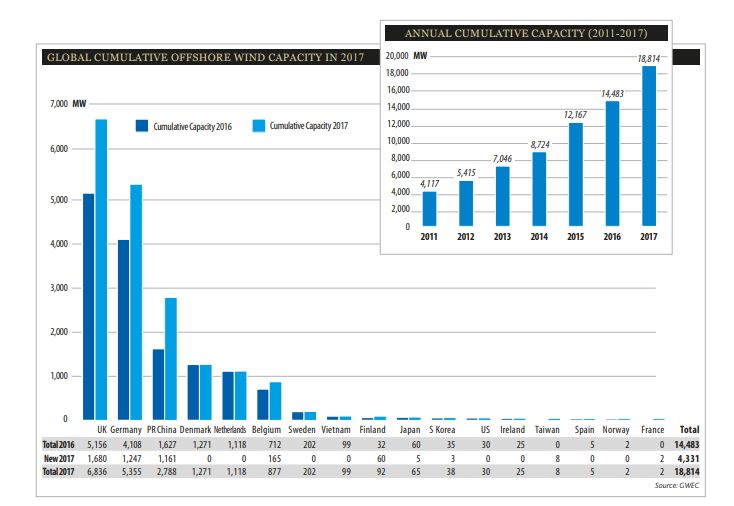
Further growth expected (15-17% p.a.)
     140

     120

     100

      80
GW

      60

      40

      20

      -
           2016 2017 2018 2019 2020 2021 2022 2023 2024 2025 2026 2027 2028 2029 2030

                              Europa   USA    Kina   Others
Technology, Supply Chain and Expenditure

Global Forecast to 2022

                          30,000                                                      • The rated power of turbines has increased over a 15-
                                   Source: BVG Associates                               year period, from 2MW to 9,5MW – with GE to
                          25,000                                                        supply 12 GW by 2020.
 Expenditure (€million)

                          20,000                                                      • Monopile foundations will continue to be widely used.
                                                                                        Jacket and gravity base foundations will be used in
                          15,000                                                        rocky soil conditions or deeper waters.

                                                                                      • 66kV array cables were first installed on a project in
                          10,000                                                        2017 increasing capacity and reducing electrical
                                                                                        losses
                           5,000
                                                                                      • Move towards 'third generation' jack-up installation
                              0                                                         vessels to perform lifts in higher wind speeds – larger
                                     '18        '19         '20   '21          '22      turbines.

                          Project development           Turbine                       • SOVs and drones becoming more widely used for
                                                                                        larger projects located further from shore.
                          Foundation                    Array cable
                          Transmission                  Turbine installation
                          Foundation installation       Array cable installation
                          Transmission installation     OMS

                                                                        © BVG Associates 2017
The European Market
Europe leads globally

European Forecast to 2022

                                   5,000                                         50

                                                                                      Cumulative installed capacity
  Annual installed capacity (MW)
                                           Source: BVG Associates         4.7%

                                   4,000                                         40

                                   3,000                                         30

                                                                                                (GW)
                                   2,000                                         20

                                   1,000                                         10

                                      0                                          0
                                            '18      '19    '20     '21   '22
                                      BE                   DK               FR
                                      DE                   NL               UK
                                      Other Europe         Cumulative

        • Europe has almost 16GW installed capacity at the
          end of 2017

        • In comparison, rest of world had just under 3GW
          installed at end 2017

        • By end of 2022, anticipated to reach about 33.9GW

        • Main markets after 2020: UK, Germany, Netherlands
          and France

                                                                                                                      © BVG Associates 2017
The Asian Market
Asian Forecast

Asian Forecast to 2022

                                    3,000                                               12

                                                                                             Cumulative installed capacity
   Annual installed capacity (MW)
                                             Source: BVG Associates and
                                             Renewable Energy Solutions         34.4%

                                    2,000                                               8

                                                                                                       (GW)
                                    1,000                                               4

                                       0                                                0
                                             '18      '19      '20        '21   '22
                                        CN                    JP                  TW
                                        Other Asia            Cumulative

  • Asia had almost 3 GW installed capacity at the end
    of 2017

  • By end of 2022, anticipated to reach about 11.3GW

  • Main markets after 2020: China, Japan, Korea,
    Taiwan

                                                                                        © BVG Associates 2017
The North American Market
North America

North America Forecast to 2022

                                  1,000                                                   2                                     House tax bill would reduce PTC credit

                                                                                                Cumulative installed capacity
                                                                                 157.5%
 Annual installed capacity (MW)                Source: BVG Associates and                                                       House Republicans released their tax proposal today, which would reduce the wind energy
                                               Renewable Resources International                                                Production Tax Credit from 2.3 cents per kilowatt-hour to 1.5 cents/kWh. "The House proposal
                                   750                                                    1.5                                   would pull the rug out from under 100,000 US wind workers and 500 American factories,
                                                                                                                                including some of the fastest growing jobs in the country," said Tom Kiernan, CEO of the
                                                                                                                                American Wind Energy Association. "We expect members of the House and Senate to oppose

                                                                                                          (GW)
                                   500                                                    1                                     any proposal that fails to honor that commitment, and we will fight hard to see that wind energy
                                                                                                                                continues to work for America."

                                   250                                                    0.5                                      Report: Northeast could add 8 GW of installed offshore wind capacity by 2030
                                                                                                                                   The Northeastern US could add up to 8 gigawatts of installed offshore wind capacity by 2030,
                                     0                                                    0                                        according to reports from Massachusetts, Rhode Island and New York. "Offshore wind is gaining
                                               '18      '19     '20      '21     '22                                               momentum as a significant new source of renewable energy in markets across the Northeast,
                                                                                                                                   and these reports demonstrate that this regional resource will create thousands of new American
                                          US           Other North America             Cumulative                                  energy jobs in the process," said Alicia Barton, president and CEO of the New York State Energy
                                                                                                                                   Research Development Authority.

    • North America has 30MW installed capacity at the end of
      2017

    • By end of 2022, anticipated to reach about 1,2 GW

    • Main markets after 2020: US (east coast)

                                                                                                               © BVG Associates 2017
Emerging markets

Rest of Europe

Estonia
Estonia has a target within its National Renewable Energy Action Plan to install up to 500MW of offshore wind
capacity by 2018, although as of yet it has no offshore wind installed capacity so reaching this target is unlikely.

Finland
There are three demonstration projects operating in Finland, with a total capacity of 32MW. In 2017, the 42MW
Tahkoluoto offshore wind farm was commissioned. The wind farm uses technology designed specifically for icy
weather conditions.

Ireland
In 2014, the Irish government published its Offshore Renewable Energy Development Plan setting targets for
offshore wind development for 2030. Following the plan, Ireland would install a minimum of 800MW of capacity,
with medium and high scenarios of 2.3GW and 4.5GW also envisioned by 2030.

Norway
To date, Norway has 2MW of offshore wind capacity installed at the Hywind floating demonstrator project.

Poland
Two projects announced – 2 GW one with the participation of Statoil Polenergia

Sweden
Slow development but government is preparing the grounds. Grid support by government, merchant project.

                                                  © BVG Associates 2017
Emerging markets

Rest of the world

Australia
Before 2015, the Government did not support development of an offshore wind industry. The current
Australian Government is more favourable towards an offshore wind industry and in 2015, Australia's Clean
Energy Innovation Fund was established to provide AUD $1 billion to support offshore technologies
(including offshore wind) from demonstration to commercial-scale deployment. CIP invested in one project.

Canada
Currently, Canada has no installed offshore wind capacity. In 2016 the government of Ontario, where the
majority of Canadian projects are planned to be located, announced it is to keep a moratorium on offshore
wind projects until potential environmental impacts are fully understood.

India
In 2015, the Indian Ministry of New and Renewable Energy (MNRE) announced a National Offshore Wind
Energy Policy, allowing areas within India's exclusive economic zone (EEZ) for offshore wind farm
development.

Vietnam
Vietnam has almost 100MW of capacity installed in the Bac Lieu offshore wind farm, installed in phases
between 2013 and 2015. A further 100MW is currently under construction at the first phase of the Khai
Long project, with the potential for an additional 200MW to be development at the site.
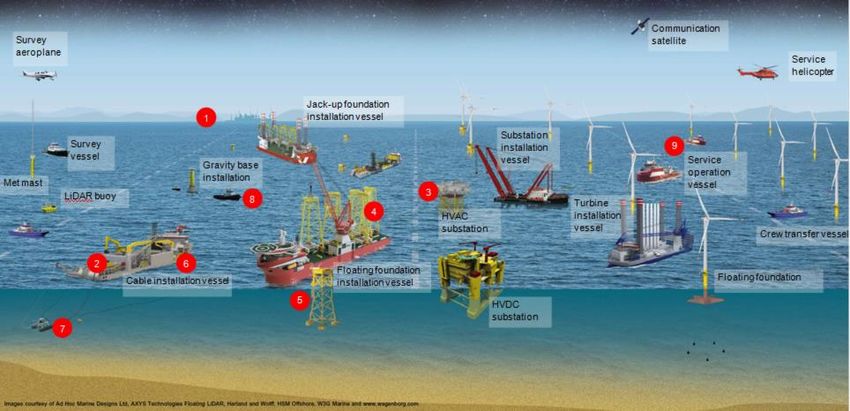
                                            © BVG Associates 2017
Opportunities for the Norwegian Supply Chain

        • Project Management
        • Subsea cables
        • Offshore substation structures
        • Turbine foundations
        • Installation equipment and support
          services
        • Maintenance and inspection services
        • Vessels and equipment
A Norwegian industry!
         45                                                                                                                               12%

NOK bn
         40
                                                                                                                                          10%
         35

         30                                                                                                                               8%

         25
                                                                                                                                          6%
         20

         15
                            • Norsk markedsandel fra 5 til 10% i 2030                                                                     4%
                            • Internasjonal omsetning 3-doblet neste 10 år
         10
                            • Omsetning nærmer seg 50 milliarder i 2030                                                                   2%
         5

         0                                                                                                                                0%
              2015   2016   2017   2018   2019    2020     2021     2022    2023      2024   2025   2026      2027   2028   2029   2030
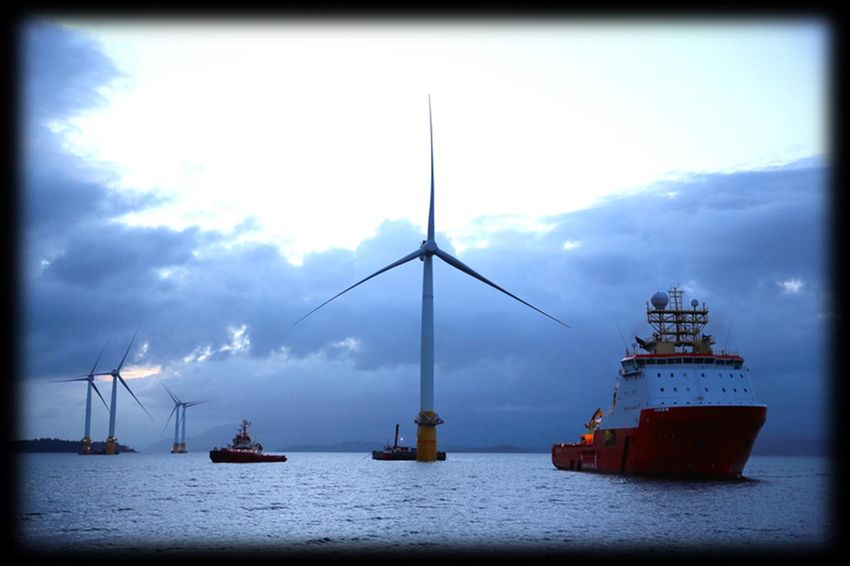
                                          Total 10 largest Norwegian co´s          Other       Market Share
Floating wind “first mover advantage”
30% Norwegian content at Hywind Scotland
-   Engineering of foundation, tower and
    system
-   Procurement services
-   Transportation of foundations
-   Pre-work for joining turbine with
    foundation and generators
-   Towing, anchoring and operations
-   Static and dynamic cabling and
    accessories
-   Safety, verification and surveillance
>300 MW of Demos and approx. 7 GW of Large Projects in Dev worldwide

                                                                   5

                                                       Source: Principle Power
International activities 2018
•   International Offshore Wind Partnering Forum - Princeton
•   Taiwan/China 9-13 April
•   FOWT – Marseille – 25-26 April
•   Solutions for cleaner Energy – 30 May - Paris
•   China Offshore Wind Summit 2018 – mid June
•   Global Offshore Wind – Manchester – 19-20 June
•   ONS Renewable Market – end august
•   Wind Energy Hamburg – 25-28 September
•   AWEA Offshore Wind – 16-17 Oct
•   Korea Offshore – Oct (TBD)
•   China Wind Power – Oct (TBD)
•   Offshore Energy – Oct – Amsterdam
Opportunity is enormous,
   limited only by our ability to exploit them!

Jon Dugstad – Director Wind & Solar
jon@norwep.com
You can also read