Half-year 2020 Results - Mersen

Page created by Stanley Carroll
 
CONTINUE READING
Half-year 2020 Results - Mersen
July 31 2020

Half-year 2020 Results
Half-year 2020 Results - Mersen
01
Resilience in H1 thanks
to the Group’s strength

Luc Themelin
CEO
Half-year 2020 Results - Mersen
Solid results in unprecedented circumstances

                      SALES      EBITDA              NET DEBT

              €430m             €62m                €228m
       -11% vs. H1 2019                          +€10m vs. Dec. 2019
                                                  including €7m from
                              14.4% of sales          acquisitions
              -13% on an       -200 points vs.
             organic basis        H1 2019         Leverage: 2.0x

3   H1 2020 results
Half-year 2020 Results - Mersen
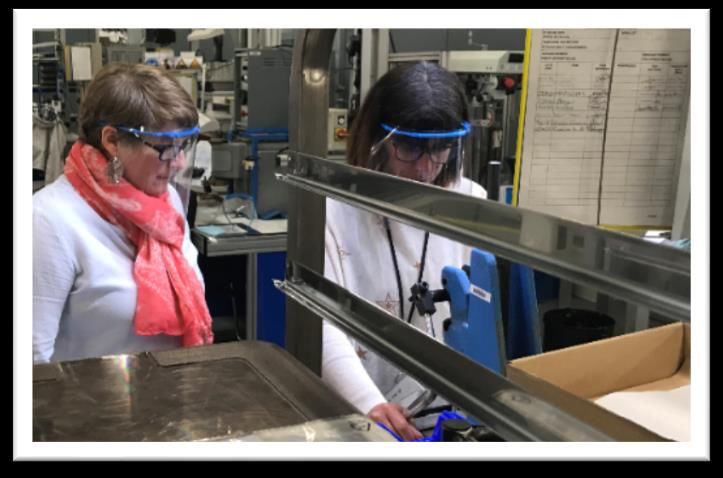
Mobilized teams who ensured business continuity

                 EVEN AT THE PEAK OF THE CRISIS, 85% OF GROUP PLANTS WERE OPERATIONAL

4   H1 2020 results
Half-year 2020 Results - Mersen
Rapid adaptation at the peak of the crisis to safeguard profitability

                       SITUATION IN APRIL AND MAY (VS Y-1)

                                                 April: -30% Europe; -25% North America
          SALES              -23%                May: -25% Europe; -35% North America

                                                 Furlough measures for 10% of employees
       PAYROLL                -9%            No government subsidies for approximately 20% of
                                                    employees (Mexico, India, Tunisia)

                                                         Components and Material
         OTHER
         COSTS               -23%                           Travel expenses
                                                               Consulting

                                       EBITDA IN APRIL AND MAY
                                            12.5% of Sales

 5   H1 2020 results
Half-year 2020 Results - Mersen
Resilience made possible by four years of development and
      transformation
                                                       OPERATING INCOME BEFORE                            FREE
              SALES (€m)                                                                               CASH FLOW*                              FINANCIAL LEVERAGE
                                                       NON-RECURRING ITEMS (€m)
                                                                                                          (€m)                                      (x EBITDA)

    2016-2019 CAGR                                       2016-2019 CAGR                       2016-2019 CAGR                                       2016-2019
                +8%                                                +19%                                    +6%                                           -0.6x
                                       950                                     102

                                                                                                                                            2.1x
     759
                                                             60                                                          60
                                                                                                                                                                  1.5x
                                                                                                  51

2016 (restated)                 2019 (published)       2016 (restated)    2019 (published)   2016 (restated)        2019 (published)   2016 (restated)       2019 (published)

      *Operating cash flow after capital expenditure

        6       H1 2020 results
Half-year 2020 Results - Mersen
Strong position in sustainable development markets, key drivers
for the future

                         SALES IN €M

                                1000

                                 900

                                 800
    EV
    Rail                         700                            Sustainable development
                                                                markets
    Electronics                  600
                                                                2016-2019 CAGR
    Wind
    Solar                        500                            +10%
    Water treatment
    Energy efficiency            400
    Chemicals
                                 300
    Aeronautics
                                                                Other markets
                                 200                            2016-2019 CAGR
    Process industries
    and other                    100                            +6%
                                   0
                                    2016   2017   2018   2019

7     H1 2020 results
Half-year 2020 Results - Mersen
A global footprint, essential in the current context

                                                Europe
                                               24 sites

North America
    14 sites

                                                          Asia Pacific
                                                          13 sites

                        South America/Africa
                             5 sites

8     H1 2020 results
02

H1 2020 Financial
Performance

Thomas Baumgartner
CFO
Particularly significant impact of Covid-19 in April and May
Improvement in June

     Sales
     in €m                  €225m                          Negative
                       80                                  organic growth (%)
                                                     -6%
                       75
                            -9%
                       70

                       65

                       60

                       55

                       50

                       45           -23%     -23%
                       40
                              Q1     April    May   June

10   H1 2020 results
H1 2020 Sales :
High comparable base and Covid-19 impact

       North America         -16%                     Europe       -16%
             33%*          vs H1 2019                 35%*       vs H1 2019

                                        South America / Africa     -29%       AsiA Pacific     -3%
                                                3%*              vs H1 2019      29%*        vs H1 2019

€430m
 -13.4%

* % Sales H1 2020
Organic growth (in %)

 11      H1 2020 results
Slight positive impact from prices and scope

                          484       VOLUME   PRICE    SCOPE        CHANGE
In €m

                                                                             430

                                                       AGM Italy
                                                      (6 months)

                                                     GAB Neumann
                                                      (4 months)

                          H1 2019                                           H1 2020

 12     H1 2020 results
A largely negative volume effect partly offset by cost
flexibilization
     Current Operating result in €m

     11.1%
                                      in %

                                      H1 2019 Current Operating margin              11.1%
                           8.1%
                                        Volume effect                                -5.3

                                        Cost flexibilization                         +1.3      Price effect slightly
                                        Impact of productivity                      +1.4             positive
      54                                Cost inflation                               -1.1
                                                                                                  No mix effect
                                                                                            Stable raw material prices
                            35
                                        Impact of exchange rates, scope and other   +0.7

                                      H1 2020 Current Operating Margin              8.1%

     H1 2019               H1 2020

13       H1 2020 results
Advanced Materials: good resilience despite a drop in volumes

                              42
                                                 Major impact of decreasing
                                                  volume (-14% organic
Current Operating                      32         decline in sales)
   result (€m)
                                                 Slight increase in prices
Current operating
  margin (%)                                     High level of cost flexibility
                            15.0%

                                      12.8%

                                                H1 2020 EBITDA:€50m
                                                   20.2% of Sales

                            H1 2019   H1 2020

   14     H1 2020 results
Electrical Power : profitability impacted by drop in volumes and
   unsubsidized temporary plant closures

                                                 Major impact of decreasing
                                                  volume (-12% organic decline
                             20                   in sales)
                                                 Impact of the temporary
                                       11         closure of sites with no option
                                                  for flexibilization (Mexico,
Current Operating
   result (€m)              10.0%                 Tunisia, India)
Current operating
                                                 R&D costs for Electric
  margin (%)                                      Vehicles
                                      6.2%
                                                 H1 2020 EBITDA: €19m
                                                     10.6% of Sales

                            H1 2019   H1 2020

   15     H1 2020 results
Net income

in €m                                   H1 2019   H1 2020

Current Operating Income                 53.6      34.7
                                                            Non-recurring expenses
 Non-recurring income and expenses       (3.2)     (4.9)    Litigation and acquisition costs

 Net financial income                    (6.1)     (6.1)

                                                            Effective tax rate
 Income tax                              (10.6)    (5.9)
                                                            25% (24% in H1 2019)

Net income                               33.7      17.8

 Attributable to owners of the parent    32.7      16.3

 16   H1 2020 results
Higher cash flow generation than in H1 2019, in spite of the
context
                                                          FCF in €m                                                     Seasonality always unfavourable
                                                                                                                           in the first half of the year
                                                        Operating cash flow
                                                           after Capex

                                              7                                                         11
                                                                                                                                 WCR: 28% of sales*
                                                                                                                                 Safety stock build-up
                                                                              35                                                 Stable customer delays
                                                                                                                                 Increase in trade receivables
                                                                                                                                 (seasonality)

                                                                              Operating Cash-Flow
                       26
                                                                                                          24
                       Operating Cash-Flow

                                                                                                                                 Capex contained
                                                                                                                                 Slowdown of some projects
                                                   19                                                                            due to the context.
                                                                                                        Capex                    Continuation of the Columbia
                                                  Capex                                                                          project (€9m)

                                             H1 2019                                                H1 2020     * Unfavourable calculation as it is based on 2nd quarter sales

17   H1 2020 results
Strong financial leverage

in €m
                                                                                                                  228
             218                                                                        11
                                  35                         7           6
                                                 24

      Net debt / EBITDA       1.5                                                                   Net debt / EBITDA       2.0
      Net debt / Equity      37%                                                                        Net debt / Equity   39%

          Dec. 2019        Operating cash flow   Capex   Acquisitions   Lease   Interest paiement and           June 2020
                                                                                         other

 18      H1 2020 results
A solid balance sheet with a maturity of financing close to 4.5
years

                       CONFIRMED CREDIT LINES
                    DRAWN DOWN AT JUNE 30, 2020
                               IN €M

                                                                                            130
     Syndicated loan
                                                                             90
     USPP

     Schuldschein                                   45              60
                                                   (nov)

                               2019       2020     2021    2022     2023    2024     2025   2026

                                             UNDRAWN CONFIRMED CREDIT LINES: €130M
                                                    CASH AVAILABLE: €90M

19     H1 2020 results
03

Challenges for 2020
and beyond
Luc Themelin
CEO
Operations adapted to deal with the crisis

                  Crisis management unit set up from the first signs of the pandemic in China
                   (January)
                        Including members of the Executive Committee and regional managers
                        Regular reporting to and consultation with the Board of Directors

                  Local management measures to take into account local legislation and cultural
                   aspects
                        Coordination with site managers in certain countries (United States, France,
                         China)

                          >55 industrial sites                      35 countries

21   H1 2020 results
Concrete measures

                 Preserving human capital
                        Furlough schemes (10% of headcount on average in April and May)
                        “Use it or Lose it” for paid vacation time and time-off
                        Voluntary waiver of free shares by senior management and voluntary pay cuts by CEO and Board
                        Bonus for employees who ensured business continuity in France

                 Adapting costs
                        Reduction in operating costs (travel, consulting, recruitment)
                        Adaptation of production capacities ; little adaptation to the context necessary
                        Additional costs linked to Covid-19: ~€2m (PPE, logistics)

                 Protecting cash flow
                        Reduction in capex (-20% vs. initial planned budget)
                        Cancellation of 2019 dividend
                        Strict management of working capital (inventories and trade receivables)

22   H1 2020 results
Consolidating of our position in sustainable development markets

                               PROCESS
                             INDUSTRIES              -23%
                                    32%

                             CHEMICALS
                                                      18%
                                   10%                                Sustainable development   -3%
-13%                                                                    markets held up well
                     TRANSPORTATION
                                17%                  -16%
                                                                     RAIL                       -8%
                                                                     ELECTRIC VEHICLES
                          ELECTRONICS
                                                       -6%
                                  21%                                ELECTRONICS                -6%

                                  ENERGY              +5%                                       +5%
                                     20%
                                                                     RENEWABLE ENERGIES

                   Breakdown of H1 2020 sales   Change vs. H1 2019

 23    H1 2020 results
Pressing ahead with our roadmap in each segment
Advanced Materials
             Developing our center of excellence in Columbia strengthened by the
             Americarb acquisition
              Americarb:
                        Local production of felts for the semiconductor manufacturers in the US
                        Reduction of the capex initially planned in Europe
              Graphite:
                        Extruded: The first blocks being manufactured, ahead of schedule in the roadmap
                        Isostatic: Current backdrop means planned investments have been pushed back

             Preparing for the future
              Semiconductor market
                        Investments underway in Europe for flexible and rigid insulating felt solutions to meet demand in Europe and Asia.
              Asia: modernization of three plants to meet the needs (volume and range) of the solar and
               semiconductor markets
                        Relocation to bigger, more modern facilities (high-tech processes for the electronics market)
                        Increase in capacities for solar and semiconductors

24   H1 2020 results
Pressing ahead with our roadmap in each segment
Electrical Power

                  Accelerating the integration of acquisitions
                   FTCap: Win new markets for capacitors (underway)
                   Idealec: Ramp-up in profitability (achieved)

                  Ongoing review of our industrial efficiency
                   Plan for a modern, integrated plant in Asia for the industrial, semiconductor and electric vehicle markets
                   Analysis of industrial efficiency in Europe

                  Preparing for the future
                   EV: technical qualification process underway with car manufacturers
                   Market launch of new products (high-performance cooling solutions, flexible busbars for batteries)

25   H1 2020 results
Pressing ahead with our roadmap despite the major uncertainties
that lie ahead

      June: Negative organic growth in sales more contained (-6%)
             All sites now operational, with utilization rates adjusted to market demand
             End of lockdown in most industrialized countries

      But major uncertainties persist
             Lockdown/no lockdown (India, United States)
             Changes in demand (process industries, chemicals)
             Stimulus plans

26   H1 2020 results
Beyond the crisis, prepare for 2021

      Group roadmap: focus on the development of “green” markets with an efficient
       local production footprint
             Investments for the semiconductor and renewable energies markets
             Modernization of production facilities to increase efficiency
             Strengthening of local presence

      Preparation of scenarios to take on 2021 under the best conditions
             Capex review
             Analysis of how to adapt costs according to recovery scenario

27   H1 2020 results
You can also read