"Eye of the Storm": Social Sensing of Extreme Weather Events Using Social Media
←
→
Page content transcription
If your browser does not render page correctly, please read the page content below
“Eye of the Storm”:
     Social Sensing of Extreme Weather
         Events Using Social Media

                                  Michelle Spruce
                              PhD Computer Science
                            PI – Dr Hywel T. P. Williams
Research undertaken as part of University of Exeter SEDA Lab (Social & Environmental
                       Data Analysis @ University of Exeter)

                                                                                            1 2018
                                              RMetS NCAS Atmospheric Science Conference - July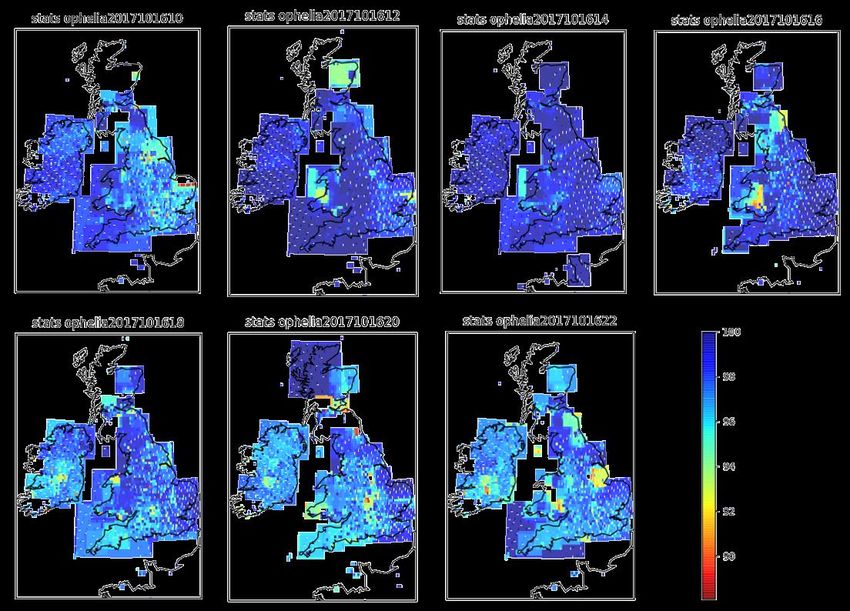
Project Context
• Extreme weather events cause disruption to communities and
  economies.
• However the specific impacts can be hard to forecast and observe.
• ‘Social Sensing’ provides an opportunity to improve understanding
  of impacts of extreme weather events.
• With Social Media, public can comment on and respond to their
  experiences of events such as extreme weather events.
• Improved understanding of impacts would allow better
  verification of meteorological forecast models and aid impact
  based forecasting
                                                                      2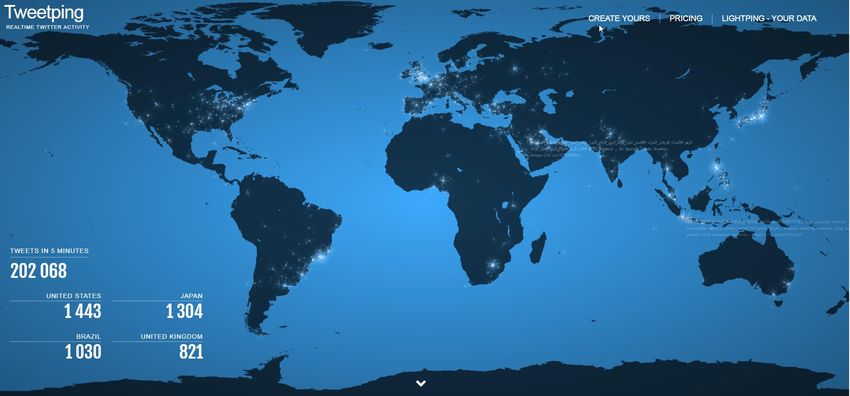
Social Sensing
• The systematic analysis of unsolicited social media data (user
  generated content shared socially via the web) to observe real-world
  events
• Involves event detection, location and characterisation

                                                                         3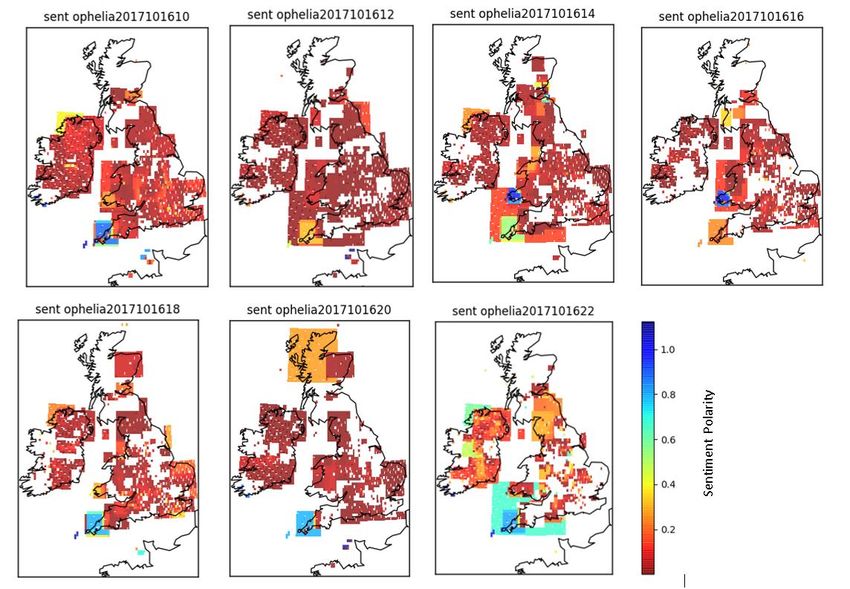
Aim:
• To use ‘Social Sensing’ to map extreme weather events and
  understand the social impacts

Questions:
  • What social impact information can we determine from
    social media?
  • Can we assess the impact severity of an extreme weather
    event using Social Media?

                                                              4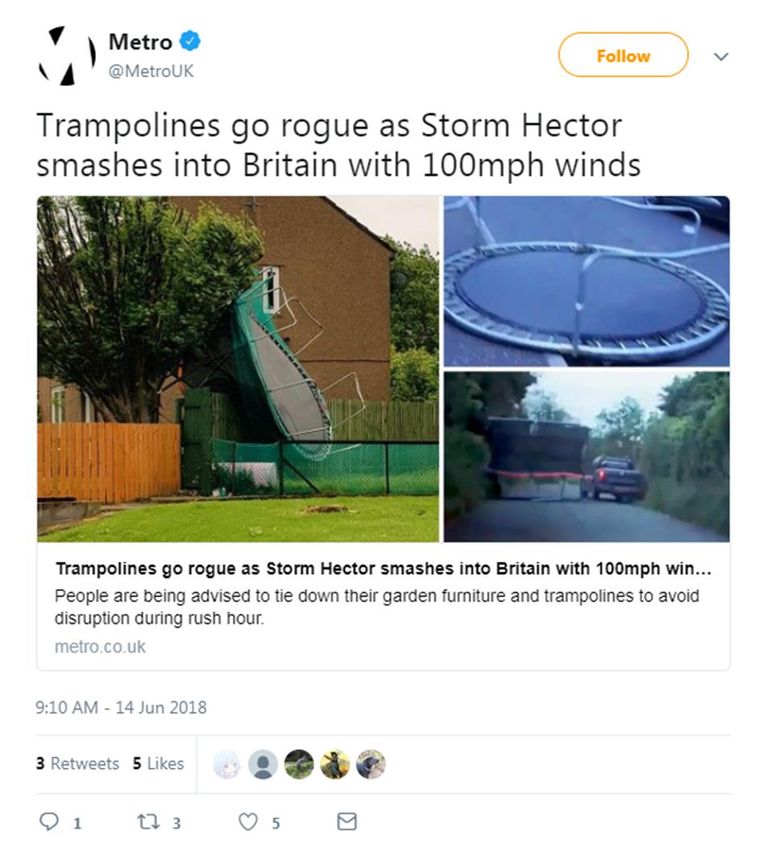
Wildfires
Boulton et al, 2016
                                             Earthquakes
                                             Sakaki et al, 2010

                                            Heatwaves
      Hurricanes      Floods / Heavy Rain
                      Arthur et al, 2018

                                                                  5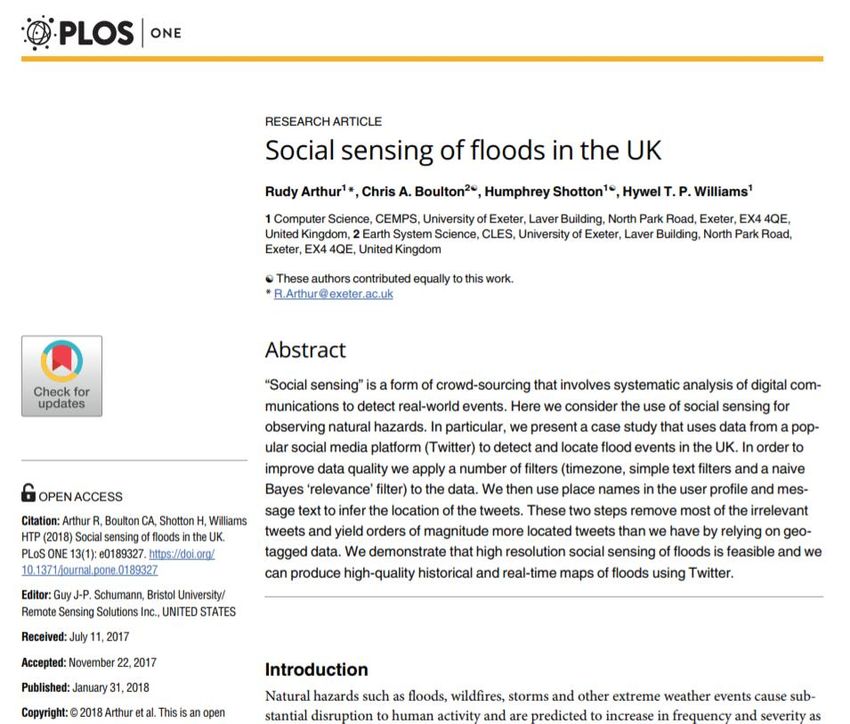
Number of social media users worldwide from 2010 to 2021 (in billions)

https://www.statista.com
                                                                            6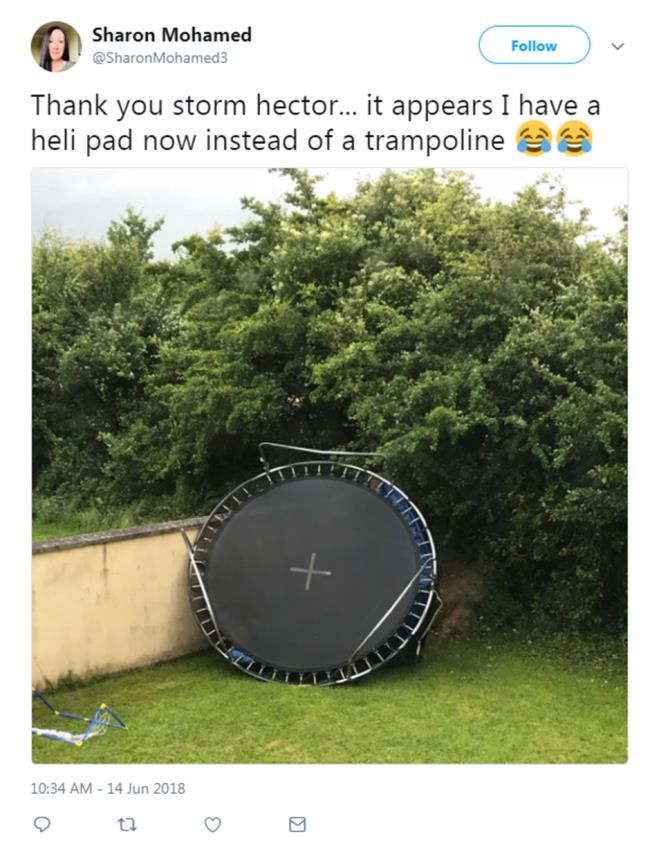
Tue 3rd July 11:30am
British Summer Time (BST)

                            7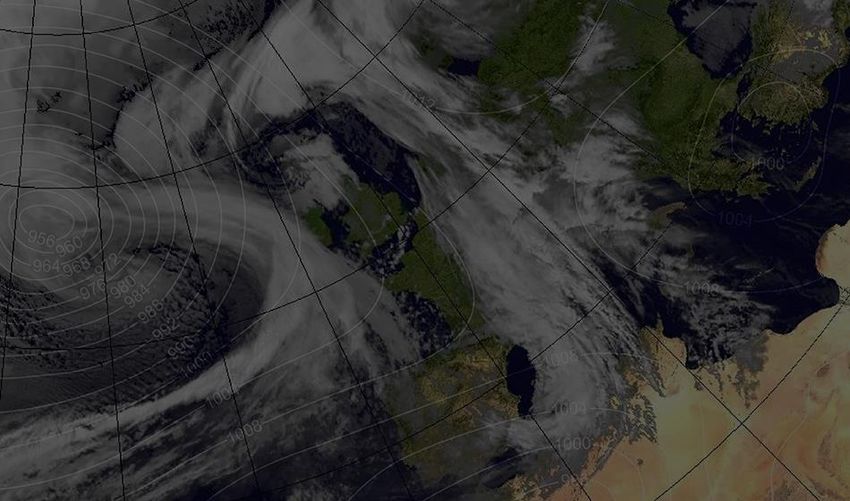
Searching for floods on Twitter…

                                   8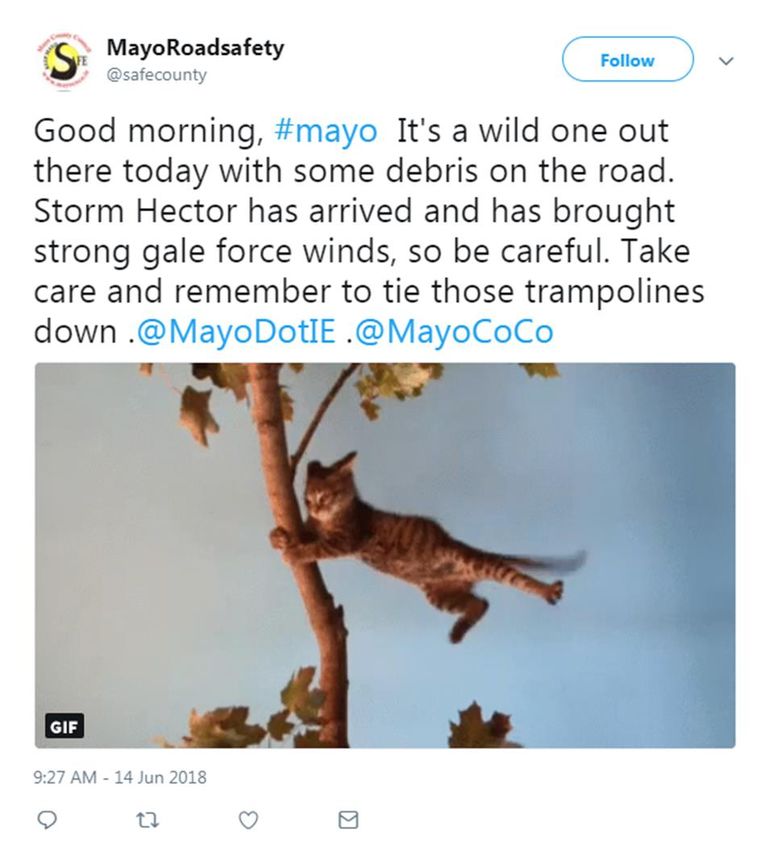
…or for news about Storm Hector…

                                   9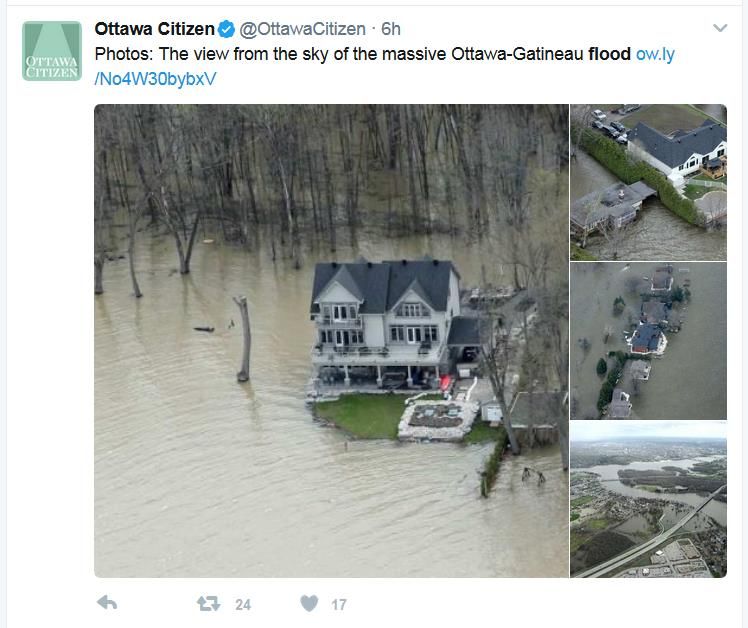
Location

How to locate tweets?
• Only 1% of tweets contain a ‘geotag’ – specific location
  co-ordinates
• Another 1-2% contain a ‘place’ element
• Therefore need to infer location using user location,
  place name mentioned in text or timezone

                                                             10
11
UK Storm Names 2017/18
Name Date named Date of impact on UK and/or
Ireland
Aileen 12 September 2017 12 - 13 September 2017
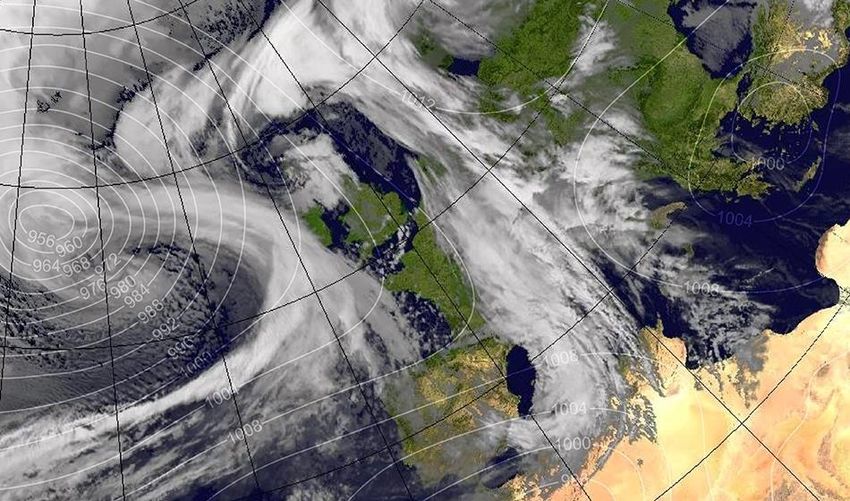
Ex-Hurricane Ophelia 11 October 2017 (Named by NHC) 16 - 17 October 2017
Brian 19 October 2017 21 October 2017
Caroline 5 December 2017 7 December 2017
Dylan 29 December 2017 30 - 31 December 2017
Eleanor 1 January 2018 2 - 3 January 2018
Fionn (F-yunn) 16 January 2018 16 January 2018
David 17 January 2018 (Named by Meteo 18 January 2018
France)
Georgina 23 January 2018 24 January 2018
Hector 13 June 2018 13 - 14 June 2018
https://www.metoffice.gov.uk/barometer/uk-storm-centre
12Collecting Twitter Data (Tweets)
Twitter collections – Using Twitter API1 collect tweets containing natural
hazard/weather related key words – tweets received in JSON format
Storm Name Collection: storm, Ophelia, Ofelia, Opelia, Ohpelia, ophelia, Opehlia, opheliaireland,
Brian, brian, Caroline, caroline, Dylan, dylan, Eleanor, eleanor, Fionn, fionn, Fion, fion, Georgina,
georgina, Emma, emma
Wind Collection: wind, gale, windstorm, hurricane
Extract tweets from collections for a specific time period/keywords
https://developer.twitter.com/content/developer-twitter/en.html
13- Tweets collected 16th October 2017 – 10th March 2018
- Over 35 million individual Tweets collected
14Method – relevance filter
Bot filter Weather station Irrelevant Term Machine learning
• Remove usernames filter filter • Created training
known to be • Remove tweets with • Exclude tweets corpus using 5000
automated ‘Twitter known automated containing terms labelled tweet
bots’ weather station such as: ‘cook up a examples
structure storm’, ‘wind up’, • Apply Naïve Bayes
‘throw caution to the algorithm to remove
wind’, etc) tweets based on
training corpus
1516
17
18
Wind tweets (filtered for relevance)
versus
Named storm tweets (filtered for relevance)

• Peaks in wind tweets coincide with peaks in
  named storm tweets

• Also peaks in wind tweet activity at other
  times to named storm events – are these
  ‘extreme weather events’? Or just windy
  days?

                                                19
Method – Location Inference
• Filter for timezone (UK/Ireland only)
• Locate tweets using Geotag (GPS cords)
• Place (polygon cords)
• User location (GPS cords, if not lookup text with Geonames1 db)
• Place names mentioned in tweet text (dbpedia2 spotlight lookup
identifies placenames – then Geonames lookup to get coords)
1 http://www.geonames.org/
2 https://wiki.dbpedia.org/
20% of Filtered
Tweet Filtered for for
All Tweets Filtered for % of All relevance AND % of All relevance
Collection (unfiltered) relevance Tweets located Tweets Tweets
1. Wind 26,298,449 831,076 3.2% 472,586 1.8% 56.9%
2. All Storm names 8,101901 278412 3.4% 214,220 2.6% 76.9%
ophelia 897,054 214,730 23.9% 167,369 18.7% 77.9%
brian 2,037,045 12,970 0.6% 9,439 0.5% 72.8%
caroline 1,199,149 8,552 0.7% 4,993 0.4% 58.4%
dylan 2,504,264 3,907 0.2% 2,410 0.1% 61.7%
eleanor 555,433 11,872 2.1% 9,761 1.8% 82.2%
fionn 43,936 1,260 2.9% 878 2.0% 69.7%
georgina 104,327 894 0.9% 650 0.6% 72.7%
emma 760,693 24,227 3.2% 18,720 2.5% 77.3%
21Locating Tweets
User Place
Filtered for User location name
Tweet All Tweets relevance Geo co- Place location (resolvable mentioned
Collection (unfiltered) AND located ords co-ords (co-ords) place name) in text
1. Wind 26,298,449 473,740 7,351 1.6% 18,539 3.9% 21,871 4.6% 361,156 76.2% 64,823 13.7%
2. All Storm
names 8,101901 214,220 1349 0.6% 7169 3.3% 933 0.4% 159207 74.3% 45562 21.3%
22Social Impact
Using all filtered tweets:
• Count tweets by date/hour
• Sentiment analysis
• Categorisation (disruption, damage, warnings, news, humour, other)
Using located tweets:
• Map tweet activity (absolute, percentile, sentiment)
• Percentile normalises for variations in population, tweet activity, etc
23Locating tweets during Ex-hurricane Ophelia – 16/10/2017
24Sentiment Analysis
• Can we use social media posts to
infer how a person feels about an
event?
Machine Learning / Natural Language
processing – use tweets as training
data, assign tweet to sentiment
Lexicon based – look up to dictionary
of sentiment words
Paltoglou G., Thelwall M. (2017) Sensing Social Media: A Range of Approaches for Sentiment Analysis. In: Holyst J. (eds) Cyberemotions. Understanding
Complex Systems. Springer, Cham
25Measuring the Sentiment of ‘Ophelia’
26Tracking the Sentiment of ‘Ophelia’
27Categorisation of Tweets
Filtered tweets are manually labelled into categories:
28Tweet Content – Storm Brian
(Example tweet text from each category, not actual Twitter posts)
Humour Disruption
'Brian? What kind of name is that for a storm? “Train delay: National Rail have warned of delays
Everyone knows Brian is a snail.‘ due to high winds from Storm Brian”
'Am I the only one to find it really hard to take a “Storm Brian latest - tree blocks railway lines and
storm called #Brian seriously?‘ hovercraft suspended”
'And Brian? Really? Storm Rambo or Terminator “Major motorway was CLOSED after Storm Brian
would be far better than #StormBrian‘ floods carriageway”
Warnings Damage
'#StormBrian could lead to travel disruption this “This is the scene this morning as the waves have
weekend.’ damaged the Harbour Office during Storm Brian.”
'Storm Brian set to batter UK with heavy rain and “Storm Brian damage causes floodlight damage.
70mph winds.’ Revised home game vs @ChesterCityFC”
‘Take care on the coast folks. Waves are quite “Scaffolding in Helsby High Street BLOWN OVER by
high with #StormBrian’ #StormBrian high winds”
29Next Steps…
• (in progress) Use of Met Office observation / WOW data to
compare ‘Twitter talk’ against observed weather conditions
• (in progress) Apply UK Storm model to extreme weather
events outside of the UK
• Categorisation of tweets over time – how does this change
over the period of the storm?
• Impact terminology – can we categorise the impact of an
event using tweet text?
30Applying model outside the UK
Searching for heavy rainfall and flooding…
Percentile
http://www.wpc.ncep.noaa.gov
Tweets about rain/flooding above the 70th
Rainfall radar for the USA at 7am on 29th April
percentile of these tweets for each grid square
2017
on 29th April 2017
Areas shaded red were most affected by heavy
Blue indicates unusually high number of tweets
rainfall
about rainfall/flooding
31Summary
• Social Sensing allows us to filter the ‘noise’ from Twitter and create a dataset of
social media posts relating to extreme weather events
• 60-80% of tweets can be located using location inference method (as opposed to
only 1% if just use geotag)
• Using percentile of tweets at a given time and place allows us to account for
population size, prevalence of Twitter use, etc
• Sentiment analysis shows us that emotion becomes less positive during the
period of a named storm
• Categorisation is a work in progress, however we find that about a quarter of
tweets fall into the humour category
• Overall social sensing provides a data source which can be used to help in
understanding of the impact of weather events in addition to traditional
methods
32Thank you
Michelle Spruce: m.spruce@exeter.ac.uk
Hywel Williams: h.t.p.williams@exeter.ac.uk
SEDA Lab: http://sites.exeter.ac.uk/seda-lab/
33You can also read