CLIMATE CHANGE DATA AND TRENDS - METRO VANCOUVER CLIMATE 2050
←
→
Page content transcription
If your browser does not render page correctly, please read the page content below
METRO VANCOUVER CLIMATE 2050
                 CLIMATE CHANGE DATA AND TRENDS

Climate Change Data and Trends
Increasing levels of greenhouse gas emissions are warming
our planet and driving climate change. How do scientists
know this? This appendix provides a snapshot of some of
the key data points and observed trends related to global
climate change. References and links are provided to key
sources of information, which provide more in-depth data,
trends, and scientific analysis.

Global Average Temperature
The planet’s average surface temperature has risen about
1.1°C since 1880, based on measurements made on land
and at sea (Figure 1).1 Most of that warming has occurred in
the past 35 years, with polar regions experiencing greater
warming than the more temperate regions.2 Sixteen of the
seventeen warmest years on record have occurred since
2001. Scientific research has shown this change is driven
primarily by increased carbon dioxide and other human-
made greenhouse gas emissions into the atmosphere.3,4
Although the global atmospheric concentrations of
carbon dioxide have varied over the millennia, since the
industrial revolution in the mid-1700s it has increased to
unprecedented levels (Figure 2).5

1   https://climate.nasa.gov/vital-signs/global-temperature/
2   https://www.climate.gov/news-features/understanding-climate/climate-change-global-temperature
3   https://climate.nasa.gov/evidence/
4   http://www.ipcc.ch/pdf/assessment-report/ar5/wg1/WG1AR5_SPM_FINAL.pdf
5   https://climate.nasa.gov/evidence/

                                                                   From Appendix to the Metro Vancouver Climate 2050 Discussion Paper | April 2018   1
Figure 1. Global surface temperature change (land and ocean, compared to 1951-1980 average)
SOURCE: CLIMATE.NASA.GOV
Figure 2. Global atmospheric concentrations of carbon dioxide over the past 400,000 years
(CREDIT: VOSTOK ICE CORE DATA/J.R. PETIT ET AL.; NOAA MAUNA LOA CO2 RECORD.)
2 From Appendix to the Metro Vancouver Climate 2050 Discussion Paper | April 2018Changing Global Climate System
Scientists have projected that increasing global Globally, sea levels have risen at an average rate of 1.8 mm
temperatures would cause a number of significant changes per year from 1961 to 2003 and approximately 20 cm since
to the global climate system. Some of these changes, 1880. Sea levels are expected to rise by an additional 30 to
such as declining global snow and ice cover and rising sea 120 cm by the year 2100.7
levels, are happening gradually as temperatures rise. Other
changes are a consequence of amplified climate instability, Coastal regions face several risks from rising seas. Higher
for example the increasing frequency and intensity of sea levels will flood unprotected low lying areas such as
extreme weather events such as heat waves, heavy islands and coastal river deltas. Wave action combined
precipitation, and storms. Below is a description of three with higher sea levels will make more land vulnerable to
of the expected changes to earth systems caused by rising coastal erosion.8 Moreover, in the next several decades,
global temperatures: sea level rise, decreased snow and ice storm surges and high tides combined with sea level rise
cover, and extreme weather events. will further increase flooding risk. In some coastal areas,
groundwater and/or surface water will be contaminated
SEA-LEVEL RISE with sea water as sea levels rise. This could impact the
water available for irrigation and drinking water.
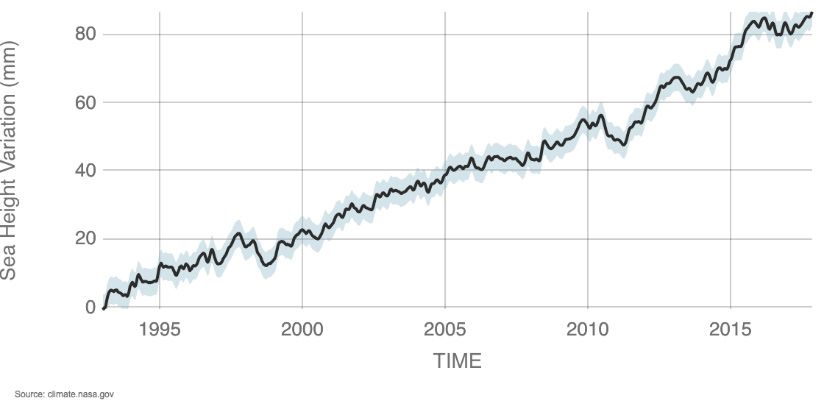
As the climate warms, sea levels are rising worldwide
(Figure 3).6 Higher global temperatures contribute to sea-
level rise in two ways. First, as ocean temperatures increase,
seawater expands and the overall volume of oceans
increases. Second, higher temperatures accelerate the
melting of glaciers and ice caps, also increasing the volume
of the oceans.
Figure 3. Sea Level Rise from 1993 to Present
6 https://climate.nasa.gov/vital-signs/sea-level/
7 https://climate.nasa.gov/evidence/
8 https://www.ipcc.ch/pdf/assessment-report/ar5/wg3/ipcc_wg3_ar5_summary-for-policymakers.pdf
From Appendix to the Metro Vancouver Climate 2050 Discussion Paper | April 2018 3DECREASED SNOWPACK/SNOW COVER
Snow and ice cover helps regulate the climate by reflecting ever.10 Glaciers have been retreating at least since the
incoming solar energy back into space. Over the next 1960s and mountain snow cover has declined on average in
century, water contained in glaciers, ice caps and annual both the Northern and Southern hemispheres.11
snowpack are expected to continue to decline. With less
snow cover and a decrease in the amount of reflected The decline of glaciers and annual snowpack will reduce
sunlight, the ground absorbs four to six times as much freshwater availability in regions supplied by meltwater,
heat. where more than one sixth of the world population
currently lives. Rapid melting snowpack can also lead to
Monitored snowpack levels in western North America are springtime flooding and lower river and reservoir levels in
decreasing, with record lows observed throughout the the late summer. Changes in melting patterns and reduced
United States (Figure 4).9 Since 1955, average snowpack stream flow will also affect hydro-electric power generation
has declined on average by 14 percent including areas that is reliant on the water that is supplied through melting
in California, Oregon, and Washington, with some sites snowpack.
recently experiencing snow-free periods for the first time
Figure 4 North American snow cover compared to 1981-2010 average
SOURCE: RUTGERS UNIVERSITY GLOBAL SNOW LAB12
9 https://climate.rutgers.edu/snowcover/chart_anom.php?ui_set=1&ui_region=namgnld&ui_month=6
10 https://blog.epa.gov/blog/2015/06/the-importance-of-snowpack/
11 http://nsidc.org/cryosphere/sotc/snow_extent.html
12 https://climate.rutgers.edu/snowcover/chart_anom.php?ui_set=1&ui_region=namgnld&ui_month=6
4 From Appendix to the Metro Vancouver Climate 2050 Discussion Paper | April 2018EXTREME WEATHER EVENTS Scientists are studying how the frequency and severity for
Climate change is increasing the frequency and intensity floods will change due to climate change.18 Globally, the
of extreme weather events. Climate-change-related risks amount of damage caused by extreme weather events,
from extreme weather events are already considered including flooding, is increasing dramatically – both from
moderate to high with 1°C of warming and those risks are the number of events and the increasing value of the built
expected to increase as temperatures continue to rise.13 environment.19 In BC, flood risk is exacerbated by sea level
International agencies that are tracking extreme events are rise, particularly during events such as king tides and storm
already observing an increase (Figure 5).14 Scientists are surges.
increasingly able to evaluate the contribution of climate
Climate-related weather extremes and shifting temperature
change to specific extreme events.15
patterns can put stress on ecosystems, disrupt food
Although there has been a slight increase in the frequency production and water supply, damage infrastructure
or duration of droughts over the last 50 years, scientists and urban settlements, lead to loss of life, and have
expect climate change to increase the intensity and consequences for population health.20 These interrelated
duration of droughts to increase after 2050, especially if challenges pose a particular threat to cities with aging
global GHG emissions do not decline.16 17 Less snow and a infrastructure such as water and sewage systems, roads,
lack of moisture in the ground increases the likelihood and bridges, and energy grids. Governments, including
prevalence of wildfires and dry spells. Longer dry spells and municipalities, are spending more on climate change
drought in the summer months also increase wildfire risk. adaptation to protect essential services, with costs rising
from $4 billion globally in 2010 to $25 billion in 2014.21
Figure 5. Reported Extreme Weather-related natural disaster events 1980-201722
DATA SOURCE: EMDAT (2017): OFDA/CRED INTERNATIONAL DISASTER DATABASE
13 http://www.ipcc.ch/pdf/assessment-report/ar5/wg2/ar5_wgII_spm_en.pdf
14 https://ourworldindata.org/natural-catastrophes
15 https://e360.yale.edu/features/pinning-wild-weather-on-climate-change-scientists-are-upping-their-game Yale Environment 360
16 https://rmets.onlinelibrary.wiley.com/doi/pdf/10.1002/joc.3875
17 https://svs.gsfc.nasa.gov/cgi-bin/details.cgi?aid=4270
18 https://www.earth-syst-dynam-discuss.net/esd-2017-59/esd-2017-59.pdf
19 http://www.iisd.org/sites/default/files/publications/adaptation_can_infrastructure.pdf
20 http://www.ipcc.ch/pdf/assessment-report/ar5/wg2/ar5_wgII_spm_en.pdf
21 https://nca2014.globalchange.gov/report/sectors/urban
22 https://ourworldindata.org/natural-catastrophes
From Appendix to the Metro Vancouver Climate 2050 Discussion Paper | April 2018 5You can also read