Researches on increasing the dissolved oxygen concentration in stationary waters - E3S Web of Conferences
←
→
Page content transcription
If your browser does not render page correctly, please read the page content below
E3S Web of Conferences 286, 01001 (2021)                                 https://doi.org/10.1051/e3sconf/202128601001
TE-RE-RD 2021

      Researches on increasing the dissolved oxygen
      concentration in stationary waters
      Marilena Monica Boltinescu (Roza)1, Nicolae Vlad Sima1, Dorina Nicoleta Albu1, Mihaela
      Petroşel (Bănică)1 and Mihaela Constantin1,*
      1
        University Politehnica of Bucharest, Faculty of Mechanical and Mechatronics Engineering, Splaiul
      Independenței, no. 313, Bucharest, Romania

                     Abstract.This paper presents a way to solve the transfer rate equation of
                     oxygen in water. After running a calculation program, the graph of the
                     function that indicates the increase of the dissolved oxygen concentration
                     in the water as a function of time is plotted. Constructed in an original
                     manner, the experimental installation allows the measurement of the
                     increase of the dissolved oxygen concentration in water. The experimental
                     obtained results are compared with the theoretically obtained data.

      1Introduction
          The oxygen quantity that is dissolved in wateris a function depending on salinity, the
      temperature and the pressure [1].
          Hot water has less O2than cold water, salt watercontains less O2than fresh water, and
      lower-pressure waterhas less oxygen than high-pressure water. Recommended
      dissolvedO2degreefor fishes is from 5.0 mg / dm3to 9.0 mg / dm3. In the case that
      thedissolved O2degree is under 3.0 mg / dm3, due to lack of oxygen, the fishes can die. If
      the dissolved oxygen level is over 9.0 mg/dm3, it can also be deadly to fishes.
          Figure 1 shows thatO2 can be:
          - O2 bound to H2
          - free oxygen, namely: oxygen dissolved in water.

      Fig. 1.The O2 molecules dissolved in water.

      *
          Corresponding author: i.mihaelaconstantin@gmail.com

© The Authors, published by EDP Sciences. This is an open access article distributed under the terms of the Creative Commons
Attribution License 4.0 (http://creativecommons.org/licenses/by/4.0/).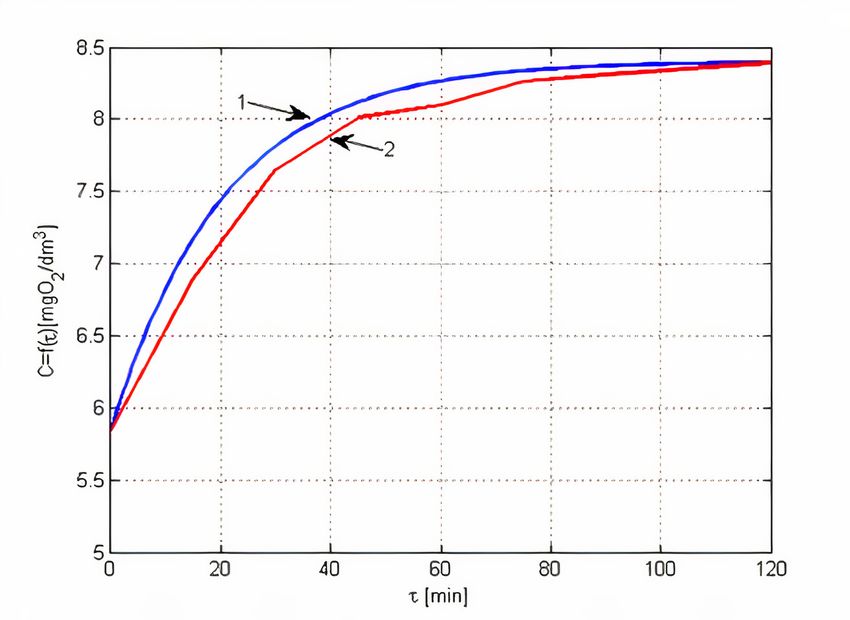
E3S Web of Conferences 286, 01001 (2021) https://doi.org/10.1051/e3sconf/202128601001
TE-RE-RD 2021
The oxygen solubility in wateris a function depending on the atmospheric pressure, the
temperature, water turbulenceandthe magnitude of the air-water area.
Each water type source has its own biological and physicochemical specific featuresand
differ from one area to anotheraccording to the composition of the mineralsin the covered
region, the contact duration, the temperatureand the climatic regime.
The method of oxygenation of water is made on the basis of the transfer between air and
water;from the air, oxygen is transferred through various methods. The air bubbles emitted
by a system that forms it are placed in a water tank. Water oxygenation systems that
generate very fine air bubblesare the most effective. From the literature [2] [3], it is known
that the rate of O2transfer to water is higher as the diameter of the air bubbles decreases; the
diameter of the air bubble depends on the diameter of the orifice in the perforated plate of a
FBG.
The air bubbles can be arranged in as follows (Figure 2):
Fig. 2.Gas bubbles classification infunction of Ø:
I - the region where the air bubblescan be seen under a microscope;
II - the region where the air bubblesare difficult to see;
III - the region where the air bubblescan be seen with the naked eye.
Theperformance of awater oxygenation system is specified by the following two
parameters[4][5]:
- the water oxygenation efficiency;
- the water oxygenation efficiency.
Themethodof aeration (oxygenation) of water is a fundamental field of Technical
Thermodynamics, a discipline materialized by teaching the following courses: Mass and
heat transfer, Gas Dynamics, Technical Thermodynamics.
2 Solving the oxygen transfer rate equation
In water oxygenationmethod, the temperature influences both the oxygen conditions, the
dissolved O2saturation concentration and the mass transfer coefficient. The saturation
concentration values are directly influenced by the water temperature [6].
The dissolved O2transfer rate in waterdepending on the temperature is given by the
relation [7]:
dC
a k L 200 Cs C [ kg / m3 s ] (1)
d
where:
- akL–the transfer coefficient of the oxygen [s-1];
- Cs –the mass oxygen concentration at saturation[kg / m3];
- C –the current mass concentrationof the O2[kg / m3].
After integrating relation 1 applying the limit condition C = C0 for τ = 0, it results [6],
[7]:
2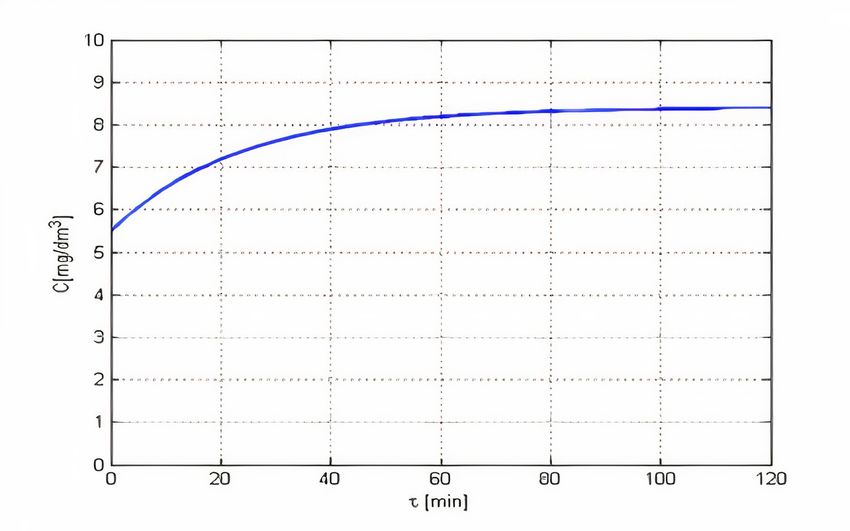
E3S Web of Conferences 286, 01001 (2021) https://doi.org/10.1051/e3sconf/202128601001
TE-RE-RD 2021
dC
a k L dτ (2)
Cs C
In the hypothesis that C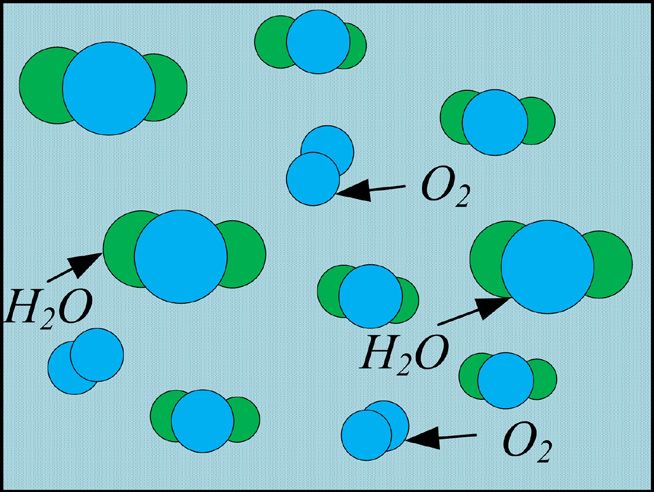
E3S Web of Conferences 286, 01001 (2021) https://doi.org/10.1051/e3sconf/202128601001
TE-RE-RD 2021
Fig. 4. The variationof thedissolved O2concentration.
The main data that are maintained in the case of experimental researches are:
- the air flowrate: V = 600 dm3/h; the inlet air pressure in the fine bubble generator: p =
573 mmH2O; hydrostatic load: H = 500 mmH2O; duration of the experience: τ = 120 min;
C0 = 5.84 mg / dm3; tH2O = 23.7⁰C → Cs = 9.02 mg / dm3.
3 The presentation of the experimental installation
In figure 5 one can see the sketch of the experimental installationfor measuring
theconcentration of the dissolved O2in water, in time.
Fig. 5.Scheme of the experimental stand for researches related to water oxygenation
1 - electrocompressor with air reservoir; 2 - pressure reducer; 3 - pressure gauge; 4 - connection
for evacuating air outside; 5 –T-bend; 6 - flowmeter; 7 - electrical instrument panel; 8 - gauge board;
9 - piping for transporting compressed air to the fine bubble generator; 10 - water tank;11 -
machineryof actuation of the probe; 12 - oxygenometer probe;13 - fine bubble generator with orifices
Ø 0.1mm; 14 - installation support; 15 - indicator: a - main inlet,b-interruptor, c - pilot cell, 16 -
digital pressure gauge; 17 - oxygenometer 18 - digital thermometer.
4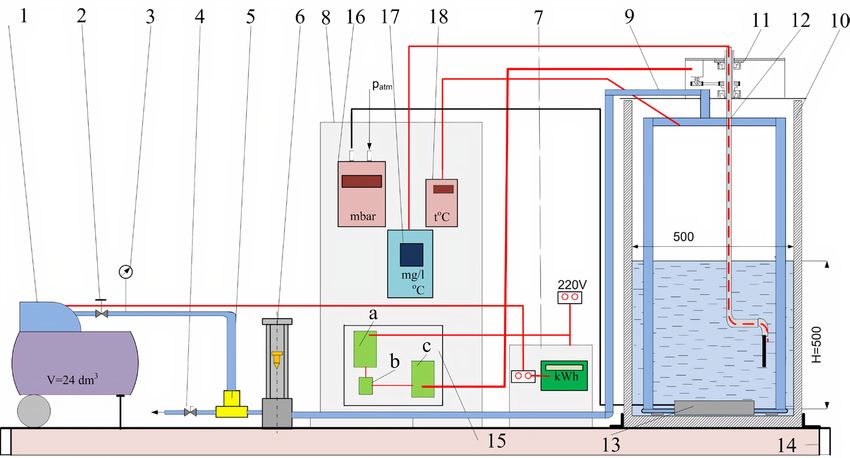
E3S Web of Conferences 286, 01001 (2021) https://doi.org/10.1051/e3sconf/202128601001
TE-RE-RD 2021
The air compressed by the electrocompressor (1), traversethe flowmeter (6) and
subsequently goes inthe FBG (13).
During the experiment, the following were measured: air flow rate, air pressure and the
concentration of the dissolved oxygen in water.
The experimental installation (figure 5)comprises a series of devices mounted on the
panel (8):
- digital thermometer withhigh accuracy, with thermistor sensor;
- differential pressure gauge, supplied with a piezoresistive transducer;
-oxygenometer with polarographic probe and microprocessor with digital board.
The electromechanical machineryfor actuating the oxygenometer probe (11), (12), is
supplied with a pecker motor; this machineryadmitsthe cycle of the oxygenometer probe in
the water mass, with a speed of 0.38 m /s [10][11].
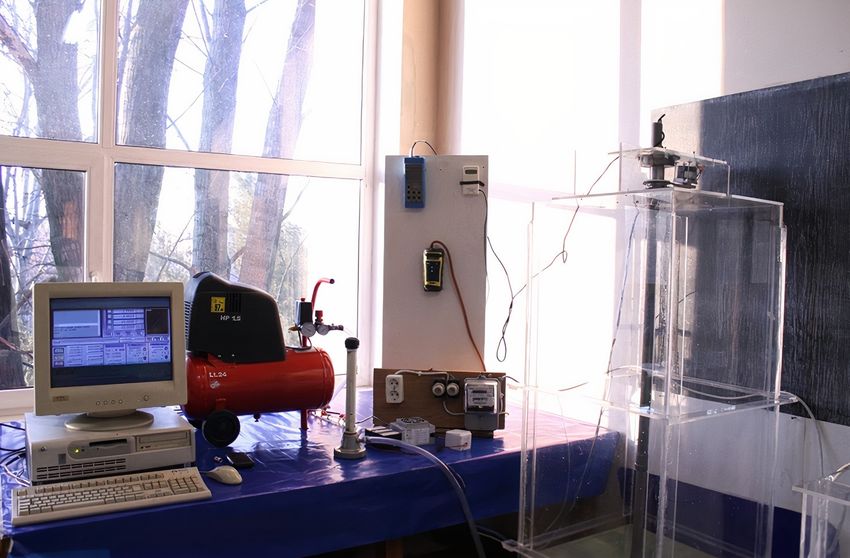
Figure 6 shows an overview of the experimental stand, designed and constructed in
theLaboratory of the Department of Thermotechnics, Engines, Thermal and Refrigeration
Equipment’s.
Fig.6. Overview of the experimental standfor studying the increase of the dissolved O 2concentration.
One can observe that on the leftwards of the image (figure 6), there is a computer that
controls the actuation machineryof the oxygenometer probe; next to the computer is an
electro-compressor with a compressed air tank and the devices panel. To the right of the
image, is the water tank, made of clear plexiglass.
4 Experimental researches, obtained results
The steps to be followed in experimental researches are the following:
1. Introduce compressed air into the fine bubble generator and observe if the 152
orifices with Ø 0.1mm are not blocked;
2. The tank is filled with water (H = 500 mmH2O) and measure tH2O, C0, tair;
3. The FBG (fine bubble generator)is introduced in water and the time at which the
experienceis measured;
5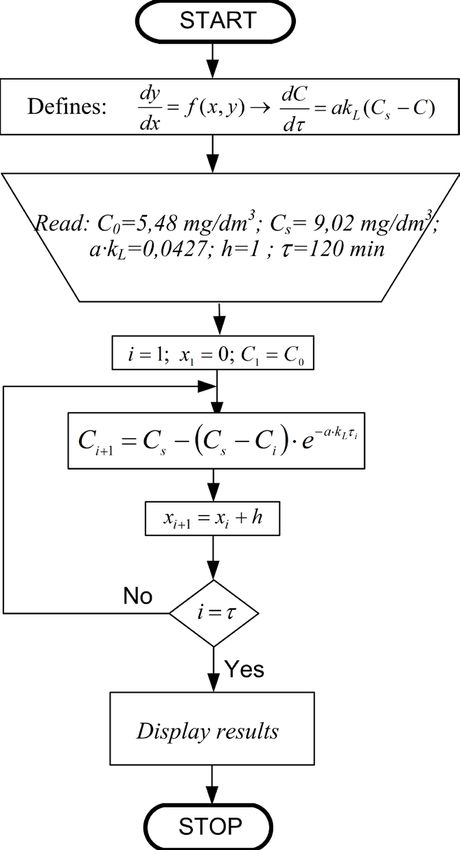
E3S Web of Conferences 286, 01001 (2021) https://doi.org/10.1051/e3sconf/202128601001
TE-RE-RD 2021
4. Introduce compressed air into the FBG and after 15 minutes pull out the FBG from
the tank and insert the oxygenometer probe. This operation is performed every 15 minutes,
until τ = 120 minutes is reached;
5. From previous researches [12][13][14], it was found that after a time of τ = 120
minutes, the value of C0 tends to Cs;
6. Finally, clean the oxygenometer probe and drain the water.
Following the measurements, the data in table 1 were obtained.
Table 1. The values of dissolved O2concentration in water,in time.
min 0 15 30 45 60 75 90 105 120
Vair [ dm 3 /h ] 600 600 600 600 600 600 600 600 600
VIO,2 126 [ dm 3 /h ] 126 126 126 126 126 126 126 126 126
VO2 from other 0 0 0 0 0 0 0 0 0
sources
t H 2 O o C 23.7 23.7 23.7 23.7 23.7 23.7 23.7 23.7 23.7
tair o C 24.1 24.1 24.1 24.1 24.1 24.1 24.1 24.1 24.1
C0 mg / dm3 5.84 5.84 5.84 5.84 5.84 5.84 5.84 5.84 5.84
Cs mg / dm3 8.4 8.4 8.4 8.4 8.4 8.4 8.4 8.4 8.4
C mg / dm3 5.84 6.89 7.65 8.01 8.10 8.26 8.31 8.35 8.39
In conformity with the data in table 1, the curveform figure 7 was drawn.
Fig. 7. The C = f (τ)function.
From figure 7, one can observe that, with the passage of time the value of C0 tends to
Cs.
Figure 8 compares the modification of the dissolved O2 concentration in water in the
two cases:
6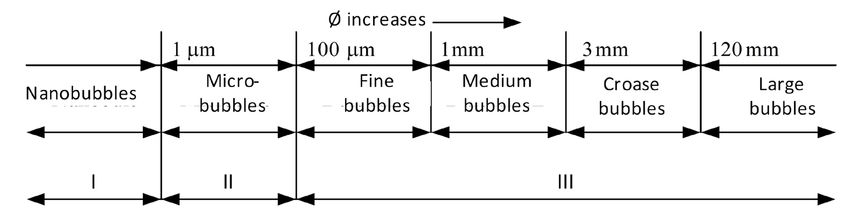
E3S Web of Conferences 286, 01001 (2021)                         https://doi.org/10.1051/e3sconf/202128601001
TE-RE-RD 2021

          1- graph plottedaccording to the theoretical data;
          2- graph plottedaccording to theexperimental data.

     Fig. 8.The modification of the dissolved O2concentration.

        Figure 8 shows a good coincidence of the two graphs, which demonstrates the accuracy
     and rigor of theoretical and experimental researches.

     5Conclusions
         1. In the paper, the differential equation of the oxygen transfer rate in waterwas solved,
     by numerical integration.
         2. A computation program was performed and the curve C = f(τ) was drawn; the
     theoretical results are similar to those obtained in other papers on the field of study.
         3. The paper presents an original installation, designed and built-intosee the change in
     the dissolved O2concentration in water.
         4. Experimental researches has demonstrated the accuracy of theoretical calculations;
     for the graphs C = f (τ), the difference between theoretical and experimental values is small.

     References
     1.   I.M.Călușaru, The influence of the physical properties of the liquid on the efficiency of
          the oxygenation processes, PhD thesis, University Politehnica of Bucharest, Faculty of
          Mechanical and Mechatronic Engineering (2014).
     2.   T.Miyahara, Y.Matsuha, T. Tekahashi, The size of bubbles generated from perforated
          plates, International Chemical Engineering, 23,517-523 (1983).
     3.   R. Mlisan (Cusma), Influence of the bubble generators architecture on the
          concentration growth of dissolved oxygen into the water, PhD thesis, University
          Politehnica of Bucharest, Faculty of Mechanical and Mechatronic Engineering (2017).

                                                       7
E3S Web of Conferences 286, 01001 (2021) https://doi.org/10.1051/e3sconf/202128601001
TE-RE-RD 2021
4. Al. S. Pătulea, The influence of the function al parameters and of the architecture of the
fine bubble generators on the efficiency of the aeration installations, PhD thesis,
University Politehnica of Bucharest, Faculty of Mechanical and Mechatronic
Engineering (2012).
5. Gh.Băran, I.Pinacovschi, F.Bunea, Performance of fine bubble generators, (in
Romanian), Hidrotehnica Magazine,53, no.3-4, 27-32 (2008).
6. A.Halanay, R.Gologan, D.Timotiu, Elements of mathematical analysis, (in Romanian),
MATRIX ROM Publishing House, Bucharest (2008).
7. G.Reckeenwald, Numerical Integration of Ordinary Differential Equation for Initial
Value Problems, Portland State University Department of Mechanical Engineering,
(2006).
8. H.M.Antia, Numerical Methods for Scientist andEngineers,Birkhauser
Publishing,Limited Basel, Switzerland (2002).
9. D.Houcque, R.McCormick, Application of MATLAB: Ordinary Differential Equation
(ODE), School of Engineering and Applied Science Northwestern University,
Illinois(2007).
10. I.M.Călușaru, N.Băran, Al. Pătulea, Researches regarding the transfer of oxygen in
water, the 3rd International Conference on Mechanic Automation and Control
Engineering (MACE 2012), IEEE Computer Society CPS, indexed by Ei Compendex,
Baotou, China, 2617 – 2620 (2012).
11. Al. Pătulea, N.Băran and I.M.Călușaru, Measurements of DissolvedOxygen
Concentration in Stationary Water, World Environment 2, no 4,106-109 (2012).
12. M.Călușaru (Constantin), E.B. Tănase, N.Băran,R. Mlisan (Cusma), Researches
Regarding the Modification of Dissolved Oxygen Concentration in Water, IJISET-
International Journal of Innovative Science, Engineering & Technology B, no. 6,228 –
231 (2014).
13. N.Băran, Gh. Băran, G. Mateescu, D. Besnea, Experimental Research Regarding a
New Type of Fine Bubble Generator, Proceedings of the International Conference,
MECHAHITECH’09 Bucharest (2009).
14. Al. Pătulea, I.M.Călușaru, N.Băran, Researches Regarding the Measurements of the
Dissolved Concentration in Water, Advanced Materials Research,550-553,3388-3394
(2012).
8You can also read