Mercury Minimization Plan 2015 - Clean Water Services
←
→
Page content transcription
If your browser does not render page correctly, please read the page content below
Mercury Minimization Plan
2015
This page intentionally blank.

Mercury Minimization Plan
Table of Contents
1.0   Background ...................................................................................................................................... 3
      1.1         Clean Water Services .......................................................................................................... 3
      1.2         Watershed-based NPDES Permit ........................................................................................ 4
2.0   Identification/Evaluation of Sources of Mercury............................................................................. 4
      2.1         Mercury in the Environment............................................................................................... 4
      2.2         Mercury Sources and Relative Contribution ....................................................................... 5
      2.3         Sources of Mercury in Wastewater .................................................................................... 5
3.0   Identification of Methylation Conditions......................................................................................... 6
      3.1         Methylation in the Natural Environment ........................................................................... 6
      3.2         Methylation Potential in Wastewater Collection and Treatment Systems ........................ 7
                  3.2.1 Wastewater Collection System .................................................................................. 7
                  3.2.2 Wastewater Treatment Facilities ............................................................................... 7
4.0   Current Strategies for Control of Mercury..................................................................................... 10
      4.1         Industrial Pretreatment Program ..................................................................................... 10
      4.2         Pollution Prevention ......................................................................................................... 13
                  4.2.1 Silver Recovery Program .......................................................................................... 13
                  4.2.2 Ecological Business (EcoBiz) Certification Program ................................................. 13
                  4.2.3 Dental Amalgam Inspection Program ...................................................................... 13
                  4.2.4 Additional Efforts ..................................................................................................... 14
      4.3         Program Effectiveness ...................................................................................................... 15
5.0   Strategies for Controlling Mercury for Permit Renewal ................................................................ 17
      5.1         Current Strategies ............................................................................................................. 17
      5.2         Proposed Additions........................................................................................................... 18
6.0   Monitoring Plan ............................................................................................................................. 20
7.0   References ..................................................................................................................................... 21
8.0   Appendices..................................................................................................................................... 22
      Appendix A: Ecological Business Certification Program ‐ Automotive Services ............................ 23
      Appendix B: Eco‐Certification Programs ‐ Promote Use of Environmentally Certified Products... 26
      Appendix C: Eco-Certification Programs - Use Environmentally Certified Products ..................... 28
      Appendix D: Environmental Standards for Electronic Devices (EPEAT)......................................... 30
      Appendix E: Promote Household Hazardous Waste Collection and Recycling in Oregon............. 34

                                                                                                                                                       1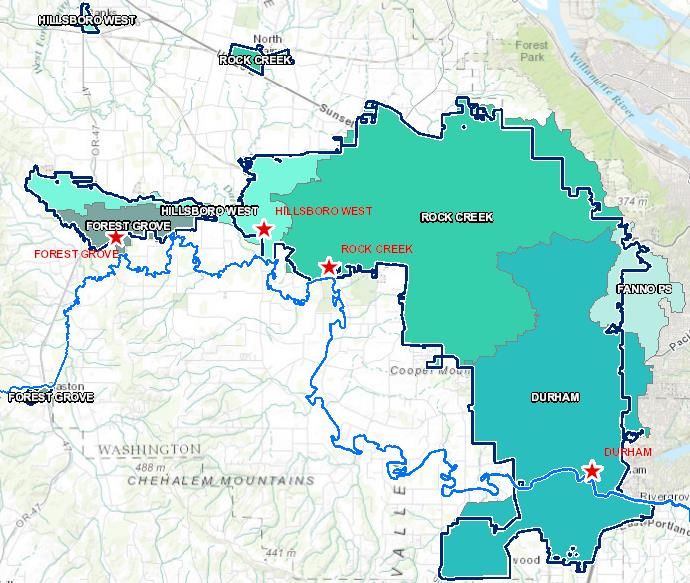
Appendix F: Promote Existing Product Stewardship Programs ..................................................... 37
Appendix G: School Outreach ........................................................................................................ 40
Appendix H: Dental Office Inspections .......................................................................................... 44
Appendix I: Mercury Audit Checklist for POTWs ........................................................................... 47
Appendix J: Educational Brochure for Dental Inspections............................................................. 49
Appendix K: Commercial and Residential Mercury Brochure....................................................... 51

                                                                                                                                     2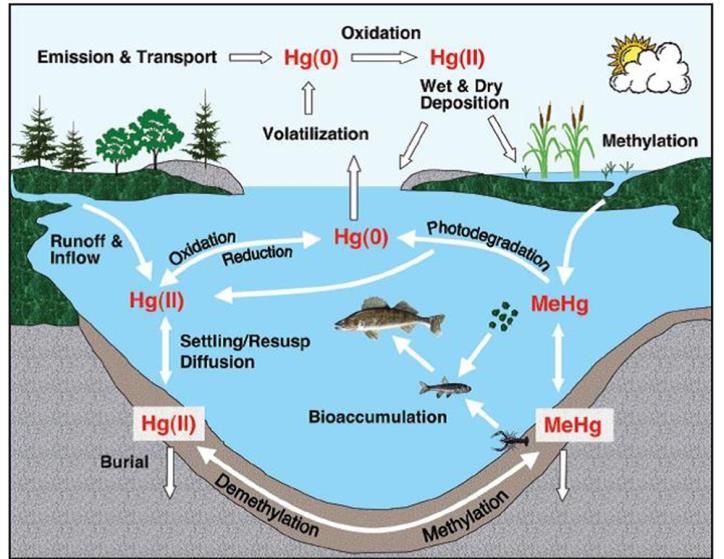
Mercury Minimization Plan
1.0     Background
1.1     Clean Water Services
Clean Water Services (District) is a County service district that serves more than 550,000 customers in
the urban portion of Washington County. The District has 12 member cities and owns and operates four
wastewater treatment facilities (WWTFs) in the Tualatin River watershed at sites in Forest Grove,
Hillsboro, and Tigard (Figure 1). The District’s four WWTFs are the Forest Grove WWTF, the Hillsboro
WWTF, the Rock Creek Advanced Wastewater Treatment Facility (AWTF), and the Durham AWTF. Rock
Creek and Durham are referred to as AWTFs because they provide a more advanced degree of
treatment (e.g., nutrient removal and filtration) than Forest Grove and Hillsboro. The District’s four
WWTFs discharge to the Tualatin River and are permitted under the watershed-based National Pollutant
Discharge Elimination System (NPDES) permit.

The District implements the Municipal Separate Storm Sewer System (MS4) program within the
Washington County urban area (Figure 1) in cooperation with its co-implementers (Washington County,
and the cities of Banks, Beaverton, Cornelius, Durham, Forest Grove, Gaston, Hillsboro, King City, North
Plains, Sherwood, Tigard, and Tualatin).

        Figure 1: Location of Clean Water Services’ treatment facilities & service area

                                                                                                       3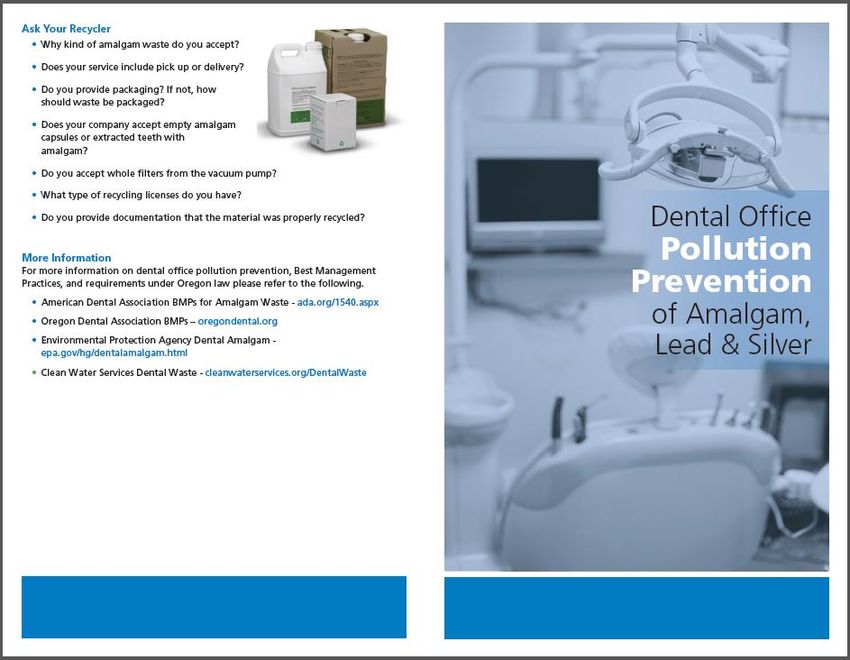
1.2 Watershed-based NPDES Permit
The District’s watershed-based NPDES permit was issued by Oregon Department of Environmental
Quality (DEQ) in February 2004. The watershed-based NPDES permit integrated the MS4 requirements
with the District’s wastewater treatment NPDES discharge permits in the watershed. The District
submitted an application for renewal of the watershed-based NPDES permit in August 2008 (six months
prior to expiration) and continues to operate under the terms and conditions of the 2004 watershed-
based NPDES permit until DEQ takes action on the permit renewal application. DEQ anticipates
renewing the District’s watershed-based NPDES permit in 2015. DEQ has included a requirement to
develop and implement a mercury minimization plan in recently issued NPDES permits for other
municipal facilities. DEQ has indicated that the District’s watershed-based NPDES permit will also
include a requirement to develop and implement a mercury minimization plan upon renewal. Rather
than wait until after permit issuance to develop the plan, the District has developed its mercury
minimization plan prior to permit issuance so that it can undergo public review along with the draft
watershed-based NPDES permit and other supporting documents.
DEQ requires that a mercury minimization plan contain the following elements:
Identification and evaluation of sources of mercury
Identification and evaluation of conditions that might contribute to methylation in collection
and treatment systems
Identification of industrial, commercial, and residential sources of mercury
Monitoring plan to confirm current and potential sources of mercury
Identification of methods for reducing or eliminating mercury
Ongoing monitoring of effluent to assess effectiveness
This document addresses the aforementioned elements and constitutes the District’s mercury
minimization plan.
2.0 Identification and Evaluation of Sources of Mercury
2.1 Mercury in the Environment
Mercury is a naturally occurring element found
in cinnabar deposits and areas of geothermal
activity. In Oregon, mercury was mined
commercially and used extensively in gold and
silver amalgamation. Mercury has been used
historically in fungicide formulations and can
still be found in many commercial products
including fluorescent lights, thermometers,
automobile switches and dental amalgam.
Mercury is also naturally present in trees and
fossil fuels such as coal, natural gas, diesel fuel
and heating oil. The mercury present in these
fuel sources is released into the atmosphere
upon combustion. This atmospheric mercury
can be transported great distances and is Figure 2: Mercury cycle
known to be deposited on the landscape via
either wet or dry deposition (DEQ, 2006).
4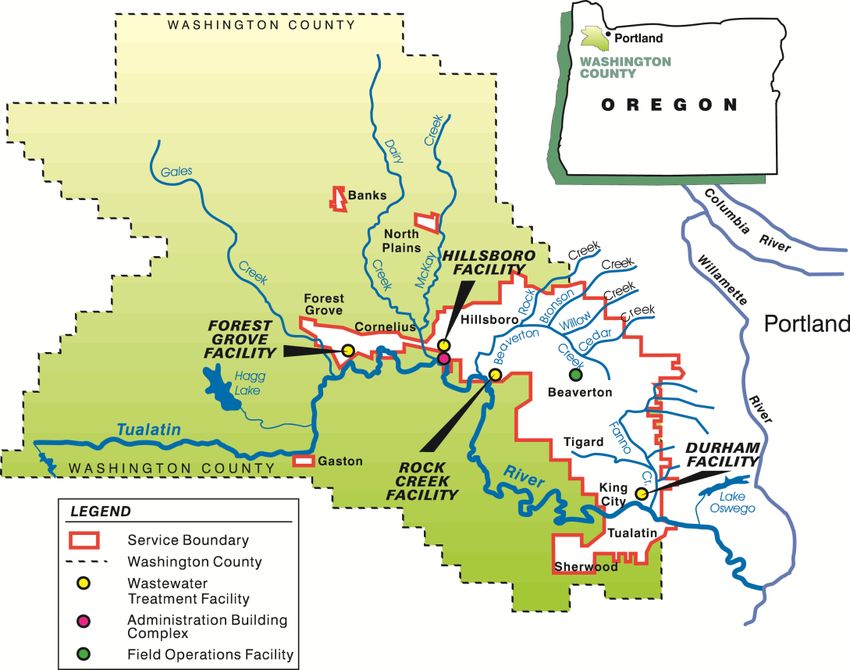
Mercury can be present in various physical and chemical forms in the environment (Figure 2). The
majority of the mercury found in the environment is in the form of inorganic or elemental mercury, but
these forms of mercury can be converted to organic or methyl mercury by sulfate-reducing bacteria.
Methyl mercury production is affected by a host of physical and chemical factors including temperature,
redox potential, dissolved oxygen levels, organic carbon, sediment particle size, alkalinity, sulfate
concentration and pH. Methyl mercury, once formed, represents the most bioaccumulative form of
mercury in fish tissue and the most toxic form of mercury for human consumers (DEQ, 2006).
Accordingly, DEQ has adopted fish tissue criteria for methyl mercury to protect human health.

2.2     Mercury Sources and Relative Contribution
A watershed-scale analysis of
mercury sources was conducted for
the Willamette Basin Mercury Total
Maximum Daily Load (TMDL). The
relative mercury load contribution
by source category is presented in
Figure 3. Municipal wastewater
treatment facilities (specified as
domestic effluents in Figure 3) were
estimated to contribute 2.7% of the
mercury load to the Willamette
River system.

The Willamette Basin Mercury
TMDL includes sector specific,            Figure 3: Relative mercury load contribution for the mainstem Willamette
interim wasteload allocations for                   River system
mercury rather than wasteload
allocations for individual point sources. This decision was based on the significant uncertainty that
exists concerning mercury's behavior in the environment, the precise contribution from individual point
sources (adding or contributing to the standards violation), and the effectiveness of potential
implementation activities. Given these factors, Oregon DEQ saw no benefit in developing wasteload
allocations at a level of detail finer than the sector-wide allocations presented in this TMDL or to
develop individual numeric NPDES permit limits, at this point in time. Point sources within a sector were
required to develop mercury minimization plans and to monitor their effluent to better characterize
their contribution of mercury and the effectiveness of management measures. The implementation of
best management practices (BMPs) should allow point sources to meet the overall allocation for the
specific sector. The effectiveness of the minimization/monitoring plan approach is to be evaluated over
time as part of an adaptive management framework (DEQ, 2006).

Oregon DEQ’s approach for addressing mercury issues for municipal wastewater treatment facilities is
consistent with the findings and methodology outlined in the Willamette Basin Mercury TMDL.

2.3     Sources of Mercury in Wastewater
Anthropogenic sources of mercury in wastewater can come from the residential, commercial, or
industrial sectors. In a 2002 study, the Association of Metropolitan Sewerage Agencies (AMSA now
known as National Association of Clean Water Agencies (NACWA)) listed the most common sources of
mercury pollution, which can be seen in Table 1 below (AMSA, 2002).

                                                                                                                5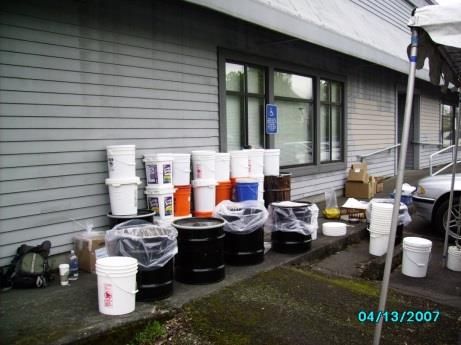
Table 1: Common Sources of Mercury in Wastewater (NACWA, 2002)

   Commercial                             Residential                          Industrial
      •   Dental offices                    •   Human waste (amalgam)          •   Chlorine Production
      •   Hospitals                         •   Human waste                    •   Portland Cement
      •   Laboratories                      •   (dietary)                      •   Mining – i.e., gold mining
      •   Universities/schools              •   Laundry graywater              •   Caustic Soda
      •   Medical clinics                   •   Household products             •   Sulfuric Acid
      •   Vehicle service facilities        •   Improper disposal of mercury
      •   Industrial activities                 thermometers

Mercury is present in a variety of consumer and commercial products including dental amalgam,
batteries, compact fluorescent lights, jewelry, skin creams, paint, thermometers, switches/relays, etc.
While many of these products have a low probability of reaching the sanitary sewer system in large
quantities, their removal from the environment is still beneficial.
AMSA’s report concluded that:
       The largest source of mercury in wastewater influent is discharges from dental offices. The
       next largest sources are domestic sources (human waste, household products, and laundry
       graywater) and hospitals. Of the domestic sources, human waste is considered
       uncontrollable and laundry graywater is considered very difficult to effectively control.

Additionally, a 2008 EPA report estimated that 50% of the nation’s mercury in wastewater comes from
the dental sector (USEPA, 2008). Supporting documentation for the EPA’s Proposed Effluent Limitation
Guidelines and Standards for the Dental Category (released October, 2014) uses 2007 Census data and
estimates that there were roughly 110,000 dental offices that place and/or remove dental amalgam in
the United States. The EPA estimates that 4.4 tons of mercury waste from these dental offices is
discharged to WWTFs annually (USEPA, 2014).

3.0       Identification of Methylation Conditions
3.1       Methylation in the Natural Environment
As mentioned previously, the methylation of mercury poses a significant environmental threat.
Methylation of mercury occurs mainly under anaerobic conditions and is greatly affected by the
availability of inorganic mercury, pH, organic matter concentration, microbial activity, redox potential,
sulfate concentration and temperature. The methylation of mercury is seasonally/temperature-
dependent, with methyl mercury levels likely to increase in summer and fall and decrease in winter and
spring (DEQ, 2013).

In natural ecosystems, the methylation of mercury occurs through one of the following pathways:
    • Biological activity by various species of microorganisms, mainly bacteria
    • Chemical reactions in soils or water that may occur through contact with organic matter and
        humic substances
    • Photochemical processes (DEQ, 2013)

Mercury methylation is generally thought to be facilitated by sulfate-reducing bacteria, which thrive in
organic-rich, anaerobic sediments of many aquatic systems (e.g., wetland soils, lake sediments).
Accordingly, it is widely recognized that wetlands, especially those rich in organic matter and receiving
appreciable atmospheric mercury inputs, may be important sites of methyl mercury production.

                                                                                                                6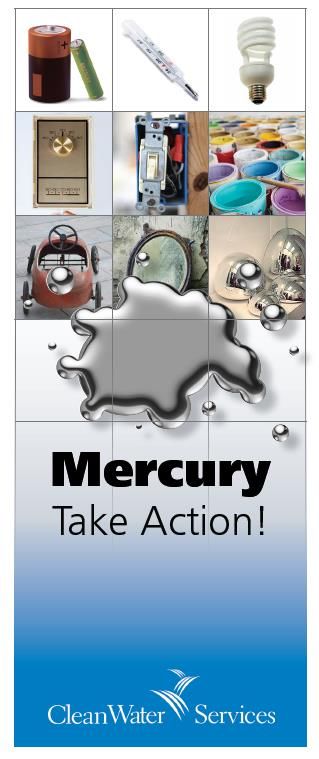
However, recent monitoring in California has shown that not all wetlands are sources of methyl mercury
and that some wetlands can act as sinks or are neutral in regard to methyl mercury production,
emphasizing the point that site specific characteristics and water quality do influence the methylation of
mercury in the environment (DEQ, 2013).

3.2     Methylation Potential in Wastewater Collection and Treatment Systems
3.2.1 Wastewater Collection System
The District’s wastewater collection system consists of more than 800 miles of sanitary sewer collection
lines. Where possible, gravity is used to convey wastewater to one of the District’s four WWTFs.
District field operations and maintenance crews periodically perform several maintenance activities on
the sanitary collection system that help decrease organic matter and sediment buildup within the
system that could facilitate the methylation of mercury. These activities include line cleaning and repair,
manhole maintenance, root control, and TV inspection. The District also operates a capital
improvement program to replace and rehabilitate existing sanitary sewer lines.

In addition to the sanitary collection system, the District operates and maintains 41 pump stations. In
order to prevent sediment buildup in the District’s pump stations, District staff routinely clean the
pipelines and pump down the wet wells to stir up and flush out any sediment that may have settled
there. The force mains at each pump station are also designed to ensure that pump cycles reach
adequate velocities (3.5-8 ft./sec) during normal operation to scour sediment from the line. The
District’s maintenance activities decrease organic matter and sediment build up within the collection
system that could facilitate the methylation of mercury.

3.2.2 Wastewater Treatment Facilities
The Durham AWTF and the Rock Creek AWTF are state-of-the-art facilities that serve Washington
County residents. The Durham facility primarily serves residents in Beaverton, Durham, King City,
Sherwood, Tigard, Tualatin, and small portions of southwest Portland and Lake Oswego, while the Rock
Creek facility primarily serves residents in Hillsboro, portions of Beaverton, Aloha, and unincorporated
Washington County (Figure 4). Both facilities provide tertiary treatment that consists of preliminary
screening, primary treatment, activated sludge secondary treatment with nutrient removal, disinfection,
and filtration before the treated water is discharged to the Tualatin River or used for local irrigation.

Both the Durham and Rock Creek AWTFs employ advanced treatment technologies that include
biological phosphorus removal and ammonia removal via nitrification. Additionally, at both AWTFs,
natural by-products of the treatment process are converted to electricity and heat, as well as
commercial-grade fertilizer and soil amendments that are used at local sites and throughout the state.
In 2009, the first commercial nutrient recovery facility in the nation was built at the Durham AWTF, and
in 2012 a nutrient recovery facility was built at the Rock Creek AWTF. The nutrient recovery facilities
capture 80% of the phosphorus from the wastewater stream and convert it into a premium, slow-
release fertilizer that is used on turfs and nurseries throughout the northwest and elsewhere.

                                                                                                           7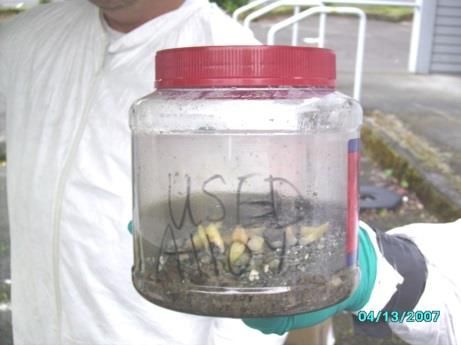
Figure 4: Map of WWTFs and their service areas

The Forest Grove WWTF provides wastewater treatment for Forest Grove, Gaston, and Cornelius. The
Hillsboro WWTF provides wastewater treatment for the western portion of Hillsboro, North Plains, and
Banks; the Hillsboro WWTF also serves the southeastern portion of Cornelius, and the northwestern
portion of Forest Grove (Figure 4). Both the Forest Grove and Hillsboro WWTFs provide secondary
treatment using an activated sludge process followed by ultraviolet disinfection.

The Rock Creek, Hillsboro and Forest Grove facilities are connected by twin, 24-inch pipelines.
Currently, the Forest Grove and Hillsboro WWTFs operate seasonally. Wastewater from the service area
is treated at the Hillsboro and Forest Grove WWTFs and discharged to the Tualatin River during the wet
season; during the dry season, wastewater from the service area is conveyed to the Rock Creek AWTF
for treatment and discharge.

The District operates modern, state-of-the-art treatment facilities. Studies have shown that modern
advanced wastewater treatment plants incorporating activated sludge processes are able to significantly
reduce the amount of total mercury from wastewater. Some of the sludge thickening and anaerobic
digestion processes have the capacity to cause the methylation of mercury, but this is typically offset by
the demethylation that occurs during the sludge removal and aeration processes. According to a study
at the San Jose/Santa Clara Water Pollution Control Plant, “although anoxic conditions are present
during some process steps of secondary treatment, the conditions were not sufficient to promote
methylation of mercury.” (SJ/SC, 2007, DEQ, 2013)

                                                                                                         8
The District conducts routine monitoring of the influent and effluent at all four of its WWTFs for “total”
mercury. Table 2 shows the average mercury removal efficiencies at the District’s WWTFs from 2005-
2013.
Table 2: Average Influent and Effluent Total Mercury Concentrations
and Removal Efficiencies at the District’s WWTFs
WWTF Influent (ug/L) Effluent (ug/L) Removal
Durham AWTF 0.139 0.0017 99%
Rock Creek AWTF 0.095 0.0020 98%
Forest Grove WWTF 0.085 0.0027 97%
Hillsboro WWTF 0.184 0.0034 98%
The District’s WWTFs are highly effective at removing mercury from wastewater. Average removal
efficiencies for mercury at all four WWTFs are greater than 97%.
Under Senate Bill 737 (SB 737) passed by the 2007 Oregon Legislature, the largest treatment plants in
Oregon (over 1 MGD) screened their effluent for Priority Persistent Pollutants. As part of this
collaborative study with DEQ, methyl mercury was monitored twice at Rock Creek and Durham AWTFs
and once at Forest Grove and Hillsboro WWTFs. Monitoring was conducted in 2010 during the dry
(August) and wet (November) seasons. The data from these monitoring efforts are presented in the
table below:
Table 3: Methyl Mercury Data from Senate Bill 737 Monitoring
WWTF Method August 2010 November 2010 Plan Initiation
Reporting Limit Level
Durham AWTFmercury) occurs in the Plant. The study found that concentrations were reduced nearly 99% for total
mercury and 97% for methyl mercury. There was no evidence of a net production of methyl mercury
across the Plant (SJ/SC, 2007).
4.0 Current Strategies for Control of Mercury
The District employs a variety of strategies to control mercury. These strategies include the
implementation of an industrial pretreatment program and pollution prevention programs as described
below.
4.1 Industrial Pretreatment Program
In addition to wastewater from residential and commercial sources, municipal wastewater treatment
facilities also receive wastewater from industrial users. The General Pretreatment Regulations (40 CFR
403) establish the responsibilities of federal, state, and local governments, as well as industries to
implement pretreatment standards to control pollutants from industrial sources which may interfere
with or pass through, affect worker health and safety, or contaminate biosolids at publicly owned
treatment works (POTWs). EPA has developed pretreatment standards for several industrial categories
that are designed to ensure industrial users implement technology‐based controls to limit the
introduction of pollutants to the municipal wastewater treatment facility. Additionally, local
governments are required to evaluate the need for “local limits” to meet the goals and objectives in the
General Pretreatment Regulations.
The District’s industrial pretreatment program regulates all significant industrial users (SIU), which
include categorical industrial users (CIUs) that are subject to technology-based pretreatment standards
as defined in 40 CFR 403. The industrial pretreatment program consists of identifying, permitting, and
monitoring SIUs that discharge to the sanitary sewer system. The District has developed local limits to
protect worker health and safety, ensure industrial discharges do not interfere with the biological
processes at its WWTFs, allow for beneficial use of biosolids, and protect water quality in the Tualatin
River. Local limits have been developed for several pollutants, including mercury.
The District implements technology-based pretreatment standards as well as local limits through
pretreatment permits that are issued to all SIUs in the service area. The pretreatment permits require
industrial users to periodically monitor their wastewater and report results to the District. The District
also implements their own, independent monitoring program to verify these results.
As part of its industrial pretreatment program, the District requires all non-domestic users applying for a
plumbing permit to complete a sewer use information card. The District reviews these cards and
conducts investigations (i.e. phone calls, web searches, and if necessary inspections) to evaluate
potential impacts to sanitary sewer system. Based on the results of the investigation, the District may
require the submittal of an industrial wastewater discharge application, which contains information
regarding production, water usage, chemical usage, pretreatment system, and disposal method. The
District uses this approach to screen industrial discharges in its service area, assess discharge
characteristics, and where appropriate, ensure implementation of appropriate management controls.
DEQ’s methyl mercury criteria implementation document specifies that the following industrial
processes use or generate mercury (DEQ, 2013):
Chlorine production (Chlor-alkali)
Portland cement
Mining – i.e., gold mining
Caustic soda production
10 Sulfuric acid production
Emissions treatment (wet-pack scrubbers)
Municipal waste combustors
Hospital, medical and infectious waste incinerators
There are no industrial users within the District’s service area that utilize the industrial processes noted
above. Table 4 presents the District’s current list of SIUs, their standard industrial classification (SIC)
code, the categorical pretreatment standards (if applicable), and the operational description.
As part of the monitoring under the industrial pretreatment program, the District conducted mercury
monitoring for SIUs. Based on the monitoring data, the District estimated that the overall mercury
contribution from SIUs is minimal (about 1% of the total mercury load to the WWTFs).
The District also regulates non-significant industrial users (NSUs) under a local control program.
Examples of industries covered under this program include the following:
Food processors with less than 25,000 gallons per day process wastewater
Metal fabricators or machine shops without surface finishing operations
Concrete products manufacturers and ready-mix batch plants
Electronic circuit board assembly
Beverage processors including dairies, breweries and soft drink operations with less than 25,000
gallons per day process wastewater
Testing laboratories, either analytical or product
Chemical re-packagers, and container recycling activities
Any discharger required to implement effective control of the outgoing pH of their discharged
wastewater
Additionally, the District issues best management practice (BMP) -based permits under a local control
program. Examples of industries regulated under BMP-based permits include the following:
Vehicle and equipment washing and maintenance activities
Electronic equipment testing (no manufacturing activities)
Industrial gas repackaging and vessel hydro-testing
Warehousing operations
Transfer and recycling operations
Small-scale food or beverage processors, who, after review, require no pH control of their
wastewater discharge
The District identifies, inspects, permits, and monitors these facilities on a regular basis. Permittees are
issued 5 year permits and are typically inspected on an annual basis.
11Table 4: List of Significant and Categorical Industrial Users Permitted by the District
Organization Name SIC Code SIC Title Category Permit Type Operation Description
Fujimi Corporation 3291 ABRASIVE PRODUCTS - SIU Manufacture of abrasive and polishes
TOK America 2899 CHEMICALS AND CHEMICAL PREPARATIONS, NOT ELSEWHERE CLASSIFIED - SIU Chemical Blending
Meta Fab Inc 3479 COATING, ENGRAVING, AND ALLIED SERVICES, NOT ELSEWHERE CLASSIFIED 40 CFR 433.17 CIU Sheet metal fabrication
Anodizing of aluminum parts, screen printing on aluminum parts, media blasting of
Pioneer Metal Finishing 3479 COATING, ENGRAVING, AND ALLIED SERVICES, NOT ELSEWHERE CLASSIFIED 40 CFR 433.17 CIU
aluminum parts
Quantum Global Technology, LLC-dba
3479 COATING, ENGRAVING, AND ALLIED SERVICES, NOT ELSEWHERE CLASSIFIED 40 CFR 433.17 CIU Etch and clean metal and quartz parts for use in the semiconductor industry
Quantum Cleaning
Sheldon Manufacturing Inc 3479 COATING, ENGRAVING, AND ALLIED SERVICES, NOT ELSEWHERE CLASSIFIED 40 CFR 433.17 CIU Metal Fabrication with iron phosphating & painting as final finish
Lotus Applied Technology 8731 COMMERCIAL PHYSICAL AND BIOLOGICAL RESEARCH 40 CFR 433.17 CIU Reseach and Development support for high tech industry
Forest Dental Products, Inc. 3843 DENTAL EQUIPMENT AND SUPPLIES 40 CFR 433.17 CIU Dental Equipment Manufacturing
JAE Oregon Inc 3678 ELECTRONIC CONNECTORS 40 CFR 433.17 CIU Electric Connector Manufacturing
Cal Weld 3471 ELECTROPLATING, PLATING, POLISHING, ANODIZING, AND COLORING 40 CFR 433.17 CIU Electropolish stainless steel parts using a mixture of phosphoric and sulfuric acid
Davis Tool, Inc. 3471 ELECTROPLATING, PLATING, POLISHING, ANODIZING, AND COLORING 40 CFR 433.17 CIU Metals & plastics finishing
PPD-Pioneer Metal Finishing 3471 ELECTROPLATING, PLATING, POLISHING, ANODIZING, AND COLORING 40 CFR 433.17 CIU Metal Finisher
Pacific Foods Of Oregon 2099 FOOD PREPARATIONS, NOT ELSEWHERE CLASSIFIED - SIU Aseptic food processing and packaging plant
Pacific Nutritional Foods 2099 FOOD PREPARATIONS, NOT ELSEWHERE CLASSIFIED - SIU Manufacture Tofu, beverages (Soy, Almond, Tea)
Resers Fine Foods - Jenkins Rd Facility 2099 FOOD PREPARATIONS, NOT ELSEWHERE CLASSIFIED - SIU Processor of raw vegetables and other ingredients into refrigerated salads and desserts
Seals Unlimited Inc. 3053 GASKETS, PACKING, AND SEALING DEVICES 40 CFR 428.56 (a) CIU Rubber seal manufacturing
Prudential Overall Supply dba Prudential
7218 INDUSTRIAL LAUNDERERS - SIU Industrial laundry specializing in the cleaning of cleanroom garments
Cleanroom Services
Summit Natural Energy Corp. 2869 INDUSTRIAL ORGANIC CHEMICALS, NOT ELSEWHERE CLASSIFIED 40 CFR 414, Subpart F CIU Mfg of ethanol fuel for vehicles from food processing wastewater
Cascade Microtech Inc - Gemini 3825 INSTRUMENTS FOR MEASURING AND TESTING OF ELECTRICITY AND ELECTRIC 40 CFR 433.17 CIU Mfr Pyramid Probes
Metal Etching of Electronic Parts and ancillary Chrome Finishing and Groundwater
Tektronix Inc - Jenkins Rd 3829 MEASURING AND CONTROLLING DEVICES, NOT ELSEWHERE CLASSIFIED 40 CFR 433.17 CIU
remediation
Parks Metal Products, Inc. 3469 METAL STAMPINGS, NOT ELSEWHERE CLASSIFIED 40 CFR 433.17 CIU Metal Finishing
Northwest Rubber Extruders Inc 3061 MOLDED, EXTRUDED, AND LATHE-CUT MECHANICAL RUBBER GOODS 40 CFR 428.56 (a) CIU manufacture custom elastomeric products
Anthro Corporation 2522 OFFICE FURNITURE, EXCEPT WOOD 40 CFR 433.17 CIU Electrostatic powder coating of tubular and sheet metal office furniture components
Leupold & Stevens 3827 OPTICAL INSTRUMENTS AND LENSES 40 CFR 433.17 CIU Manufacture of sporting goods optical equipment
ACUMED, LLC. 3842 ORTHOPEDIC, PROSTHETIC, AND SURGICAL APPLIANCES AND SUPPLIES 40 CFR 433.17 CIU Manufacture orthopedic surgical implants
Genentech HFF 2834 PHARMACEUTICAL PREPARATIONS 40 CFR 439, Sub B & D CIU Processing (Fill & Finish) of vials containing pharmaceuticals drugs
Parks Circuit Board Inc 3672 PRINTED CIRCUIT BOARDS 40 CFR 433.17 CIU Printed wiring board
Viasystems Technologies Corp. 3672 PRINTED CIRCUIT BOARDS 40 CFR 433.17 CIU Circuit Board Manufacturing
Westak of Oregon Inc 3672 PRINTED CIRCUIT BOARDS 40 CFR 433.17 CIU Circuit Board Manufacturing
Hillsboro Landfill Inc 4953 REFUSE SYSTEMS 40 CFR 445.3 CIU Construction landfill
Oregon Health Sciences University West
8299 SCHOOLS AND EDUCATIONAL SERVICES, NOT ELSEWHERE CLASSIFIED - SIU Animal Research
Campus ONPRC
Intel Corporation - Aloha Campus 3674 SEMICONDUCTORS AND RELATED DEVICES 40 CFR 469.16/ 469.18 CIU Integrated circuit (semiconductor) manufacturing
Intel Corporation - Ronler Acres Campus 3674 SEMICONDUCTORS AND RELATED DEVICES 40 CFR 469.18 CIU Integrated circuit (semiconductor) manufacturing
Jireh Semiconductor, Inc. 3674 SEMICONDUCTORS AND RELATED DEVICES 40 CFR 469.18 CIU Semiconductor Manufacturing
Maxim Integrated Products 3674 SEMICONDUCTORS AND RELATED DEVICES 40 CFR 433.17/ 469.18 CIU Manufacture of semiconductor packages
SolarWorld Industries America Inc. 3674 SEMICONDUCTORS AND RELATED DEVICES 40 CFR 469.18/ 469.28 CIU Manufacturing of single crystal ingots from polysilicon
Sumitomo Electric Semiconductor
3674 SEMICONDUCTORS AND RELATED DEVICES 40 CFR 469.28 CIU Grind polish, clean and package GaAs wafers
Materials, Inc
Cleaning, coating, plating gold, nickel, chromium, copper onto gallium arsenide wafer.
Triquint Semiconductor 3674 SEMICONDUCTORS AND RELATED DEVICES 40 CFR 433.17/469.18 CIU
Then mounting, sawing & grinding the wafers in into integrated circuits.
Lam Research Corp 3559 SPECIAL INDUSTRY MACHINERY, NOT ELSEWHERE CLASSIFIED 40 CFR 433.17 CIU Wafer fabrication systems
Maxim Integrated Products - Hillsboro 8734 TESTING LABORATORIES 40 CFR 433.17 CIU Finished semiconductors are deconstructed for failure analysis
124.2 Pollution Prevention
The District is a primary member of the Pollution Prevention Outreach Team, embracing a broad, multimedia
perspective in the metropolitan area. The District’s Pollution Prevention program has focused on three main
areas: silver recovery, EcoBiz, and dental mercury reduction. Each of these focus areas is described below.
4.2.1 Silver Recovery Program
Silver was a pollutant of concern at the District’s treatment facilities. In the 1990s and early 2000s, the District
developed management practices for photo processors that required silver recovery. As part of this program,
inspections of photo-processing facilities were conducted to verify the implementation of these management
practices. Silver recovery became the standard of practice for photo processing facilities. While the formal
inspection program ended in 2004, the District has continued to monitor silver at its WWTFs and in the collection
system. This has enabled the District to continue to assess silver loading to its WWTFs and address potential
new sources of silver entering the District’s conveyance system. This program provides an effective model for a
pollution prevention strategy for mercury.
4.2.2 Ecological Business (EcoBiz) Certification Program
The most active outreach program is the Ecological Business (EcoBiz)
Certification Program for the automobile services and landscape business
sectors. Additional information about EcoBiz is available through the
website (www.ecobiz.org). EcoBiz provides technical assistance to auto
shops and landscapers; the program recognizes facilities that go beyond the
regulatory requirements to reduce air, water and solid waste discharges, and
implement water and energy conservation measures. See Appendix A for
Association of Clean Water Agencies’ (ACWA) Pollution Prevention (P2)
template for the EcoBiz Program.
Figure 5: Ecological Business 4.2.3 Dental Amalgam Inspection Program
Certification Program As previously noted, EPA and AMSA studies have found that the largest source of
mercury in wastewater is discharges from dental offices. The most effective method of
reducing mercury from dental offices is the use of amalgam separators. In the early 2000s, the District
developed voluntary BMPs for dentists in conjunction with an ongoing partnership with the Oregon Dental
Association (ODA). The voluntary
program included educational
efforts along with sponsored
mercury collection events (Figure 6).
In 2003, this program was adopted
across the state by a work group
comprised of members from DEQ,
ODA, and the ACWA. Ultimately, the
State of Oregon adopted a statute
Figure 6: Photos from ODA/ACWA mercury collection event (2007) requiring dentists to install and
properly maintain amalgam
separators as well as follow the developed BMPs (ORS 679.520); the statute took effect in 2011.
13In 2013, the District began the dental amalgam inspection program for all the
dentists in its service area. The program consisted of inspecting 220 dental
offices to ensure compliance with BMPs and amalgam separator
installation/maintenance. The inspection program confirmed that all dental
offices required to have a separator had installed one. The inspection program
also evaluated disposal practices for amalgam, silver and lead waste, separator
maintenance, and use of non-oxidizing line cleaner. The District estimates that
the installation of amalgam separators and the implementation of BMPs have
resulted in a 99% reduction in the amount of mercury waste influent from
dental offices that reaches the sanitary sewer; this equates to 19 lbs. of
mercury on an annual basis.
The District continued the dental amalgam inspection program in 2014, with
almost 250 field inspections of dental offices. The compliance rate for
amalgam separator installation continued to be 100%. The District focused on Figure 7: Cover of educational
providing technical assistance regarding the use of BMPs and the disposal of brochure given at dental
scrap amalgam. See Appendix H for the ACWA P2 template and Appendix J for inspections
an educational brochure on dental office inspections.
Through annual surveys, the District will continue to verify that existing dental offices are in compliance with
dental amalgam program requirements. New dental offices will be inspected to ensure that they meet the
requirements of dental amalgam program.
4.2.4 Additional Efforts
In addition to its leadership role in developing the management practices for dental offices, the District has
undertaken additional actions to collect and recycle mercury, and to promote mercury reduction activities. The
following is a brief summary of these actions:
The District, along with other ACWA members, has staffed and funded mercury collection events at the
Oregon Dental Association’s annual conference. From 2004-2010, about 550 pounds of elemental
mercury and 2,400 pounds of amalgam and traps/filters were collected and recycled.
The District has collected and recycled mercury products (including pump switches, lamps and other
mercury-containing products) at its WWTFs.
As part of the EcoBiz program, the District has promoted the collection and recycling of mercury trunk
switches. (Appendix A)
In 2002, the District participated in a DEQ 319 grant with ACWA to develop educational materials to
remove mercury from schools.
As part of SB 737, the District, along with other ACWA members, developed guidance for pollution
prevention programs for Priority Persistent Pollutants, including mercury. (See Appendices for P2
templates).
144.3 Program Effectiveness
The District conducts monitoring of influent, effluent, and biosolids at each of its four WWTFs. Figure 8, Figure 9,
and Figure 10 present the results of the monitoring program at the District’s WWTFs from 1994 to 2013.
Figure 8 shows the influent mercury concentrations at each of the District’s four WWTFs from 1994 to 2013.
Durham Influent Mercury Concentration Rock Creek Influent Mercury Concentration
3.0
4
Mercury Concentration (ug/L)
Mercury Concentration (ug/L)
2.5
3
2.0
2 1.5
1.0
1
0.5
0 0.0
1/1/1995 1/1/2000 1/1/2005 1/1/2010 1/1/2015 1/1/1995 1/1/2000 1/1/2005 1/1/2010 1/1/2015
Date Date
(a) (b)
Forest Grove Influent Mercury Concentration Hillsboro Influent Mercury Concentration
4
2.0
Mercury Concentration (ug/L)
Mercury Concentration (ug/L)
3
1.5
2
1.0
1 0.5
0 0.0
1/1/1995 1/1/2000 1/1/2005 1/1/2010 1/1/2015 1/1/1995 1/1/2000 1/1/2005 1/1/2010 1/1/2015
Date Date
(c) (d)
Figure 8: Daily Influent mercury concentrations detected at (a) Durham AWTF, (b) Rock Creek AWTF, (c) Forest Grove WWTF, and (d)
Hillsboro WWTF from 1994 to 2014; red lines represent non-detect data
15Influent mercury concentrations at all four of the District’s WWTFs, as shown in Figure 9 below, have decreased
significantly from 1994 to 2013.
Figure 9: Mean plant influent mercury concentrations for the four WWTFs
The reduction in loading to the WWTFs can also be observed by evaluating the mercury concentrations in the
biosolids. Figure 10 presents the mercury concentrations in biosolids at the Durham and Rock Creek AWTFs from
1994 to 2013. Note that solids are not processed at the Forest Grove and Hillsboro WWTFs; solids from these
two facilities are transferred to the Rock Creek AWTF for processing.
Durham Biosolids Mercury Concentration Rock Creek Biosolids Mercury Concentration
8 8
Biosolids Mercury Concentration (mg/kg)
Biosolids Mercury Concentration (mg/kg)
7 7
6 6
5 5
4 4
3 3
2 2
1 1
0 0
1/1/1995 1/1/2000 1/1/2005 1/1/2010 1/1/2015 1/1/1995 1/1/2000 1/1/2005 1/1/2010 1/1/2015
Date Date
(a) (a)
Figure 10: Mercury concentrations detected in biosolids at (a) Durham AWTF and (b) Rock Creek AWTF from 1994 to 2013; the LOWESS
smoothing function is represented by the blue line
Between 1994 and 2013, both the Durham and Rock Creek AWTFs have shown substantial reductions in mercury
levels in biosolids. The influent and biosolids data at the District’s WWTFs provide strong evidence that mercury
loadings to the treatment facilities have been reduced significantly, and the reductions have continued in the
recent past.
16Figure 11 presents the average effluent mercury concentration at each of the District’s four WWTFs from 1994 to
2013.
Average Effluent Mercury Concentration
160 3.4
ng/L
Effluent Mercury Concentration
140 1.7
ng/L
120 2.7
ng/L
100
(ng/L)
1994-2000
80 2.0
ng/L 2005-2013
60
40
20
0
Durham Rock Creek Forest Grove Hillsboro
Figure 11: Average effluent mercury concentration observed at each of the District’s
four WWTFs
Effluent mercury concentrations at all four WWTFs have also decreased substantially from 1994 -2000 compared
to 2005-2013. While some of this apparent reduction may be an artifact of improved analytical methods with
more sensitive reporting limits, the District’s strategies have been demonstrably effective at reducing effluent
mercury levels.
5.0 Strategies for Controlling Mercury for Permit Renewal
The District plans to continue implementation of its current strategies to control mercury discharges to the
environment. The District is also proposing to enhance its public education and outreach program to focus on
mercury and is proposing additional strategies to control mercury. The District’s current strategies and proposed
strategies that would be implemented during the next permit cycle for controlling mercury are outlined in Table
5.
5.1 Current Strategies
The District will continue to implement the industrial pretreatment program as described in Section 4. Through
the industrial pretreatment program’s survey process discussed in section 4.2, the District evaluates all new
industrial discharges in its service area to assess discharge characteristics and where appropriate, to ensure
implementation of appropriate management controls.
The District will also continue to implement the EcoBiz pollution prevention program. The District is making
some modifications to the dental amalgam program based on the results of the inspections conducted in 2013
and 2014. The District’s field inspection program verified that all dentists required to have an amalgam
separator have installed one. In the future, the District will utilize annual surveys rather than conducting field
inspections of existing dental offices to verify continued compliance. New dental offices will be inspected to
ensure that they meet the requirements of dental amalgam program.
There may be changes to the District’s industrial pretreatment program as a result of EPA’s Proposed Effluent
Limitation Guidelines and Standards for the Dental Category (released October, 2014). Once finalized, and if
17necessary, the District will revise its industrial pretreatment and pollution prevention programs to reflect EPA’s
final action.
5.2 Proposed Additions
The District will undertake several additional actions to continue its mercury reduction activities.
During the next permit cycle (Est. 2016-2021), the District will conduct an inventory of our treatment
plants, collection systems and internal operations, including the laboratory, checking for and replacing
mercury-containing equipment and chemicals, utilizing the ACWA P2 template (Appendix I). While these
mercury containing products may not be in direct contact with wastewater, there is potential for the
mercury in these products to enter the waste stream.
Education and Outreach
o Commercial and residential sources
General outreach materials about how to reduce
mercury discharges to the environment have been
developed for commercial and residential sectors.
Getting mercury out of homes and businesses may
prevent it from entering the sanitary sewer by preventing
spills and improper disposal. Outreach materials will be
available on the District’s website
(www.cleanwaterservices.org) and distributed through
mail inserts, community events, and/or on-site
inspections (Appendix K).
The District will inform commercial and residential
customers about the hazardous waste collection services
that Metro and DEQ provide (Appendix E).
o Laboratories, schools, and healthcare facilities
The District will provide targeted pollution prevention
outreach materials regarding mercury best management
practices to laboratories, schools and healthcare facilities
within the service district.
Based on this outreach, the District will develop a follow-
up strategy for these sectors, potentially utilizing ACWA’s
P2 template (Appendix G).
Additionally, the District will promote programs such as Eco-certification
use (Appendix C), EPEAT (Appendix D), and product stewardship
programs (Appendix F) through the District’s website Figure 12: Mercury outreach
(www.cleanwaterservices.org). brochure
18Table 5: Strategies for Controlling Mercury
Sector Activity Timeline
Pretreatment Program (identify, permit, monitor, and inspect SIUs, develop local limits) On-going
Industry Year 1 and 2 of Next Permit Cycle
Conduct one-time monitoring of all current SIUs (low-level mercury)
(Est. 2016 - 2018)
Survey all dental facilities (existing and new facilities) On-going
Dental Identify and inspect all new dental facilities On-going
Recycle mercury-containing equipment On-going
CWS Facilities Conduct inventory of CWS facilities, replacing mercury-containing equipment and chemicals Next Permit Cycle (Est. 2016 - 2021)
Review and identify opportunities for mercury reduction Next Permit Cycle (Est. 2016 - 2021)
Schools Implement targeted outreach program Next Permit Cycle (Est. 2016 - 2021)
Implement targeted outreach program Next Permit Cycle (Est. 2016 - 2021)
Healthcare
Partner with nonprofit healthcare groups Next Permit Cycle (Est. 2016 - 2021)
Laboratories Implement targeted outreach program Next Permit Cycle (Est. 2016 - 2021)
Promote auto switch recycling through the EcoBiz Program On-going
Distribute educational mercury brochures On-going
Commercial and Residential CWS website, mercury information, links On-going
Promote household hazardous waste collection events Next Permit Cycle (Est. 2016 - 2021)
Promote certification and product stewardship programs Next Permit Cycle (Est. 2016 - 2021)
196.0 Monitoring Plan
The District’s monitoring schedule is shown in Table 6. The District will continue to monitor influent, effluent
and biosolids for total mercury at the Rock Creek and Durham AWWTFs on a quarterly basis. Because the
Hillsboro and Forest Grove WWTFs operate seasonally, influent, effluent and biosolids for total mercury will be
monitored semi-annually at these facilities.
In addition, the District proposes to conduct additional monitoring for dissolved mercury, total methyl mercury,
and dissolved methyl mercury; the additional monitoring will be conducted semi-annually for a two-year period.
Monitoring for total and dissolved mercury will be performed according to US EPA method 1631E. Monitoring
for total and dissolved methyl mercury will be performed according to US EPA method 1630. The parameters,
monitoring frequencies, analytical methods and quantitation levels are consistent with DEQ’s recommendations
for mercury monitoring in response to the Willamette Basin Mercury TMDL.
The District also plans to conduct additional monitoring of its industrial users for mercury. This includes a one-
time monitoring event of all SIUs within the District. The District anticipates conducting monitoring of all SIUs
during the first two years after permit issuance (est. 2016-2017). Following the monitoring, the District will:
Evaluate the data to identify industries that would benefit from pollution prevention activities;
Develop a targeted mercury reduction checklist/fact sheet for industrial users that will be distributed
and discussed on pretreatment and industrial stormwater inspections; and
Conduct additional monitoring of targeted SIUs after the implementation of mercury reduction activities
to assess effectiveness. The District anticipates conducting the targeted monitoring during the last two
years of the permit cycle (est. 2019-2020).
Table 6: Monitoring Schedule for Mercury
Facility Parameter Frequency Duration Location
Rock Creek AWTF, Total Mercury Quarterly Next Permit Cycle Influent, Effluent,
Durham AWTF (Est. 2016 - 2021) Biosolids
Hillsboro WWTF, Total Mercury Semi-Annually Next Permit Cycle Influent, Effluent,
Forest Grove WWTF (Est. 2016 - 2021) Biosolids
Rock Creek, Durham, Dissolved Mercury, Semi-Annually Year 1 and 2 of Influent, Effluent
Hillsboro, Forest Grove Total Methyl Next Permit Cycle
WWTFs Mercury, (Est. 2016 - 2018)
Dissolved Methyl
Mercury
207.0 References
AMSA, 2002. Mercury Source Control and Pollution Prevention Program, Association of Metropolitan Sewerage
Agencies, 2002.
DEQ, 2006. Willamette Basin TMDL, Oregon Department of Environmental Quality, September 2006.
DEQ, 2013. Implementation of Methyl Mercury Criterion in NPDES Permits, Oregon Department of
Environmental Quality, January 2013.
SJ/SC, 2007. San Jose/Santa Clara Water Pollution Control Plant Mercury Fate and Transport Study, California
Regional Water Control Board, San Francisco Region, 2007.
USEPA, 2008. Health Services Industry Detailed Study: Dental Amalgam. United States Environmental Protection
Agency. EPA-821-R-08-014. August 2008.
USEPA, 2014. Effluent Limitations Guidelines and Standards for the Dental Category; Proposed Rule. 40 C.F.R. §
403 and 40 C.F.R. § 441, United States Environmental Protection Agency, October 2014.
218.0 APPENDICES
A. Ecological Business Certification Program ‐ Automotive Services
B. Eco‐Certification Programs ‐ Promote Use of Environmentally Certified
Products
C. Eco-Certification Programs - Use Environmentally Certified Products
D. Environmental Standards for electronic Devices (EPEAT)
E. Promote Household Hazardous Waste Collection and Recycling in Oregon
F. Promote Existing Product Stewardship Programs
G. School Outreach
H. Dental Office Inspections
I. Mercury Audit Checklist for POTWs
J. Educational Brochure for Dental Inspections
K. Commercial and Residential Mercury Brochure
22Appendix A: Ecological Business Certification Program ‐ Automotive Services
TITLE ECOLOGICAL BUSINESS CERTIFICATION PROGRAM ‐
AUTOMOTIVE SERVICES
Description of
program EcoBiz is a certification program for businesses that go above and beyond
compliance. The free and voluntary program is designed to prevent and minimize
solid waste, hazardous waste, air and water pollution.
The EcoBiz program is developed and administered by the Pollution Prevention
Outreach Team (P2O), a group of pollution prevention experts from seven
agencies in the Portland metropolitan area.
There are EcoBiz programs for two sectors:
Automotive services (auto body shops, auto repair shops, radiator repair
shops, car washes, public and private fleet maintenance facilities), and
Landscape services (design, installation and/or maintenance firms, public
parks departments, University, hospital or corporate campuses).
This program description focuses on automotive services
Applicability to P3 Mercury/Methyl Mercury
chemicals or Cadmium
categories of Lead
chemicals
Program goals The goal of the program is to prevent and minimize pollution generated by small
businesses. The auto service certification program operates statewide.
Strategy and how Currently, members of the P2O provide outreach and technical assistance to
it works interested businesses. A business fills out a checklist concerning many different
aspects of its operating practices. When the checklist is complete, a P2O member
or wastewater inspector provides a list of recommendations for the business in
order for them to become certified. When the business completes the
requirements, they receive a site visit from a DEQ staff person and the local
wastewater utility to certify their practices.
Once certified, the business receives a framed certificate, window sign,
giveaways like key chains and refrigerator magnets, and is listed in advertising
done by the program to promote certified businesses.
Initial certifications are for three years, after which the business goes through
the same process and becomes re‐certified for five years.
DEQ accepts an EcoBiz certification for auto body shops in lieu of a permit for the
National Emissions Standards for Hazardous Air Pollutants regulation (NESHAP)
since all of the requirements for this rule are built into the program checklist.
EcoBiz outreach activity, checklist progress and certification status are all tracked
on a program database.
23Link http://www.ecobiz.org/
Applicable for P2: Both
internal, external
or both?
Startup For some areas of Oregon, this program is as easy as referring businesses in their
costs/resources area to the website.
The materials are available for free, but the staff time would be the cost.
Ongoing Staff time for program development and site visits.
costs/resources
Results and how The number of automotive service businesses that are certified could be tracked.
measured The municipality or district could also track the amount of automotive services
that they purchase that are eco‐biz certified.
Implementation Use the EcoBiz manual Keep Your Shop in Tune and the accompanying checklists
Guidance – Small to look at Fleet Services within the jurisdiction. Make adjustments to practices
Sized Communities as necessary.
Potentially seek full certification.
Implementation In addition to the above, promote the program to businesses in the jurisdiction,
Guidance – dependent on location in Oregon and level of DEQ support available.
Medium Sized
Communities Conduct site visits and provide technical assistance.
Implementation In addition to the above, assign staff to participate in the P2O meetings and be
Guidance – Large part of ongoing development of the EcoBiz program, if in the Portland
Sized metropolitan region.
Communities
Specific 1. Visit the EcoBiz site to learn about the program. Read the manuals and
implementation review the checklists.
steps 2. Work with internal fleet maintenance to fill out the checklists. For many, this
will be the end of the program.
3. If applicable, seek Auto Services certification.
4. If applicable, inventory automotive service businesses in the jurisdiction
5. Using available outreach materials, send an informational mailing to
businesses in the jurisdiction.
6. Follow up with interested businesses. This may include several site visits per
business. Coordination with DEQ must be done for the final certification visit.
7. Contact the P2O Coordinator for more information. This can be found by
clicking “contact” on the bottom of the www.ecobiz.org website.
24Tools and Goals can be set to reach a percentage of all automotive businesses within the
techniques for jurisdiction.
setting a goal, and
estimating and
measuring
effectiveness
Customization Depending on the part of Oregon, jurisdictions can partner with DEQ and the
using partnerships P2O for outreach and technical assistance for EcoBiz. Several trade groups have
or local initiatives helped in the development and continuing implementation of the program
including the Northwest Automotive Trades Association and some currently
certified businesses.
Related links http://www.ecobiz.org/automain.htm
25You can also read