Mexico's Response to COVID-19: A Case Study - Global ...
←
→
Page content transcription
If your browser does not render page correctly, please read the page content below
Mexico’s Response
to COVID-19:
A Case Study
Mexico’s Response
to COVID-19:
A Case Study
Chair                                                Carlos del Río, MD
                                                                                                                                       CONTENT
Jaime Sepúlveda, MD, DSc, MPH                        Distinguished Professor of Medicine, Division of
Executive Director, Institute for Global Health      Infectious Diseases, Emory University School
Sciences, University of California, San Francisco.   of Medicine and Executive Associate Dean at
Haile T. Debas Distinguished Professor of Global     Grady Hospital. Professor of Epidemiology and
Health.                                              Global Health, Rollins School of Public Health,
                                                     Emory University.
Authors
Mariano Sánchez-Talanquer, PhD (lead author)         Sarah Gallalee, MPH
Academy Scholar, Harvard Academy for                 Doctoral Student in Global Health, Institute for
International and Area Studies, Harvard              Global Health Sciences, University of California,
University. Assistant Professor, Center for          San Francisco.
International Studies, El Colegio de México.
                                                     Other memebers of the research team                               5   Abbreviations
Eduardo González-Pier, PhD                           Enrique Cárdenas Sánchez, PhD
Global Fellow, Wilson Center Mexico Institute,       Professor, Universidad Iberoamericana Puebla.                     6   Preface
Washington, D.C.                                     President, Executive Committee of Signos
                                                     Vitales and Puebla Contra la Corrupción y la         CHAPTER 1    8   Introduction and Epidemiology
Jaime Sepúlveda, MD, DSc, MPH                        Impunidad, A.C.                                                  11   Organization of the Report
Executive Director, Institute for Global Health                                                                       11   The Impact of the Pandemic in Numbers
Sciences, University of California, San Francisco.   Neelam Sekhri Feachem, MHA                                       34   The Bottom Line
Haile T. Debas Distinguished Professor of Global     Associate Professor, Institute for Global Health
Health.                                              Sciences, University of California, San Francisco.   CHAPTER 2   36   The National Environment
                                                                                                                      38   Epidemics and Pandemics in Modern History
Lucía Abascal-Miguel, MD, MS                         Mariana Flores Abdo, BA                                          40   Features, Strengths, and Weaknesses of the Health System
Doctoral Student in Global Health, Institute for     Independent researcher.                                          44   Health Status of the Population
Global Health Sciences, University of California,
San Francisco.                                       Arian Hatefi, MD                                     CHAPTER 3   50   Leadership and Governance
                                                     Associate Professor, Department of Medicine,                     53   Problems in the Emergency Response Model: Discretionary Decision-Making,
Jane Fieldhouse, MS                                  University of California, San Francisco.                              Political Subordination, and Lack of Deliberation
Doctoral Student in Global Health, Institute for                                                                      55   Disregard for Scientific Evidence and Data
Global Health Sciences, University of California,    Kelly Sanders, MD, MS                                            64   Delayed, Undecisive Action and Lack of Coordination
San Francisco.                                       Technical Lead, Pandemic Response Initiative,
                                                     Institute for Global Health Sciences, University     CHAPTER 4   68   Communication and Trust
                                                     of California, San Francisco. Clinical Instructor,               70   Strengths of Public Health Communication and Transparency
                                                     Lucile Packard Children’s Hospital at Stanford                   72   Communication Failures: Politicization, Wrong Messaging, and Setting a Bad
                                                     University.                                                           Example
CHAPTER 5 78 Public Health Response
82
82
Testing
NPIs Related to Testing: Isolation and Quarantine
A B B R E V I AT I O N S
84 Masks
84 Lockdowns and Physical Distancing
85 Other NPIs
CHAPTER 6 88 Preparation of Health System and Service Delivery
90 Expansion of Hospital Capacity
92 Access to Essential Medicines and Supplies and Equipment and Quality of Care
CHAPTER 7 94 Financing
CHAPTER 8 98 Vaccines CDC Centers for Disease Control and Prevention
100 The Magic of Vaccines CENETEC National Center of Technological Excellence in Heath
100 Cost of Vaccines ENSANUT National Survey on Health and Nutrition
101 Geopolitical Positioning of Influence GDP Gross Domestic Product
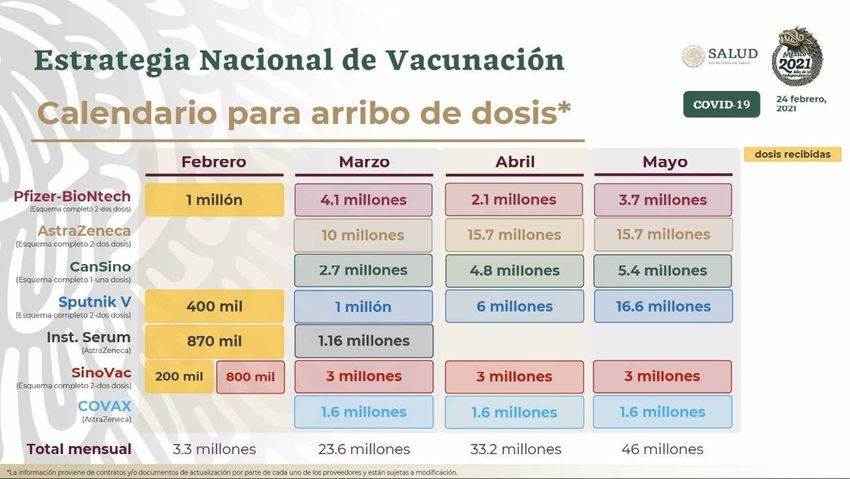
101 Vaccines Contracted and Vaccination Policies in Mexico HCW Health Care Workers
103 International Collaboration (COVAX) ICU Intensive Care Unit
103 Heterologous Vaccination and Single Dose Vaccination IMSS Mexican Institute of Social Security
104 Immunological Equity InDRE National Laboratory for Epidemiological Diagnostic and Reference
104 Vaccine Hesitancy INSABI Institute of Health Institute for Wellbeing
105 Vaccine Politicization INSP National Public Health Institute
106 International Comparison INEGI National Institute of Statistics and Geography
ISSSTE Institute for Social Security and Services for State Workers
CHAPTER 9 108 Conclusions and Recommendations MORENA National Regeneration Movement
NCD Non-Communicable Disease
120 Acknowledgements NGO Non-governmental Organization
NIH National Institutes of Health
NPI Non-pharmaceutical Interventions
PAHO Pan American Health Organization
PPE Personal Protective Equipment
RT-PCR Reverse Transcription-Polymerase Chain Reaction
SARS Severe Acute Respiratory Syndrome
SINAVE National Epidemiological Surveillance System
SISVER Epidemiological Surveillance System for Respiratory Diseases
SS Secretariat of Health
US United States
WHO World Health Organization
5
PR EFAC E

O
              ne year ago, at the time of this writing, WHO officially declared Covid-19 a pandemic, only a       Moreover, citizens have a right to be informed truthfully by the authorities about the magnitude of the threat
              few weeks after declaring it a Public Health Emergency of International Concern. The year           and of ways to be protected. Attitudes towards masking or hesitance to vaccines, for instance, are largely
              2020 will surely be considered in history as the most calamitous one in health since the 1918       dependent of the quality of political leadership and execution, as well as the clarity and consistence of
              flu pandemic. It will also be remembered as having the worst economic crisis since the Great        communications.
Depression. The social consequences of the pandemic will be felt for a long time to come.                              Science has again come to the rescue, by developing diagnostics and vaccines in record time. Testing
     The pandemic has affected everyone in the planet, directly or indirectly. It is estimated that over 10% of   has allowed to measure the extent of the pandemic, and in some countries, to trace contacts and effectively
the global population has been infected so far. This average hides the fact that in many places in Europe,        isolate and care for infected people. The magic of vaccines will eventually bring the pandemic under control,
the US, Brazil and Mexico this proportion could be much higher. With over 10,000 deaths per week, Covid           assuming that masking and other non-pharmaceutical interventions are enforced.
is now the 3rd main cause of death globally; in Mexico, it is currently the leading cause. Projections estimate        The notion that “No country will be safe until all countries are safe” needs to be hammered onto
that 4 million deaths due to Covid-19 will have occurred worldwide by July of this year. This figure does not     politicians and decision-makers everywhere. Vaccine nationalism is not only selfish but short-sighted.
account for the excess mortality related to non-Covid-19 cases that the pandemic has indirectly caused.           Virus variants will only increase in number and potential virulence in populations that are unprotected.
But not all regions of the world have been similarly affected. Some countries have performed better than          Immunological equity should not only become a humanitarian desire, but a national security concern.
others. Understanding what elements made a difference and what lessons can be derived is the object of                 The World Health Organization has no legal instruments to enforce its recommendations and is vastly
our case study.                                                                                                   underfunded. A profound reform is needed to empower and resource the organization to effectively
     This report was commissioned by the WHO Independent Panel to the Institute for Global Health                 deliver on its promises. Similarly, public health systems everywhere are underfunded. An effective global
Sciences at UCSF at the beginning of December 2020. The mission of the Independent Panel is “to provide           epidemiological vigilance system needs to be supported by a more robust network of equipped laboratories
an evidence-based path for the future, grounded in lessons of the present and the past to ensure countries        and trained epidemiologists at the national and local levels.
and global institutions, including specifically WHO, effectively address health threats.” Several faculty              It is no coincidence that countries with the worst performance in responding to the Covid-19 pandemic
members of our Institute and partner institutions in Mexico had been actively working on Covid-19 since the       have populist leaders. They have in common traits such as minimizing the severity of the condition,
early days of the pandemic, so it was possible to bring their multidisciplinary expertise into this evaluation.   discouraging the use of face masks, prioritizing the economy over saving lives, and refusing to come
The Covid-19 pandemic represents a rapidly moving situation, making this and other documents hastily              together with political opponents to mount a coherent response. They have also actively interfered in the
obsolete in numbers, but hopefully valid in terms of lessons learned and recommendations for the short            implementation of sound health policies, for political reasons. The consequences in terms of human lives
and long hauls.                                                                                                   have been devastating. Therefore, some level of political accountability for poor leadership and performance
     Good governance implies the formulation and enforcement of policies to benefit the public. This is           needs to be instituted.
premised on institutional strength and effective leadership. Countries that had both of these conditions,              There are many lessons learned from this pandemic response that need to be incorporated into future
like New Zealand and Norway, fared well. Poor leadership and lack of institutional strength are of course a       pandemic preparedness. This will require more than just a plan; it will require the public health infrastructure,
bad combination—Mexico being a case in point. But even in places with solid institutions, like the US, bad        trained personnel, financial resources and competent leadership that were so painfully lacking in the terrible
leadership led to disastrous consequences in 2020.                                                                year of 2020.
     Good communication is also essential in a crisis, and a component of good governance. Only by building
trust and delivering solid information based on evidence will people respond to public health ordinances.                                                                                                       Jaime Sepúlveda

6                                                                                                                                                                                                                                7
CHAPTER

                    1
Introduction
And Epidemiology
M E X I C O ’ S R E S P O N S E T O C O V I D -1 9 : A C A S E S T U D Y                                                                                                      C H A P T E R 1: I N T R O D U C T I O N A N D E P I D E M I O L O G Y

“I
           t was my first shift working in the COVID triage area. As a dermatology resident, I hadn’t been in an      The report is critical where actions and decisions were found to be wanting (and cost lives as a result). The
           Emergency Room in a while. I was nervous. As I came in, I started counting patients but soon lost          study’s conclusions were arrived at after careful consideration of the facts, not preset; the narrative follows
           count, as many more were coming in. There were no available beds in the hospital, but we were              from the evidence, not the reverse. Conclusions and recommendations were independently reviewed by
           accepting everybody, explaining to them that although we didn’t have bed availability, we would            a diverse group of external experts. The purpose is to objectively understand how Mexico got here, help
examine them. The head nurse comes to me and lets me know a hospitalized patient just died. We have a                 delineate the way forward in this pandemic, and inform future reforms to the national and international
bed! I thought, excited. We chose the sickest patient and within minutes, he was intubated. My next patient           health architecture.
was a woman that had started with symptoms 15 days ago. She tells me that she got sick at the same time                    The report was commissioned by the World Health Organization Independent Panel for Pandemic
as her husband. She only has a fever and a cough, so I ask why she came to the ER. ‘My sons pressured                 Preparedness and Response and elaborated by a multidisciplinary team of academics under the leadership
me,’ she tells me and then pauses. I wait for her to continue. ‘They pressured me because my husband just             of the University of California, San Francisco’s Institute for Global Health Sciences. The researchers
died and they got anxious, so they insisted that I came inside to be checked.’ I tell her I’m sorry for her loss      have comprehensively reviewed and analyzed the scientific literature, government reports and press
and she responds: ‘Yes, me too; he is the person that just died so that the other man could get a bed.’               conferences, media articles, and existing case and comparative studies. They have also conducted original
I can’t find words, so I hold her hand. She’s not oxygenizing well and needs to be hospitalized, so we keep           analysis of available data and conducted multiple interviews with key stakeholders from different social and
her in the ER. By morning, no beds have opened up, so I have to give her a referral for another hospital. As          government sectors, to ensure different viewpoints were considered.
I give it to her, she looks at me and asks, ‘does this mean I can’t go to my husband’s funeral?’ I gather the              The team wishes to thank all those who accepted to be interviewed and those who shared their first-
strength I have left and tell her no, ma’am, you cannot.”                                                             hand experiences. The report is written in recognition of all those who have cared for an ill person and/or lost
     This story, told to us by a Mexico City healthcare worker, is the story of thousands of Mexicans who             a loved one. In the face of the pandemic’s sweeping toll, it is our collective duty to honor the sick and dead.
have been infected with SARS-CoV-2. It encapsulates the tragedy of too many families left bereft and
the extreme conditions under which health workers have been caring for patients over the past year. Its
purpose is to remind readers from the outset about the human suffering that lies behind the analysis and              Organization of the Report
the statistics of the pandemic that this report will provide. With the world’s 11th largest population, Mexico is,
at the time of writing, the country with the third most reported COVID-19 deaths worldwide and the fourth             The rest of this chapter is devoted to characterizing the health impact of the pandemic in Mexico. It focuses
highest excess mortality from all causes among those countries with available figures on total deaths.                on the broad trends and numbers of the pandemic, situating Mexico in comparative perspective where
     Several defining features of Mexico’s experience with the COVID-19 pandemic are reflected in the story:          appropriate. The goal of the chapter is to establish the fundamental empirical facts before analyzing the
high rates of transmission within families, many of them living in crowded conditions in multigenerational            reasons behind them in the rest of the report.
housing, and all having to balance between health and economic needs given the lack of dedicated                           Chapter 2 describes relevant aspects of the national context before the pandemic hit, including the
government support programs. Too little and too late testing. Delays in seeking medical care out of fear              health status of the population and key features of the country’s health system, which was in a precarious
that once admitted to a hospital, people would contract the disease or die. A government communication                condition due to a poorly implemented reorganization process and debilitating resource cuts on the
campaign that prioritized keeping up appearances, and partisan politics, before health. Difficulties in finding       verge of the emergency, falling on top of other long-term vulnerabilities. Chapter 3 reviews leadership
a bed in overwhelmed hospitals at critical moments of the epidemic, even as official statistics continued to          and governance. It examines systemic problems in the emergency response model that led to failures in
show availability. The need to resort to clinicians from all fields, junior staff, and medical residents to respond   incorporating relevant scientific evidence and in following a precautionary approach in the management
to the emergency, frequently without providing them with necessary training and quality Personal Protection           of the pandemic, as well as to prevalent coordination problems. Chapter 4 and 5 discuss communication
Equipment (PPE). The extraordinary emotional distress among healthcare professionals. And ultimately,                 and the public health response, respectively. Chapter 6 examines the preparation of the health system and
the heavy toll of an uncontrolled pandemic on an overstretched health system and society at large as the              service delivery. Chapter 7 describes the underfunding of the pandemic response, and Chapter 8 explains
government failed to coordinate a national response and to implement sound policies to control infections,            the progress and issues with vaccination so far. Chapter 9 presents conclusions and recommendations.
throwing the public health and service delivery components of pandemic management sharply out of balance.
     This case study examines these and other important components of the COVID-19 pandemic and the
national response in Mexico. It seeks to elucidate the reasons behind the high burden of disease in the               The Impact of the Pandemic in Numbers
country and produce insights and recommendations that can support a more effective response, both
for the rest of this pandemic and for future health emergencies. In doing so, it builds upon the work of the          International and subnational comparisons of the burden of COVID-19 must take into consideration that the
scientific community across disciplinary fields, health professionals, journalists, civil society, the private        quality and availability of statistics varies across jurisdictions. Countries differ markedly in the structure of
sector, and government officials.                                                                                     their health systems, the territorial reach of their healthcare infrastructure, their epidemiological surveillance
     The goals and premises of this report are explicitly non-partisan. It is neither a rationalization of            models, and their viral testing regimes. Such differences may reduce the comparability between units and
government decisions or of the pandemic’s undeniably devastating impact in Mexico nor a political diatribe.           lead to imprecise conclusions, especially when relying on a single indicator of incidence.

10                                                                                                                                                                                                                                              11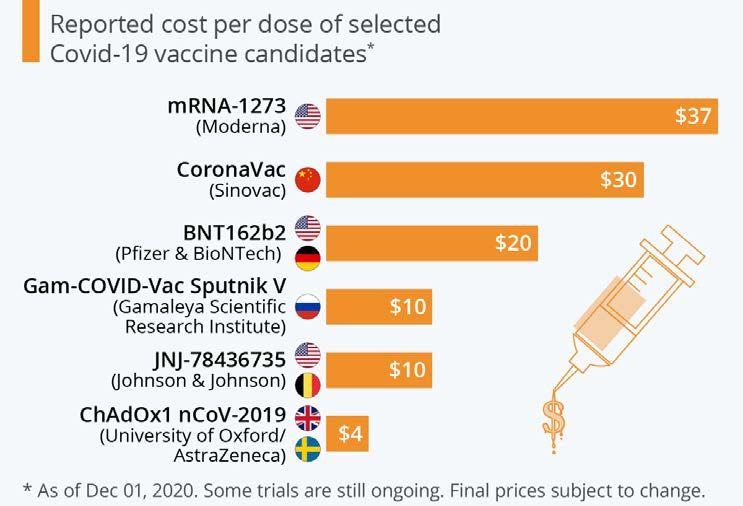
C H A P T E R 1: I N T R O D U C T I O N A N D E P I D E M I O L O G Y
                                        Mexico’s COVID-19 response
                                                  Timeline
                                                                                                                                  With respect to COVID-19, the number of cases and deaths across geographical units reflect not
                                                            ● Jan 9 WHO reports a novel coronavirus.                         only the prevalence of disease, but the capacity and willingness to diagnose occurring infections. For
                                                            ● Jan 21 First confirmed case in the United States.              this reason, analyses must take into account differences in measuring capacity and approaches toward
                                                            ● Jan 30 WHO declares the coronavirus outbreak a public          diagnostic testing and cross-validate between different indicators. Finally, indicators must be analyzed with
                                                                     health emergency of international concern.              reference to the data generation process and comprehensively, rather than in isolation.
                                                            ● Feb 3 WHO releases the Strategic Preparedness and                   Adopting such a comprehensive view of the data confirms that Mexico is one of the worst-affected
                                                                    Response Plan.
                                                                                                                             countries during the COVID-19 pandemic. Several metrics demonstrate the severe impact of the disease in
                                                            ● Feb 26 Brazil reports its first case, the first one in Latin
                                                                                                                             the country and situate it among the worst performers internationally:
                   First confirmed case in Mexico. Feb 27 ●          America.
                                                            ● Mar 11 WHO characterizes COVID-19 as a pandemic.
                  Big music festival in Mexico City. Mar 15 ●                                                                A) Comparatively high numbers of reported cases and deaths, after accounting for differences in
                        Eight states close schools.         ● Mar 16 Several countries across Latin America impose              population size and testing levels.
                                                                     restrictions on their citizens to slow the spread of    B) Comparatively high excess mortality from all causes, which reflects both the direct and indirect impact
First death of a patient diagnosed with COVID-19. Mar 18 ●
                                                                     the virus.
      First session of the General Health Council. Mar 19 ●                                                                     of COVID-19.
             Federal government closes schools. Mar 23 ●                                                                     C) Large inequities in the burden of disease across social groups and regions.
Secretariat of Health launches “Healthy Distance”                                                                            D) Very high infection and mortality rates among health workers.
                      program. AMLO holds rallies.
       General Health Council declares sanitary Mar 30 ●                                                                         In the remainder of this chapter, we analyze each of these elements in more detail in order to properly
 emergency due to COVID-19. Suspension of all          ● Apr 2 WHO reports that transmission from a                          characterize the course and toll of the pandemic.
                        nonessential activities.               pre-symptomatic case can occur before
                                                               symptom onset.
                                                             ● Apr 6 WHO issues updated guidance on masks,                   Confirmed COVID-19 Infections
           Private hospitals open their facilities to Apr 13 ●       advising the use of a mask by healthy people.           The first COVID-19 case in Mexico was confirmed by authorities on February 28, 2020, although in its
        beneficiaries of the public health system.                                                                           current release, the official database includes one case with a positive test result a month earlier (SS).
                        AMLO suspends his tours. Apr 15 ●                                                                    A year later, by mid-February 2021, more than 2 million infections have been confirmed, 94.6% of which
                                                        ● Apr 24 Launch of the Access to COVID-19 Tools                      were confirmed by RT-PCR or antigen test. The remaining 5.4% of patients were diagnosed with COVID-19
                                                                 Accelerator.
                                                                                                                             based on clinical presentation and epidemiological association, given the lack of a valid test result.
                                                       ● May 10 WHO issues interim guidance on contact tracing
  Announcement of the reopening plan for a “new May 13 ●        and considerations in adjusting public health and                 Figure 1 presents Mexico’s epidemic curve and the number of patients analyzed for COVID-19,
                                       normal.”                 social measures.                                             according to official data from the National Epidemiological Surveillance System (SS). Of all confirmed
   Beginning of state-level stoplight system. The Jun 1 ●                                                                    cases, 44% reported they had had contact with another person diagnosed with the disease. Infection rates
reopening plan begins as cases continue to rise.        ● Jun 4 Number of daily reported cases surpasses                     across age groups have remained relatively stable throughout the pandemic, with a slight increase over
                                                                100,000 globally                                             time in the proportion of cases being reported for the population younger than 30 years of age. This group,
                                                            ● Jun 10 The WHO warns that Mexico is facing its “most           which comprises half of the Mexican population, accounted for 21% of reported cases in mid-July of 2020
                                                                     dangerous moment."
                                                                                                                             and 25% by mid-January 2021.
                                                            ● Jun 30 The European Union prepares to open to
                                                                     visitors from 15 countries. The list excludes the            The epidemic curve displays two infection peaks, the first by mid-July of 2020 and the second by early
AMLO is first seen wearing a mask when traveling      Jul 7 ●
                                 to Washington.                      United States, Brazil or Russia.                        to mid-January 2021, with the second exceeding the first by a ratio of 2:1. The first two vertical dotted lines
      Authorities continue to advice against mask Jul 24 ●                                                                   in Figure 1 demarcate the period during which lockdown measures were in place at the national level, under
                                         wearing.        ● Sep 11 WHO highlights the value of antigen based rapid            the National Campaign of Healthy Distancing (March 23-May 30). The country then transitioned to a state-
      Mexico signs the commitment agreement to Sep 25 ●           diagnostic tests.                                          level alert system, with measures varying depending on the estimated epidemic risk across jurisdictions.
   purchase WHO’s COVID-19 vaccines through
                                                         ● Sep 28 Global deaths reach 1 million.                                  The national lockdown period was determined based on the federal government’s epidemiological
                                          COVAX.
     Mexico surpasses 1 million confirmed cases. Nov 13 ●                                                                    projections, which were shared with the public and predicted the curve would peak between the 6th and
                 Mexico exceeds 100,000 deaths. Nov 19 ●                                                                     8th of May (GobMX). As is clear from the graph, the projection was not met. The first peak came more than
                                                            ● Nov 30 The WHO’s director general encourages the               two months later, as cases continued to rise steadily until mid-July. The descent was also significantly
The Secretariat of Health has just two states at red Dec 13 ●        country’s leaders to use face masks in order to         less pronounced than expected. The federal government’s projection, following a normal distribution,
                                         level alert.                model the behavior for the population.                  anticipated a steep decline in the epidemic curve after the peak and the end of the “first cycle” of the
        COVID-19 vaccination campaign begins. Dec 24 ●
                                                                                                                                                                                                                                                     13
M E X I C O ’ S R E S P O N S E T O C O V I D -1 9 : A C A S E S T U D Y C H A P T E R 1: I N T R O D U C T I O N A N D E P I D E M I O L O G Y
pandemic by June 25 (marked with a vertical dotted line in Figure 1), when 95% of all expected cases would Surveillance System for Respiratory Diseases (SISVER) as long as they meet the operational definition for
have already occurred (Presidencia de la República; El Universal). suspected viral respiratory disease, which requires the presence of symptoms (SS). Under the guidelines,
10% of patients with mild symptoms, 100% of patients with severe symptoms (difficulty in breathing), and
Figure 1. Daily new COVID-19 analyzed and confirmed cases 100% of those meeting the criteria for severe acute respiratory infection undergo testing. Establishments
with more resources may sample more than 10% of outpatients, but this has been rarely done in an
40,000
National Campaign of Expected end of first cycle of the pandemic
underfunded public sector.
Healthy Distancing in the Mexico City area, according to Additional tests conducted by laboratories outside the National Network of Public Health Laboratories
(nationwide suspension the government’s projection
of non−essential (June 25) and/or not meeting the operational definition are not recorded in the national epidemiological database.
activities)
30,000 These include tests purchased by typically wealthier citizens and any testing financed by state governments
but not matching the criteria for registration established by the federal Secretariat of Health. A few state
governments conducted such additional testing, especially as antigen tests became more available.
20,000 However, these efforts remain limited and, as we discuss later, they were not supported or were even
Analyzed for COVID−19
obstructed by the federal government. The official figures therefore include most analyzed samples.
The high share of confirmed cases relative to studied patients, visible in Figure 1, reflects the
10,000 testing regime and epidemiological surveillance system implemented during the pandemic. By design,
Confirmed new asymptomatic individuals and most with mild symptoms have not been tested; as a result, the vast majority
COVID−19 cases of infections have gone uncounted. Whether this was a sound policy choice is later analyzed in the report.
0 Here we simply note that the number of cases is considerably underestimated due to limited testing,
as is clear from the test positivity rate. On average, 39.8% of tests performed from the beginning of the
0
0
0
1
0
0
0
20
0
0
0
21
20
02
02
02
02
02
02
02
02
02
02
20
20
20
pandemic to mid-February 2021 were positive, with the rate exceeding 50% during the first peak in July
t2
c2
b2
b2
r2
p2
v2
n2
g2
l2
ar
jan
ay
oc
ju
ap
de
no
ju
fe
fe
se
au
m
01
m
01
01
01
01
01
01
01
01
01
01
01
of 2020. The positivity rate stayed below 45% during the second peak despite the higher levels of disease
01
Cases are arranged according to the date patients with suspected COVID−19 were tested or first received attention transmission, which suggests a slight relaxation of barriers to testing.
at a health care unit. Source: Authors’ elaboration based on Dirección General de Epidemiología, Secretaría de To contextualize Mexico’s comparative burden of infection it is therefore necessary to account for the
Salud (data release of February 20, 2021). extent of diagnostic testing. Figure 2 shows the total number of tests per thousand population (along the
horizontal axis) and the number of confirmed cases per million population (along the vertical axis), in a
Such a decline did not occur. Although reported cases decreased somewhat in the fall, more than transformed (logarithmic) scale. The diagonal represents the average growth rate in detected infections as
32,000 thousand weekly new cases were being detected even at the lowest point of the curve. This testing increases. Absolute differences between countries are larger than they appear visually due to the
incidence rate, of approximately 100 cases per 100,000 population in a 28-day period, corresponds to the log transformation, but the graph helps identify which countries have a higher or lower than expected case
highest level of risk in the 4-level system employed by the United States’ Centers for Disease Control and burden relative to the rest of the world and to the amount of testing they conduct.
Prevention (CDC) to alert travelers about health threats across locations (CDC). This means that after the Mexico appears in the top left quadrant (B) with a considerably higher number of cases per million
first peak in July, Mexico’s epidemic curve stabilized for about three months at very high levels of COVID-19, than would be expected considering its number of tests per population, alongside other Latin American
pointing to a sustained inability to bring down transmission. Rather than two waves, Mexico has been hit by countries like Ecuador and Bolivia. Mexico is the country with the largest positive vertical distance from the
a single wave that has fluctuated between very high and extreme levels of COVID-19. diagonal (with Peru and Argentina), suggestive of the highest rates of undetected infections.
After the stabilization period in the fall, cases started to rise again in November, yet at a faster pace A large, nationally representative serological survey fielded between August and November by the
than during the first period of ascent. As we discuss later, authorities hesitated at this juncture to reinstate National Public Health Institute (INSP) which enrolled 9,400 households corroborates the extremely low
lockdown measures in the Mexico City area, despite evidence of re-acceleration of contagion and in violation detection rate. Based on the survey results, 25% of the Mexican population had developed antibodies
of the government’s own alert-system guidelines (NYTimes; Aristegui Noticias). This region contributed against SARS-CoV-2 (SS). Of these, 70% were asymptomatic, 10% presented some symptoms that
disproportionately to the second infection peak, when over 15,000 new cases were registered daily, more might have been consistent with COVID-19, and 20% presented clear COVID-19 symptoms. Results were
than double the cases seen in the first peak. The incidence rate for January 2021 reached 324 per 100,000 presented as preliminary, with 75% of the sample analyzed. As of the end of February 2021, the full results
population, more than three times above the CDC’s threshold for “very high” COVID-19. of the study have not yet been released.
Figure 1 also illustrates that confirmed cases represent a high proportion of all individuals analyzed Under the assumption that all those infected since the beginning of the pandemic continued to have
for SARS-CoV-2 and whose result has been recorded in the national database. Public and private health antibodies at the time of the serological survey, the most conservative estimates comparing reported cases
establishments across the country register patients with suspected COVID-19 in the Epidemiological with the survey results yield a ratio of about 1 infection in every 30 being reported (3.3%). For reference,
14 15M E X I C O ’ S R E S P O N S E T O C O V I D -1 9 : A C A S E S T U D Y C H A P T E R 1: I N T R O D U C T I O N A N D E P I D E M I O L O G Y
the CDC estimates that 1 in 4.6 infections (21.7%) were detected in the United States between February Predictably, deaths follow the same pattern as the infection curve, with a second and higher peak in
and December 2020 (CDC). In April, health authorities stated that under the sentinel system employed to January 2021. Figure 3 includes two vertical dotted lines. The first marks the date when the number of
monitor the epidemic, 1 in every 8 cases were diagnosed (SS). The serological survey provided evidence expected COVID-19 deaths in one of the federal government’s initial projections was officially met (around
that the size of the pandemic is about four times larger than authorities had believed, and the capacity to 30,000 deaths) (Presidencia de la República). The second marks the worst-case scenario in the same
diagnose infections considerably lower. estimations (60,000 total deaths). Again, the official projections were overly optimistic. By late February
2021, the number of confirmed COVID-19 deaths in the government’s worst-case (so-called “catastrophic”)
Figure 2. Total COVID-19 tests per thousand vs. confirmed cases per million scenario has been exceeded by a factor of 3.
(As of February 5−10, 2021. Log−log relationship)
Figure 3. Weekly confirmed COVID-19 deaths and weekly excess deaths from all causes
Quadrant B. Low testing, Quadrant A. High testing,
125,000 high COVID−19
high COVID−19 Government’s death Government’s worst−case
USA projection met death projection met
PAN ISR
NLD BEL GBR 15,000
Weekly excess deaths
COL CHL IT A AUT SVK from all causes
ARG
(total − expected)
PER DNK ARE
UKR TUR
Confirmed cases per million
ZAF RUS
25,000 DEU
BOL DOM
MEX ECU
IR N
IR Q GRC 10,000
MAR KAZ NOR Weekly confirmed
NPL URY SAU SGP COVID−19 deaths
GTM IND FI N Cumulative excess deaths: 308,190
Quadrant C. Low testing, (as of January 2, 2021)
MYS Quadrant D. High testing,
low COVID−19 low COVID−19
PHL
IDN
BGD JPN LKA 5,000
3,000 CUB
MMR
GHA PAK
SEN KEN
MOZ KOR Cumulative confirmed COVID−19 deaths: 166,075
ETH RWA (as of Jan 30, 2021)
CIV AUS
UGA 0
MDG NGA TGO MNG
0
0
0
0
20
0
0
20
20
20
1
20
NZL
02
02
02
02
02
02
02
SSD
20
20
20
20
20
400
t2
c2
r2
p2
g2
v2
n2
ar
ay
ug
un
THA
ul
oc
ap
no
de
au
se
ja
5j
m
m
2a
7j
25
17
12
27
22
20
30
15
10
2.5 20 135 700 3,000
Tests per thousand Excess deaths are calculated as total deaths minus expected deaths (90th percentile) according to observed mortality
for 2015-2019. Source: Authors’ elaboration based on National Epidemiological Surveillance System, Secretariat of
The dotted lines mark the average in each variable for included countries. Axes are in logarithmic scale. The size of Health (data release of February 20, 2021) and mortality data from INEGI and the National Population Registry.
the circles is proportional to countries’ population. All countries with available information and more than 3 million
population are included. Source: Authors’ elaboration based on data collected by Our World in Data. The projections were based on the proportion of people reportedly contracting the disease (attack
rate), requiring medical attention, and dying during the original outbreak in the Hubei Province of China
It should be noted that the serological survey’s field period ended in November, right as Mexico was (IMSS; Presidencia de la República). Authorities considered that 0.1% of the population had contracted
entering the two months of highest transmission of all the pandemic. Assuming a similar detection rate and the virus by the middle of the outbreak and about 0.2% would have done so by the end. Extrapolating
again a relatively long period immunity (i.e., a low rate of reinfections), reported cases between December from that estimate, they expected that between 275 and 300 thousand people would contract the disease
2020 and February 2021 would imply that about an additional 20% of the population may have already in Mexico, of which 70% would seek medical attention; 6% in that subgroup (about 10 thousand people)
contracted the virus, on top of the 25% reported by the survey. would become critically ill (Presidencia de la República; Presidencia de la República).
These were the figures that were first considered most likely, and the ones health authorities originally
COVID-19 Mortality used to estimate the financial needs of the epidemic and prepare the health system (Presidencia de la
Figure 3 presents the weekly number of confirmed COVID-19 deaths, plotted against the number of excess República; Presidencia de la República). However, these calculations were based on assumptions that
deaths from all causes. Figures on excess deaths come from the official calculations of an interinstitutional viral transmission would follow the evolution observed in Hubei Province, regardless of public health
group established in May 2020 to compile these data, in a positive step toward transparency. The Secretariat interventions enacted or other differences across potentially relevant factors. By June, as cases continued
of Health, the National Population Registry, the statistics agency (INEGI), and the Pan American Health to rise, health authorities shifted from the scenario associated with a 0.2% attack rate to one in which
Organization (PAHO) form part of this body (SS; SS DGIS). 0.5% of the population contracted the disease. This alternative scenario had been initially considered too
16 17M E X I C O ’ S R E S P O N S E T O C O V I D -1 9 : A C A S E S T U D Y C H A P T E R 1: I N T R O D U C T I O N A N D E P I D E M I O L O G Y
pessimistic. The projection of 30,000 total deaths corresponded to this incidence proportion. In the worst- The distribution of deaths varies considerably across regions and patient characteristics. As elsewhere,
case scenario, a 1% attack rate would duplicate the total number of deaths. mortality is disproportionately higher among men of older age and among patients with one or more
Even this scenario proved too optimistic. Being the world’s 11th largest country by population size, by preexisting comorbidities. On the aggregate, Mexico’s relatively young population (the median age is 29
mid-February Mexico ranked third in confirmed deaths due to COVID-19 after the United States and Brazil, years and persons 65 and older comprise 8.2% of the population) would predispose the country toward
both of which conduct more testing and therefore have lower rates of underdiagnosis. Mexico is among the lower overall mortality relative to countries with an older population like the United States and most of
countries with the highest case-fatality ratio (deaths relative to confirmed cases) and confirmed COVID-19 Europe. However, the inability to control transmission of SARS-CoV-2 in a context of high prevalence of
deaths per population. Figure 4 presents both of these indicators for the twenty most affected countries chronic conditions such as diabetes, obesity, and cardiovascular disease has contributed to the very high
worldwide. The very high case-fatality rate again reflects Mexico’s exceptionally restrictive testing regime. number of deaths officially reported — about 185,000 by the end of February (INSP; Barquera and Rivera
2020). These vulnerabilities associated with the health status of the population and others related to the
Figure 4. Observed case-fatality ratio and deaths per 100,000 population health system merited more coherent and decisive action toward controlling viral transmission.
0% 1% 2% 3% 4% 5% 6% 7% 8% 9% 10%
Empirical studies of the risk factors for COVID-19-related hospitalization and lethality at the individual
Mexico 9.0% level among the Mexican population point to diabetes, early-onset diabetes, obesity, chronic kidney
Peru 3.5%
disease, hypertension, and immunosuppression (in addition to advanced age) (Bello-Chavolla et al. 2020;
Hungary 3.4%
South Africa 3.3% Parra-Bracamonte et al. 2020). Our own analysis of the national epidemiological database indicates that at
Italy 3.3% least one of these comorbidities was present in two thirds (66.6%) of all confirmed COVID-19 deaths as of
United Kingdom 2.9%
February 26, 2021. Figure 5 presents the share of patients with fatal COVID-19 that had different types of
Germany 2.9%
Indonesia 2.7% conditions.
Colombia 2.7% The most frequent comorbidities of patients diagnosed with COVID-19 in Mexico are hypertension
Poland 2.5%
Agentina 2.5%
(17.4%), obesity (14.6%), and diabetes (13.4%). Fatality ratios (proportion of deaths among those presenting
Slovakia 2.4% the condition and diagnosed with COVID-19) for these comorbidities were 23.1%, 13.5%, and 24.9%,
Brazil 2.4%
respectively.
Spain 2.3%
France 2.2%
Russia 2.0% Figure 5. Presence of comorbidities in patients with fatal COVID-19
Ukraine 2.0%
United States 1.8% 50%
Czechia 1.6%
45.3%
India 1%
0 50 100 150 200 250 40%
Czechia 201.38 37.5%
United Kingdom 187.60
Italy 165.12
Hungary 162.49 30%
United States 160.48
Spain 152.25
Mexico 151.01 22.2%
Peru 149.05 20%
Slovakia 143.86
France 132.45
Brazil 126.71 11.8%
Colombia 121.86 10%
Poland 119.21 6.8%
5.1%
Argentina 118.85
South Africa 87.71
Germany 86.80 0%
Ukraine 63.87 Hypertension Diabetes Obesity Other Chronic kidney Cardiovascular
disease disease
Russia 60.61
Indonesia 13.92
The ’other’ category includes chronic obstructive pulmonary disease, patients with immunosuppressed conditions,
India 11.67
and other less−frequent comorbidities. Source: Authors’ elaboration based on Dirección General de Epidemiología,
Source: Johns Hopkins University & Medicine, Coronavirus Resource Center. As of February 26, 2021. Secretaría de Salud (February 26, 2021).
18 19M E X I C O ’ S R E S P O N S E T O C O V I D -1 9 : A C A S E S T U D Y C H A P T E R 1: I N T R O D U C T I O N A N D E P I D E M I O L O G Y
The high prevalence of chronic diseases, in combination with suboptimal timeliness and quality of postpone the reintroduction of strict restrictions in the city until December 18. By then, on the verge of the
medical attention, have likely contributed to relatively high COVID-19 mortality among the non-elderly winter holidays, transmission had already spiraled. This contributed to disproportionately high incidence of
population in Mexico. 50.6% of all deaths have occurred among population less than 65 years old, cases and deaths in the Mexico City area in the second peak of the pandemic.
compared to 18.7% in the United States. Figure 6 presents the contrast between these two countries in the
age distribution of confirmed COVID-19 deaths. Figure 7. Daily new reported COVID-19 deaths by state
Figure 6. Share of confirmed COVID-19 deaths by age group, Mexico versus USA
(as of February 10-11, 2021)
35% Puebla (5.2% of pop.,
32.0% 4.7% of deaths)
Jalisco (6.6% of pop.,
30% 27.9% 5.6% of deaths)
26.9%
25.7% Guanajuato (4.9% of pop.,
4.8% of deaths)
25% Edo. Mex. (13.5% of pop.,
21.4% 15.4% of deaths)
20% CDMX (7.3% of pop.
15.8% 16.9% 14.4% of deaths)
15%
11.7%
10%
0
0
6.4%
0
0
1
20
0
0
21
0
20
0
1
02
02
02
02
02
02
02
02
02
02
5.4%
20
20
20
4.6%
t2
c2
r2
p2
b2
g2
v2
n2
l2
n2
ar
ar
ay
oc
ju
ap
5%
no
de
ju
au
se
fe
ja
m
m
13
m
13
11
09
08
14
11
10
10
12
2.2%
15
10
14
1.7%
0.6%
0% Deaths are recorded based on patients’ state of residence. Source: Authors’ elaboraration based on Dirección
Under 1–4 5–14 15–24 25–34 35–44 45–54 55–64 65–74 75–84 85 years General de Epidemiología, Secretaría de Salud (data release of February 20, 2021).
1 year years years years years years years years years years and over
USA Mexico
Of the more populated states, the state of Jalisco in the center-west—whose capital Guadalajara is
Source: Dirección General de Epidemiología, Secretaría de Salud and CDC.
the country’s third-largest metropolitan area—appears as the best performer, with 6.6% of the country’s
population and 5.6% of all COVID-19 deaths. The states of Michoacán, Oaxaca, Veracruz, and Chiapas
Regionally, the Mexico City area has disproportionately contributed to mortality by COVID-19 in the also have fewer confirmed COVID-19 deaths relative to their population, but these are states where
country. Figure 7 shows deaths of patients diagnosed with COVID-19 across states and over time. Each underdiagnosis is highest due to insufficient testing.
segment in the graph represents one of Mexico’s 32 states. The area for each state is proportional to its
relative contribution to the total number of deaths, according to patients’ state of residence, though not Excess Mortality
necessarily where they received medical attention. The vertical size of the graph at a given time point reflects Figure 3 shows that confirmed COVID-19 deaths are only a fraction of excess deaths observed in the
the proportion of deaths that occurred in that date relative to total observed deaths since the beginning of country since the beginning of the pandemic. Official figures report 326,609 excess deaths in 2020, 2.6
the pandemic. The two peaks of the epidemic curve in July 2020 and January 2021 are again reflected in times the number of confirmed COVID-19 deaths for the same period. Statistics for January 2021, when
Figure 7, with the number of deaths in the second peak far exceeding those observed in the first. COVID-19 deaths peaked, have not been released at the time of writing, but a considerable increase in the
The performance of states in terms of mortality is highly variable. With 7.3% of the country’s population, number of excess deaths associated with the pandemic is to be expected.
Mexico City accumulates approximately 14.5% of total confirmed COVID-19 deaths. Differences in the level A considerable proportion of the 61.2% excess deaths of 2020 that have not been linked to a COVID-19
of testing and underdiagnosis across states may partly account for this pattern, but excess mortality figures diagnosis are likely directly attributable to the disease, given very limited access to testing and diagnosis. It
corroborate the disproportionate contribution of Mexico City. The State of Mexico that surrounds the capital should again be noted that the INSP’s serological survey suggested that only about 1 in every 30 infections
and the northern state of Baja California, where the large city of Tijuana is located, are the two other states were detected. A preliminary revised estimate of COVID-19 mortality provided by INEGI and based on
with the largest gaps between their share of total population and their share of COVID-19 deaths. death certificates showed that up to August of 2020, official figures underreported the death toll caused by
Notice that the disproportionate contribution of the Mexico City metropolitan area to the death toll the disease by 45% at the minimum (INEGI). However, the figure is likely to be revised upwards, given that
increased starting in early December, when authorities’ miscalculations or tampering with the established an important proportion of remaining excess deaths currently attributed to other diseases closely track the
epidemiological alert-system—which by December 4, signaled the highest level of risk—led them to observed epidemic curve over time.
20 21M E X I C O ’ S R E S P O N S E T O C O V I D -1 9 : A C A S E S T U D Y C H A P T E R 1: I N T R O D U C T I O N A N D E P I D E M I O L O G Y
In addition to diagnosed and undiagnosed COVID-19 cases, the high number of excess deaths countries included in the sample (all countries with more than 3 million population and complete mortality
reflects a strong indirect impact of the pandemic on mortality via the disruption of care for other conditions data for the past three years) is 17.3%. We estimate that if Mexico had performed as the average in the
(PAHO). Many patients have delayed or avoided seeking medical attention for other conditions out of fear pandemic, around 190,000 deaths from all causes would have been avoided in 2020.
of contracting the virus in medical establishments overwhelmed by COVID-19 patients. More importantly, Excess mortality figures also display high subnational unevenness. Figure 9 shows weekly excess
uncontrolled viral transmission led a chronically overstretched health system to redirect its already scarce mortality across the 32 states throughout 2020. The parentheses contain the excess mortality share in
resources to the attention of patients sick with COVID-19. each state for all of 2020. It should be noted that the states of Oaxaca and Chiapas, at the bottom of the
Most regular procedures and primary health visits have been cancelled. Data from the Secretariat graph with the lowest excess mortality rates, have experienced challenges recording deaths (SS). These
of Health indicate that by December 2020, diagnosis for malnutrition, heart conditions, uterine cancer, are also poor, rural states in southern Mexico with low testing rates. Their figures must be interpreted with
diabetes, and breast cancer had fallen by 56%, 45%, 34%, 27%, and 20% (Secretaría de Salud). During caution.
the first semester of 2020 alone, diagnoses for diabetes fell by 26% relative to the same period in 2019. Mexico City and the surrounding State of Mexico appear again as the most affected regions, with very
Considering the increase in COVID-19 cases and hospital overflow in the winter months, balance in care for high excess mortality. Independent researchers who have directly analyzed data from death certificates
other conditions is unlikely to have improved. have shown that Mexico City has the highest excess deaths per population in a list of cities or regions
As we discuss later, debilitating budget cuts and non-consensual, poorly implemented reforms further highly affected by the pandemic (Lima, Guayas, New York City, Madrid, Lombardia, London, Santiago, and
affected the health system’s functionality leading into the pandemic, and subsequently throughout 2020. All Paris) (Romero and Despeghel 2021). Of this group, only Lima in Peru has a higher percentage score by
these elements together have contributed to Mexico’s very high excess mortality and paint a bleak picture mid-February 2021 (125% vs 200%). The researchers have argued the Mexico City government has raised
for the immediate future, in terms of the consequences of delays in diagnosis and care for other conditions. obstacles for them to continue conducting the analysis (Nexos).
Figure 9 also shows states’ different epidemic curves across Mexico’s large territory. Although all states
Figure 8. Excess mortality in 2020 relative to 2018-2019, all causes and ages saw a first peak in excess mortality between May and July, patterns differ in the subsequent months. Some
states experienced steeper declines in excess deaths than others. In addition, several states, especially those
90% in northern Mexico, show a second peak in mortality in November. The graph stops by the end of 2020, when
Average excess mortality across countries: 17.3%
Excess mortality, Mexico: 42.9%
80% several states but not all display an upward trend toward a second peak that surpasses the first.
70%
With 17.3% excess mortality, Mexico would have
60%
had 189,465 less deaths in 2020 Inequities
50%
As the wide regional differences analyzed here illustrate, the health impact of the pandemic has been highly
uneven across social groups. Several forms of inequity are apparent. A first manifestation is access to a
40%
COVID-19 diagnosis for those infected with SARS-CoV-2. Our analysis of the official data points toward
30%
highly unequal access to diagnostic tests along socioeconomic lines.
20%
Figure 10 shows the raw association between the number of tests per thousand residents conducted
10% throughout the pandemic in each municipality in the country and a socioeconomic marginalization index.
0 The index includes measures of income poverty, education, residential crowding, rurality, and access to
−10% basic services like electricity and water. As is clear from the graph, the higher level of socioeconomic
exclusion, the less testing has been conducted.
M ala n
ite yz a n
Po ai n
itz do i l
Poland a
Swanc a
kh bi a
Buech a
d B ari a
oa a
Hu Isra a
C ba o
Th nlan g
ov en
w Tai ay
ua ru
Bo dor
d
l
R ium
lia
rw k
lg ile
Ho erm ary
e m
Sl ed e
lg ia
Az Me ivia
Sp es
K y
th er d
rt s
G ng el
Ky O tan
St n
De aila d
nm nd
on nd
Ka olo ijan
Auuga
Sw ing raz
er xic
Fi on
ti
No ar
ng an
er bi
Fr stri
lan
Ze wa
i
Cr aki
d sta
Ne Srlan
Cz uss
Given Mexico’s approach to testing, which requires the presence of symptoms, part of the association
Ec Pe
go
Be Ch
Un rg m
at
za m
l
s
K
may obey to higher levels of transmission in more urban, wealthier municipalities. However, this is only
Ne
ite
Un
a partial explanation. Sharp contrasts exist even within metropolitan areas. For example, the number of
All countries with complete data for 2018, 2019, and 2020 and more than three million population are included. tests in the 16 municipalities of Mexico City averaged 173 per thousand residents from the beginning of
Source: Authors’ calculations based on World Mortality Dataset and Mexico’s Secretariat of Health. the pandemic to January 31 of 2021. By contrast, the 18 adjacent urban municipalities of the State of
Mexico, which are part of the same metropolitan area and together more populated than the city itself,
Figure 8 depicts Mexico’s excess mortality in 2020 in comparison to other countries, using average average only 33 tests per thousand residents during the same period. Most of Mexico City’s lower-
deaths in 2018 and 2019 as a baseline to estimate the score, calculated as observed minus expected income, informal workers live in these municipalities and commute daily to the city on crowded public
deaths, as a share of expected deaths. Figures come from the World Mortality Dataset (Karlinsky and transport.
Kobak 2021). Mexico ranks fourth in a global sample, with about 43% more deaths in 2020 than would have The observed pattern therefore points toward large inequities in access to testing, diagnosis, and proper
been expected relative to the 2018-2019 average, only after Peru, Ecuador, and Bolivia. The average for care along socioeconomic lines. In addition, the possibility of following stay-at-home recommendations
22 23M E X I C O ’ S R E S P O N S E T O C O V I D -1 9 : A C A S E S T U D Y C H A P T E R 1: I N T R O D U C T I O N A N D E P I D E M I O L O G Y
Figure 9. Weekly excess mortality, 2020 Figure 10. Diagnostic tests per population vs. socioeconomic marginalization in Mexico’s
municipalities
200
CDMX (74%) Each circle is a municipality
Edo. Mex. (69%)
Puebla (69%)
Tlaxcala (66%)
Baja California (57%)
Coahuila (55%)
Zacatecas (54%) 27.3
Sonora (53%)
Tests per thousand
Campeche (48%)
Nuevo León (48%)
Aguascalientes (47%)
Morelos (46%)
Hidalgo (46%)
Quintana Roo (46%) 3.6
Querétaro (43%)
Guanajuato (43%)
Tabasco (36%)
Chihuahua (35%)
Tamaulipas (34%)
Durango (32%)
Veracruz (32%) 0
San Luis Potosí (32%) −2 −1 0 1 2
Sinaloa (31%) Municipal marginalization index (log−like transformation)
Baja California Sur (31%)
Yucatán (28%) Axes are in logarithmic scale to normalize variance. Tests are recorded based on patients’ municipality of residence.
Michoacán (28%) Linear prediction with 95% confidence interval.
Jalisco (27%)
Source: Authors’ elaboration based on Dirección General de Epidemiología, Secretaría de Salud (February 26,
Colima (28%)
2020) and Consejo Nacional de Población.
Guerrero (16%)
Nayarit (13%)
Oaxaca (9%) Molina 2021). The INSP’s serological survey showed that presence of antibodies was lowest among those
Chiapas (9%) with a college education (21% versus 27%, 26%, and 24% for those with junior high, high school, and
elementary education, respectively).
People living in municipalities with greater socioeconomic marginalization are also at greater risk of
adverse outcomes (Ortiz-Hernández and Pérez Sastré 2020). Figure 11 shows that among confirmed
0
20
20
20
0
20
20
0
20
02
02
02
20
20
20
20
20
COVID-19 cases, the proportion of deaths tends to increase with the level of marginalization of the
20
r2
g2
c2
ay
jun
jul
ct
ov
ar
ap
de
au
4o
8m
26
m
8n
21
municipality where the patient lives. The unadjusted observed case-fatality ratio is also two times higher for
12
30
13
17
the population who speaks an indigenous language, at 18.3% versus 9%, as of February 26.
Excess deaths are calculated as total deaths from all causes minus expected deaths (90th percentile) according
to observed mortality for 2015−2019. Source: Authors’ elaboration based on data from the Secretariat of Health,
Sharp differences also exist in death rates across health subsystems. Fragmentation in Mexico’s
INEGI, and the National Population Registry. health system has reproduced inequities during the pandemic. On average, 20% of COVID-19 patients
hospitalized in the private sector (typically wealthier citizens) have died, a considerably lower proportion
is strongly segmented by social class. This is reinforced by the lack of economic programs to support than in less well-provisioned and under-staffed public health systems. For reference, the percent that die
isolation and quarantining. An analysis of the spatial distribution of infections in Mexico City, where most among those hospitalized in the United States is 2.4% for the group between 18 and 49 years old, 10% for
health infrastructure is located, suggests that poorer neighborhoods have been most affected (Jaramillo- those 50 to 64, and 26.6% for those 65 or older (CDC).
24 25You can also read