MICHIGAN ASSOCIATION OF COUNTIES - AMERICAN RESCUE PLAN Leverage Federal Dollars to Address
←
→
Page content transcription
If your browser does not render page correctly, please read the page content below
MICHIGAN ASSOCIATION OF COUNTIES
      AMERICAN RESCUE PLAN
       Leverage Federal Dollars to Address
        Recovery & Strategic Investments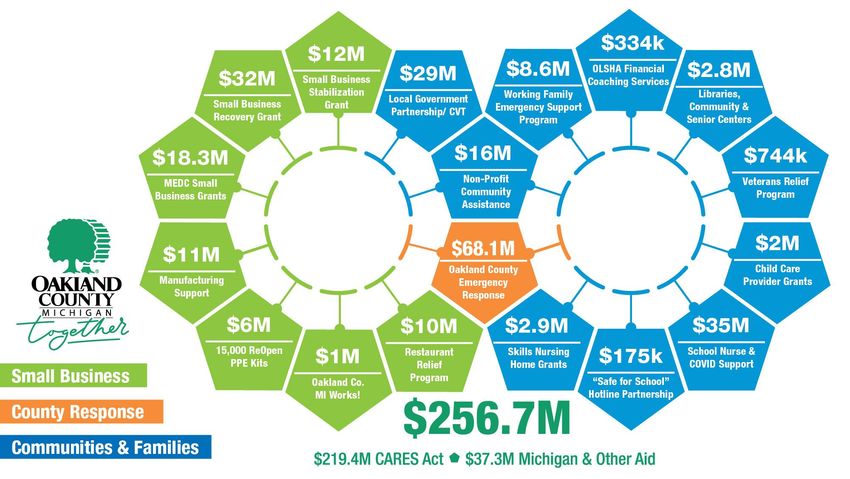
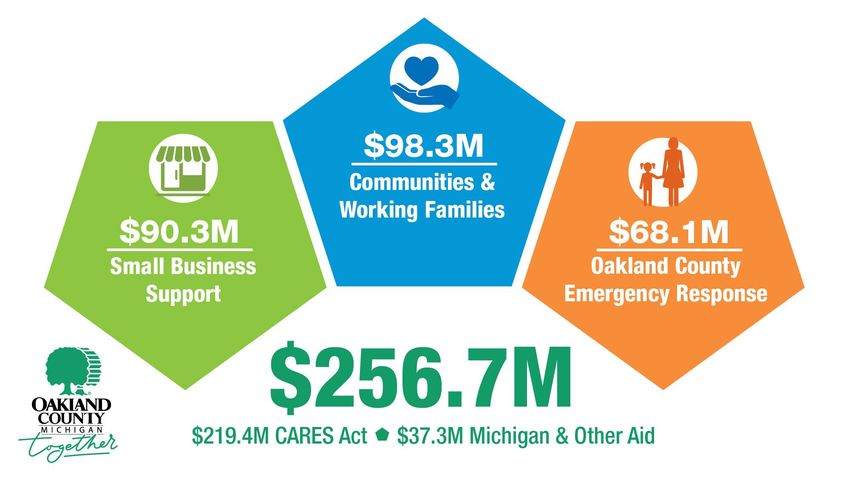
Quick Review: County CARES Act
3
4
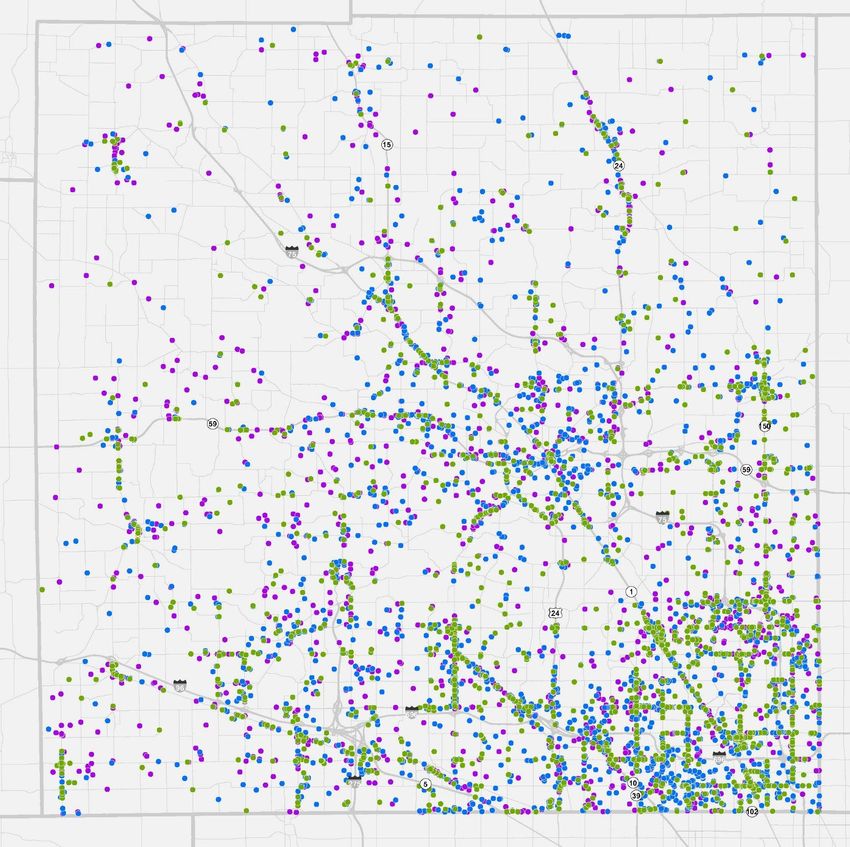
Advantage Oakland – COVID-19 Support Map

https://oakgov.maps.arcgis.com/apps/MapSeries/index.html?appid=9032eba3c2a54f858fe721f762cc2745
REOPEN TOOL-KITS
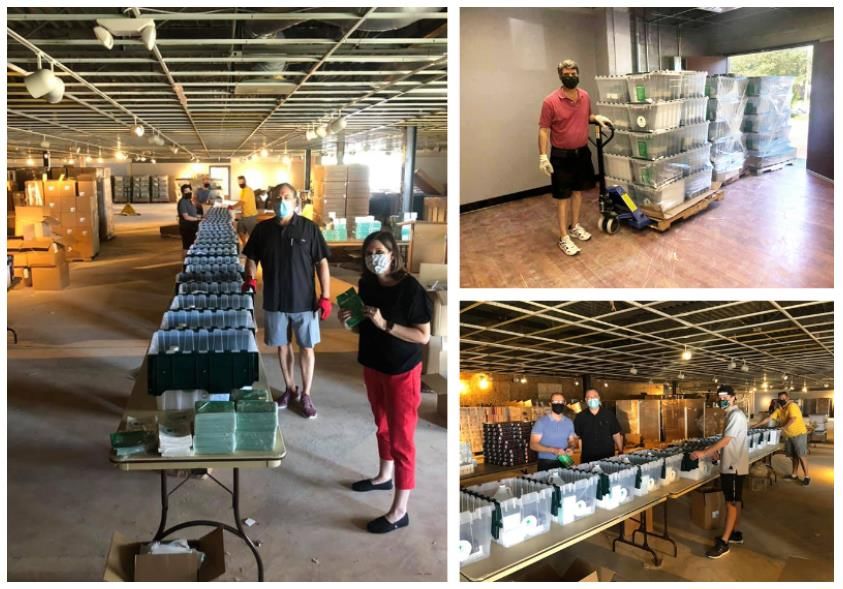
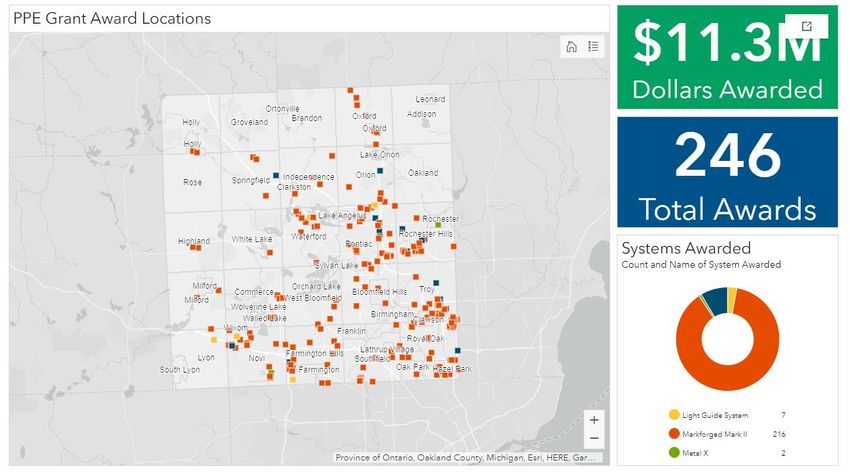
PPE RESILIENCE GRANT – PROJECT DIAMOND
RECOVERY GRANT
CARES Act II
Coronavirus Relief Legislation

Legislation Highlights

                                                                                                                                                                                 AGENCY RESPONSIBLE FOR
ISSUE AREA                         LOCATION IN BILL TEXT                  PROVISION/SECTION SUMMARY
                                                                                                                                                                                 OVERSIGHT/ADMINISTRATION

Additional funding for state and
local governments to address                                              NOT INCLUDED IN THE FINAL BILL
revenue losses

Coronavirus Relief Fund (CRF)                                                                                                                                                    U.S. Treasury Office of the
                                   Division N, Title X, Sec. 1001         Spend date extended until December 31, 2021
Spend Extension                                                                                                                                                                  Inspector General (OIG)
                                                                          Total funding included = $82 billion, funding highlights:
                                                                          •      Governors Emergency Education Relief Fund ($4.05B)

Education Funding (Schools)        Division M, Title III, Sec. 311        •     Elementary/Secondary School Emergency Relief Fund ($54.3B)                                       U.S. Department of Education
                                                                          •     Higher Education Emergency Fund ($22.7B)
                                                                          •     Outlying areas and the Bureau of Indian Education ($818 million)

Employee Retention Tax Credit      Division EE, Title II, Sec. 207        Extends credit until July 1, 2021 and includes higher education and hospitals as eligible              Department of Labor

                                                                          Total funding include = $45 billion, funding highlights:
                                                                          •      Airline payroll support ($15B)
                                                                          •      Airline contractor payroll ($1B)
                                                                                                                                                                                 Federal Aviation Administration,
                                   Division N, Title IV, Beginning Sec.   •      Transit ($14B)
Transportation                                                                                                                                                                   Federal Transportation
                                   401                                    •      State highways ($10B)
                                                                                                                                                                                 Administration
                                                                          •      Airports and airport concessionaires ($2B)
                                                                          •      Private motor coach/school bus/ferry industries ($2B)
                                                                          •      Amtrak ($1B)
                                                                          Total funding included = $166 billion, $600 per person earning up to $75k a year and $1,200 for couples
Stimulus Payments                  Division N, Subtitle B, Sec. 272-273                                                                                                           U.S. Treasury
                                                                          earning up to $150,000 a year.

                                   Division N, Title II, Sub. A, Beginning                                                                                                        Administered through state
Unemployment Insurance                                                     Total funding included = $120 billion, resulting in an additional $300 per week through March 14, 2021
                                   Sec. 200                                                                                                                                       agencies
Coronavirus Relief Legislation
AGENCY RESPONSIBLE FOR
ISSUE AREA LOCATION IN BILL TEXT PROVISION/SECTION SUMMARY
OVERSIGHT/ADMINISTRATION
• First/second forgivalbe PPP loans ($284B) extended through March 31, 2021
DIVISION N, Title III, Beginning • EIDL Grants for businesses in low-income communities ($20B) Small Business
Small Business Assistance • SBA debt relief ($3.5B)
Sec. 301 Administration
• Enhancements to SBA lending ($2B)
• Grants for shuttered venue operators ($15B)
Total funding included = $25 billion
Division N, Title V, Beginning • CDC eviction moratorium extended through January 31, 2021
Rental Assistance U.S. Treasury
Sec. 501
• Native American housing ($800 million)
Total funding included = $69 billion, funding highlights:
• CDC and states for vaccine distribution ($9B)
• Strategic national stockpile ($3B) Health and Human Services,
Centers for Disease Control
Health Care COVID Relief Spending Division M, Title III • Funding directly to states for testing/tracing and COVID mitigation programs ($22B)
and Prevention, National
• Mental health funding ($4.5B) Institutes of Health
• Funding for NIH for COVID-19 research ($1.25B)
• Health care provider support ($9B)
Total funding included = $7 billion, funding highlights:
• Low-income families ($3.2B)
• Tribal broadband ($1B)
• Telehealth funding ($250 million) Federal Communications
Broadband Division N, Title IX, Sec. 901-903
Commission
• Complete broadband maps for dispersing funding to impacted areas ($65 million)
• Small telecom providers for secure equipment ($2B)
• Rural broadband funding grant program ($300 million)
Federal Reserve retains the ability to create emergency lending facilities under Section 13(3) of the Federal Reserve Act. The Federal Reserve is prohibited
Municipal Liquidity Facility Division N, Title X, Sec. 1005 from re-starting the Municipal Liquidity Facility (MLF) but retains the authority of the Board of Governors, in “unusual and exigent circumstances” and Federal Reserve
under other conditions, to authorize Reserve Banks to extend credit to individuals, partnerships, and governments.
Low-income Water Utility Bill Assistance ($638 million) - provides grants to states and tribes who in turn will provide funds to owners or operators of public
Water Division H, Title II, Sec. 503 Department of Labor/HHS
water systems or treatment works to reduce arrearages and rates to low-income households. Three percent of funds will be set aside for tribes.
Division M, Title II, Beginning Total funding included = $2 billion, allocated to Disaster Relief Fund and activates FEMA's Disaster Funeral Assistance program which provides financial aid Federal Emergency
Disaster Assistance
Sec. 201 to those who have lost someone to COVID through the end of 2020. Management Agency (FEMA)American Rescue Plan
Major ARP Programs Include:

                                                                                  Michigan’s
            ARP Federal Programs                 Total Federal Dollars
                                                                                projected share

Economic Impact Payments (direct checks)   $402 Billion                  $~12 Billion

Unemployment benefits                      $205 Billion                  $~10 Billion

Child tax credit                           $90 Billion                   $~3 Billion
Small business programs:                   $62 Billion                   $~2 Billion

    Restaurants                            $28.6 Billion
    Economic Injury Dis. Loans             $15 Billion
    Small Bus. Credit Initiative           $10 Billion
    Paycheck Protection (PPP)              $7.5 Billion
    Shuttered Venue                        $1.25 Billion

Higher Ed. Emergency Relief                $40 Billion                   $1.2 Billion

Total Federal directed funds               $800 Billion                  $~28 Billion
ARP: State, School, Local Funding Select State & Local Programs ARP Funding ESSER II Funding Michigan – state funding $5.6 Billion - Oakland Co. – K-12 education funding $178 Million $79 Million Oakland Co. – local CVT funding $155 Million - Oakland Co. – local county funding $244 Million -
Eligible Funding Guidelines
Awaiting Further Guidance from U.S. Treasury

 •   Funds must be used by December 31, 2024
 •   To respond to the public health emergency with respect to the Coronavirus Disease
     2019 (COVID–19) or its negative economic impacts, including assistance to households,
     small businesses, and nonprofits, or aid to impacted industries such as tourism, travel, and
     hospitality
 •   To respond to workers performing essential work during the COVID–19 public health
     emergency by providing premium pay to eligible workers of the local government that are
     performing such essential work, or by providing grants to eligible employers that have
     eligible workers who perform essential work.
 •   For the provision of government services to the extent of the reduction in revenue of such
     local government due to the COVID–19 public health emergency relative to revenues
     collected in the most recent full fiscal year of the local government; or
 •   To make necessary investments in water, sewer, or broadband infrastructure.

                                                                                               16
Ineligible Funding Guidelines
• PENSION FUNDS - No metropolitan city, nonentitlement unit of local government, or county
may use funds made available under this section for deposit into any pension fund.
• TRANSFER AUTHORITY – A metropolitan city, nonentitlement unit of local government, or
county receiving a payment from funds made available under this section may transfer
funds to a private nonprofit organization (as that term is defined in paragraph (17) of section
401 of the McKinney-Vento Homeless Association (42 U.S.C. 11360(17)), a public benefit
corporation involved in transportation of passengers or cargo, or a special-purpose unit of
State or local government.
17Oakland County Process: ARP Funding
SHORT MEDIUM LONG
ONGOING
TERM TERM LASTING
• Maximize all money • Cover public health • Coordinate with State, • Solicit and evaluate
available from ARP expenses and county Region, and Local transformational
programs to individuals, operations to accelerate government on priorities Initiatives that have long-
small businesses, vaccine distribution not and synergies. lasting impact based on
childcare providers, non- provided for in December data and return on
profits and others. legislation. investment principles.
•Identify and support any
immediate and short-
term economic
stabilization & recovery
needs that exist.
Note: Keep future $2 trillion infrastructure package in mind.
18Part One: Economic Recovery
• Where is the county recovery today?
• How are Oakland County families, children and individuals doing?
• How are various business sectors recovering?
• How is the non-profit sector recovering?
• What about local government, schools and public institutions?
19Monthly Unemployment Rate (Jan 2020 – Current)
Oakland County Unemployment Rate, Jan 2020 - Current
Percent
24
22
20
20.3%
18
16
14
12
10
8
6
4
3.2%
2
Jan-20 Feb-20 Mar-20 Apr-20 May-20 Jun-20 Jul-20 Aug-20 Sep-20 Oct-20 Nov-20 Dec-20 Jan-21 Feb-21
Oakland County Monthly unemployment rate Michigan monthly unemployment rate
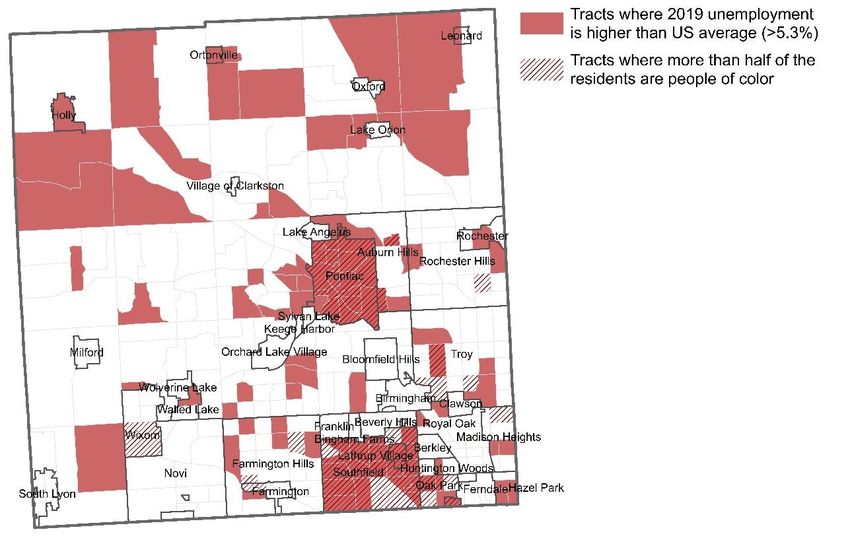
20Unemployment OBSERVATIONS:
• As of February, Oakland County’s unemployment
rate has returned to pre-pandemic levels.
• 3.1% in 2020
• 3.2% in 2021
• Oakland County’s unemployment rate is the 5th
lowest among Michigan counties.
• Among 25 peer counties across the country,
Oakland County ranks 11th.
• According to 2019 census data, 28% of the
county’s population (or 350,000 residents in 100
census tracts) live in areas where the
unemployment rate is higher than US average.
• More than 10% of the county’s population lives in
tracts (38 tracts) where unemployment is higher
than US average, and more than half of
residents in these tracts are people of color.
Source: US Census ACS Five-Year Data, 2019 provided by AECOM
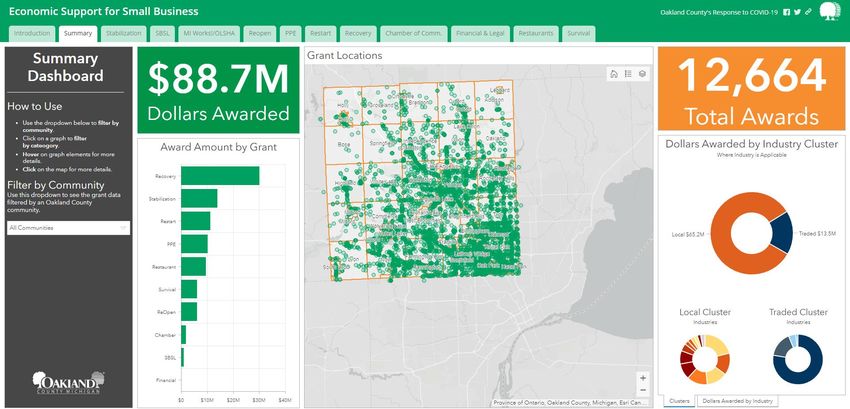
21Small Business Impact: % Change in Open
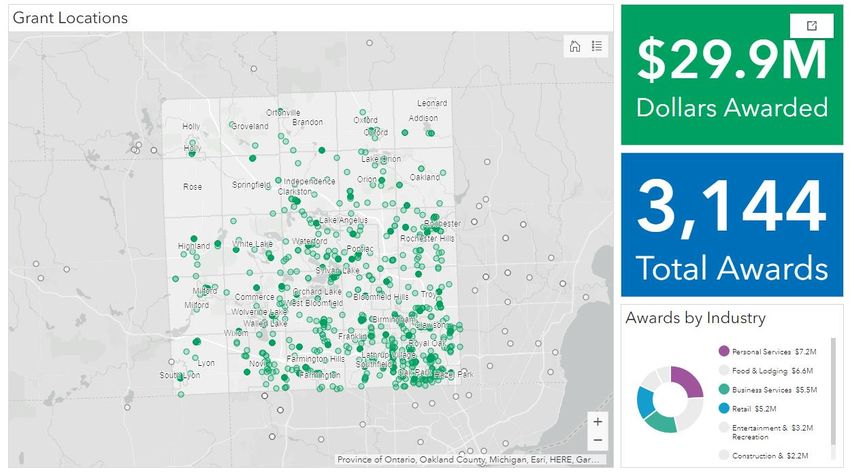
22Small Business COVID Grants: Application Demand
Grant Program Applications Received Grant Awards
2021 – Survival Grant 6,485 1,380
2020 – Recovery Grant 4,216 3,144
2020 – Resilience Grant 521 256
2020 – Stabilization Grant 7,242 3,527
23Economic Relief
& Small Business
Grant Awards
$12M Stabilization Grants
$32M Recovery Grants
$10M Resilience Grants
24PPP Loan/Grant Coverage in Oakland County
Oakland
PPP Loan Range
County
$150–$350,000 2,473
$350,000 – $1 million 1,379
$1 – $2 million 394
$2 – $5 million 190
$5 – $10 million 41
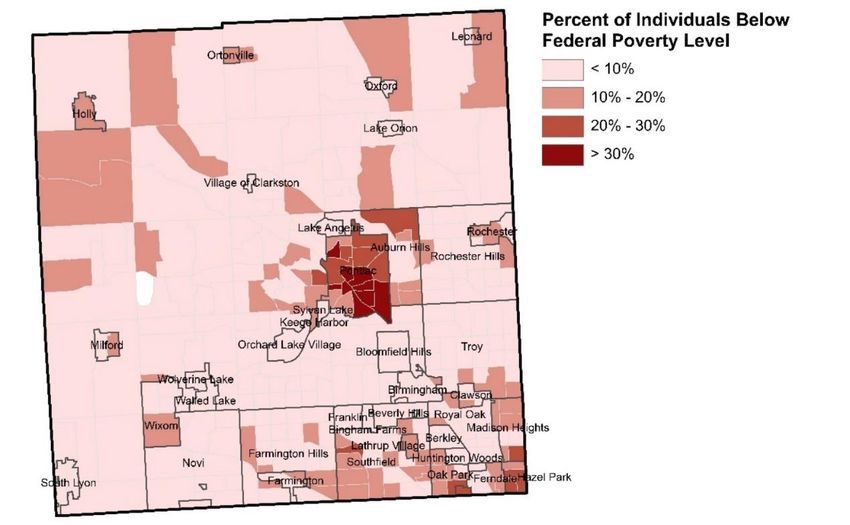
County Total 4,477Poverty OBSERVATIONS:
• The County’s overall poverty rate is 8.0%; down
from 10% in 2019
• Oakland County’s poverty rate is the 4th lowest
among Michigan counties.
• Among 25 peer counties across the country,
Oakland County ranks 9th.
• Oakland County’s child poverty rate is 9%. 4th in
the state and 7th among peer counties.
• 17.7% live below 185% of the federal poverty
threshold.
• 7.4% of all Oakland County census tracts (25
tracts) are considered areas of concentrated
poverty – representing about 7% of the County’s
total population, or 87,000 residents.
• As of 2019 the federal poverty level was
Source: US Census ACS Five-Year Data, 2019 provided by AECOM
approximately $13,000 for an individual and
$20,000 for a family of three.
26Part Two: Building the Future • Review County’s Overall Indictors of Well-being • Leverage generational dollars from state, county and local communities • Discuss principles for transformational initiatives that create long lasting growth • Identify target areas • Review disparities within the Indicators • Identify gaps in information • Discuss potential with state, regional and local partners • Keep future $2 trillion infrastructure package in mind
INDICATORS OF OVERALL COUNTY WELL-BEING
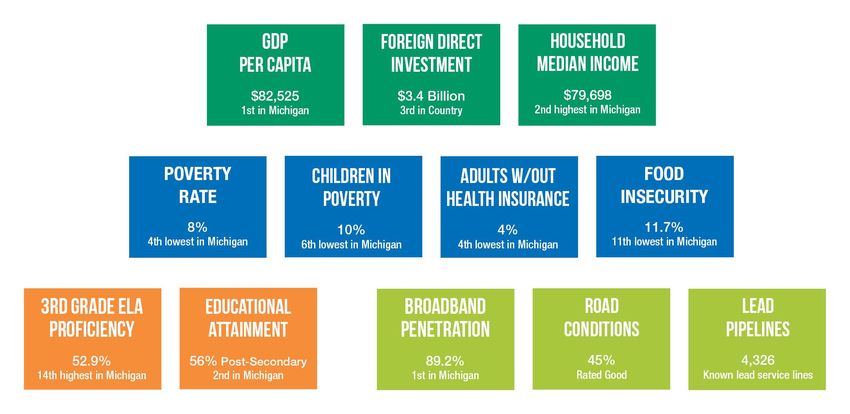
28Gross Domestic Product
• Oakland County’s GDP is first in the state and is 21% of
Michigan’s real GDP.
• Oakland County has approximately 767,000 total jobs.
• 74.2% are service producing jobs
• 21.6% are goods producing jobs
JOB GROWTH 2010-2020
Michigan 8.6%
United States 11.8%
Oakland
14.1%
County
0.0% 5.0% 10.0% 15.0%
29
Source: EMSI, 2021 provided by AECOM“In our view, Oakland County’s recent
Oakland County success has reflected the diversification of
Economic Outlook the county’s economy toward future growth
sectors, which has been enabled by the
2020-2022
county’s well-educated labor force.”
2020-2022 Economic Outlook Report • University of Michigan
Research Seminar in Quantitative Economics, Department of Economics
OAKLAND COUNTY
UNEMPLOYMENT RATE
February 2020: 3.1%
February 2021: 3.2%
Source: Michigan Bureau of Labor Market Information and Strategic Initiatives
Source: University of Michigan, September 2020 30Economic Stability Jobs by NAICS Industry Sector
Agriculture, Forestry, Fishing and Hunting
2020 Jobs 2020 Share
719 0.1%
2010 - 2020
Change
163
Mining, Quarrying, and Oil and Gas Extraction 194 0.0% 49
Utilities 1,539 0.2% 194
Construction 27,428 3.8% 9,334
Manufacturing 64,800 8.9% 15,380
Wholesale Trade 36,819 5.0% 5,599
Retail Trade 74,450 10.2% 2,707
Transportation and Warehousing 13,102 1.8% 5,733
Information 14,423 2.0% -1,682)
Finance and Insurance 43,223 5.9% 7,190
Real Estate and Rental and Leasing 16,934 2.3% 1,593
Professional, Scientific, and Technical Services 101,531 13.9% 18,553
Management of Companies and Enterprises 18,650 2.6% 7,995
Administrative and Support, Waste Management and
56,589 7.8% 2,830
Remediation
Educational Services 12,095 1.7% 303
Health Care and Social Assistance 103,892 14.2% 10,457
Arts, Entertainment, and Recreation 9,541 1.3% 448
Accommodation and Food Services 54,127 7.4% 7,641
Other Services (except Public Administration) 29,377 4.0% 2,705
Government 47,960 6.6% -4,269
Source: US Census OntheMap 2018, EMSI 2020 provided by AECOM Unclassified 1,965 0.3% 1,915
Total 729,357 100.0% 94,838
INITIAL OBSERVATIONS:
• Business Development focus has been in the areas of manufacturing, professional, and general labor creating entry level positions, centered around
highly affluent areas of the county as seen in the map above. There is an opportunity to focus on small businesses, health, social and the retail sector
business that are specially spread throughout the county. This will also benefit rural areas where residents under the age of 65 and higher levels of
veterans reside.
• Educational tracks provided from the U.S. Census Bureau’s American Community Survey (ACS) 2017 have shown opportunities to expand entry level
positions into the northern part of the county where higher than U.S. average unemployment sourced from ACS five-year data 2019. 31Industry Diversity Snapshot
32OBSERVATIONS:
Education Attainment • 46% of Oakland County residents have a
Bachelor’s Degree or Higher. This is 2nd in the
State. If you add in Associates, we move to 56%
and credentials we move to 61%.
• Among 25 peer counties across the country,
Oakland County ranks 10th tied with 3 other
counties.
• Oakland County has a goal of 80% of adult
residents with a post-secondary degree or
credential by 2030.
• Disparities also need to be addressed:
• The map shows that some census tracts in more
rural areas, such as Groveland and Rose
Township, have significantly lower rates of
college attendance as a percentage of the
population by census tract, around 10-20%.
• A breakdown by race of educational outcomes
illustrates disparities, primarily related to college
attendance rates. 46.9% of white residents have
a BA or higher, while among Black residents
32.2% have a BA or higher. For Hispanic/Latino
Source: ACS 2018 (5-years estimates) provided by AECOM
individuals this rate is 36.4%, and for indigenous
individuals (American Indian or Native Alaskan) it
is 26.2%.
33Infrastructure • Keep future infrastructure package in mind
OBSERVATIONS:
Broadband Penetration                                   • The highest rates by census tract of no internet
                                                          at home are found in Pontiac, Southfield, and
                                                          Ferndale (up to 68%). Since these tracts
                                                          correspond primarily to urban rather than rural
                                                          areas, lack of access could be due to cost,
                                                          computer literacy or device access rather than
                                                          lack of infrastructure.

 Source: ACS 2018, 5-year estimates provided by AECOM

                                                                                                      35
Road Conditions
The Road Commission of Oakland
County (RCOC) predicts that our
roads will get to 51% good by 2025,
and then, based on current funding
levels will begin to again deteriorate.
36Sewers and Lead Pipelines LEAD SERVICE LINES
• 4,326 known lead service lines in 20 communities
• 1,011 galvanized pipe located in 7 communities
• 16,926 lines that have not been identified but are
likely to contain lead in 12 communities
LEAD LEVELS
Five water systems servicing approximately 98,000
people in Oakland County with water quality test
results indicating lead levels of 15 parts per billion or
above, triggering an Action Level Exceedance (ALE)
with corrective actions.
Community Lead Parts per Billion
Ferndale – 6th highest in Michigan 28ppb
Royal Oak Township 22ppb
Hazel Park 18ppb
Milford/Ridge Valley System
Royal Oak City 15ppb 37Oakland County Principles on Transformation (For Discussion)
✓ Does the Investment Target Area of Long-term Need,
TRANSFORMATIONAL Leverage a County strength, and/or Economic Potential?
RATIONALE
✓ Does the Investment Target Elimination of Barriers and/or
Reduction in Disparities?
MEASURABLE
✓ Pilot programs for duration of ARP acceptable in priority
EFFECTIVENESS area (ie, Oakland80) only; most should not add to county
operational costs outside of the ARP window.
OUTSIZED ✓ What is the projected Return on Investment? Does it
IMPACT leverage other private or public funds? Does if free up
additional resources?
38Financial Contractors
Pierce Monroe
Ernst and Young
and Associates
Guidehouse40
You can also read