MIDYEAR OUTLOOK 2021 LPL RESEARCH
←
→
Page content transcription
If your browser does not render page correctly, please read the page content below
LPL RESEARCH
MIDYEAR OUTLOOK 2021: POLICY

                               MIDYEAR OUTLOOK 2021
                               PICKING UP SPEED

                               INTRODUCTION
                               In the first half of 2021, the U.S. economy powered forward faster than nearly anyone had
    Speed can be               expected. As we were writing our Outlook for 2021 in late 2020, our economic views were
    exhilarating, but it can   significantly more optimistic than consensus forecasts—but in retrospect, not nearly
    also be dangerous.         optimistic enough. Our theme was getting back on the road again and powering forward.
    The second half of         But as the economy accelerates to what may be its best year of growth in decades, power
    2021 may be a fast         has been converted to speed and we’re trading highways for raceways.
    one and will have its         Speed can be exhilarating, but it can also be dangerous. Traffic becomes a test of
    share of opportunities,    nerves. Turning a sharp corner creates added stress on drivers. Tires wear, and engines
    but the pace of            can overheat. As we look ahead to the second half of 2021, and even into 2022, we see an
    reopening also creates     economy still on the move before it slowly starts to settle back into historical norms. The
                               speed is thrilling and the overall economic picture remains sound, likely supporting strong
    new hazards.
                               profit growth and potential stock market gains. But the pace of reopening also creates
                               new hazards: Supply chains are stressed, some labor shortages have emerged, inflation is
                               heating up—at least temporarily—and asset prices look expensive compared to history.
                                  Markets are always forward looking, and in LPL Research’s Midyear Outlook 2021: Picking
                               Up Speed, we help you keep your eyes on the road ahead. We focus on the next 6–12
                               months, when markets may be looking at which latecomers to the rally have the strength
                               to extend their run and whether there may be new beneficiaries of the global reopening.
                               But smart investors are always looking even further ahead, beyond the next curve, next
                               lap, or even next race. Sound financial advice remains the key to durability. So, buckle your
                               seatbelt and tune up your portfolio. The next stretch may be a fast one with new risks to
                               navigate, but it’s still just another step toward meeting your long-term financial goals.

1   Member FINRA/SIPC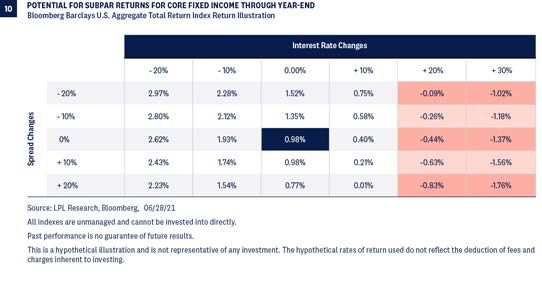
MIDYEAR OUTLOOK 2021: INTRODUCTION

INTRODUCTION: WHERE WE ARE
ECONOMY: The country has reopened, and the growth rate of the           STOCKS: The second year of a bull market is often more
U.S. economy may have peaked in the second quarter of 2021, but         challenging than the first, but historically still usually produces
there is still plenty of momentum left to extend above-average          gains. Economic improvement should continue to support S&P 500
growth into 2022. We forecast 6.25–6.75% U.S. gross domestic            Index earnings, which had a stunning first quarter. While valuations
product (GDP) growth in 2021, which would be the best year in           remain somewhat elevated, we think they look reasonable after
decades. We continue to watch inflation closely but believe recent      considering still low interest rates and earnings growth potential.
price pressures are transitory and will begin to work their way off     Our 2021 year-end S&P 500 fair-value target range of 4,400–4,450
gradually later in the year. On average, U.S. expansions since WWII     is based on a price-to-earnings ratio (P/E) of 21.5 and our 2022 S&P
have lasted five years and much longer over the last few decades.       500 earnings per share (EPS) forecast of $205.
There’s nothing on the horizon to indicate the current expansion
                                                                        BONDS: Inflationary pressure and economic improvement may
can’t reach that mark.
                                                                        put additional upward pressure on the 10-year Treasury yield, and
POLICY: The economy was supported through the pandemic by               we continue to see the 10-year yield finishing 2021 in the range
more than $5 trillion in stimulus measures and extraordinary            of 1.75–2.00%. Such a move would leave core investment grade
support by the Federal Reserve (Fed). Policy will take a back seat in   bonds near flat over the rest of the year. Nevertheless, bonds still
2021 as private sector growth replaces stimulus checks. Tax policy,     can play an important role in a portfolio as a source of income and
though, remains a concern. Historically higher personal tax rates       as a diversifier during equity market declines. We are also closely
have had only a modest impact on markets, but higher corporate          watching the Fed, which may announce plans to reduce its bond
taxes would have a direct impact on earnings growth, potentially        purchases later in the year.
limiting stock gains.

2   Member FINRA/SIPC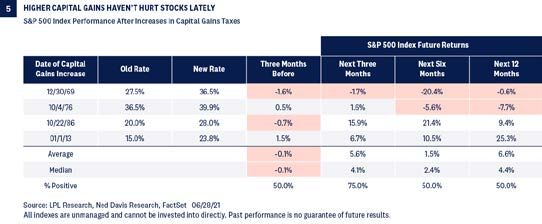
MIDYEAR OUTLOOK 2021: ECONOMY

ECONOMY: SPEEDING AHEAD
The U.S. economy has surprised nearly everyone to the upside            With various measures of output matching or exceeding pre-
as it speeds along thanks to vaccinations, reopening, and record      pandemic levels, it’s clear last year’s recession is in the rear-view
stimulus. All have combined to produce what should be one of the      mirror, and it may go down as the shortest one in history—even
best years for growth ever.                                           shorter than the six-month recession from the early 1980s.
   Despite the natural challenges of ramping back up, the recovery      Globally, Europe and Japan have been slower to move past the
still seems capable of providing upside surprises. As a result of     pandemic, but explosive growth may be forthcoming once they do.
the strides made toward full reopening, rapid vaccine distribution,   Meanwhile, emerging markets continue to be a source of solid global
massive stimulus efforts, and support from the Fed, we maintain       growth, with several Asian emerging markets being among the first
our 2021 forecast for U.S. GDP growth of 6.25%–6.75%. Last year’s     to recover from the pandemic, though growth in the United States
3.5% drop in GDP, the worst year since the Great Depression, may      will likely be stronger [Figure 1].
not be forgotten—but it has been left in the dust of 2020.

3   Member FINRA/SIPC
MIDYEAR OUTLOOK 2021: ECONOMY
This Economic Cycle Is Only On Its First Lap Because the recession last year was likely the shortest ever, and
Since World War II, economic expansions have lasted an average the economy was supported by historic stimulus, some imbalances
of five years, with the four most recent cycles going even longer. weren’t worked off like we tend to see in a normal recession.
Before the pandemic, the most recent expansion was the longest Corporate debt levels remain high, supported by low interest rates,
ever at 11 years and might have gone on even longer if COVID-19 and stock valuations never really reset. The good news is this new
hadn’t struck. However, this cycle may not continue as long as the cycle of growth probably has enough going for it to be at least
last one, considering this wasn’t your average recession. average, which would still give it another four years [Figure 2]. And
there’s nothing wrong with being average!
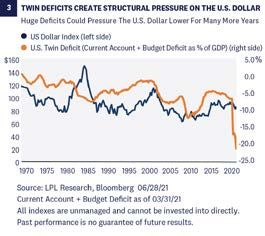
The U.S. Dollar May Struggle to Keep Up
We came into 2021 expecting a weaker U.S. dollar and that is what’s
happened, but we think many more years of weakness could be
in the cards. We view the “twin deficits” of the U.S. economy—the
combination of the budget deficit and the current account deficit—
as a long-term structural driver that continues to put pressure on
the greenback versus major global alternatives. As a historical net
importer, the U.S. has usually carried a trade deficit, while the flood
of pandemic aid has stretched the budget deficit and ballooned
the sum of the twin deficits to all-time highs, as a percent of
GDP [Figure 3].
The Fed has been very clear with its dovish stance for a long
time, which should be another tailwind to a lower-trending
dollar. The dollar also has moved in cycles that last for years. It’s
currently in the midst of a lower cycle—having made major peaks
in 1985, 2001, and 2017, with years of dollar weakness after the
peaks—suggesting continued weaker dollar action could be ahead.
4 Member FINRA/SIPC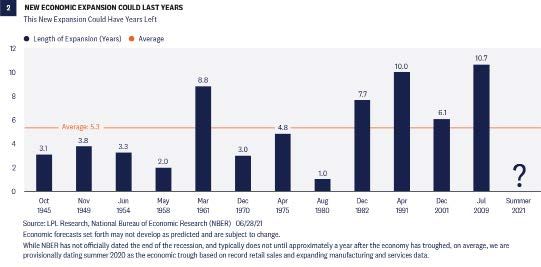
MIDYEAR OUTLOOK 2021: ECONOMY

   A potentially weaker U.S. dollar would have several benefits,        that kept a lid on inflation for much of the past decade are still
including boosting profits for multinational corporations and           in place. Technology, globalization, the Amazon effect, increased
enhancing returns on international investments for dollar-based         productivity and efficiency, automation, and high debt (which puts
investors. The flipside is a drastically lower dollar could be          downward pressure on inflation) are among the major structural
inflationary, driving prices of commodities and imported                forces that have put the brakes on inflation for more than a decade
goods higher.                                                           already and will likely continue to do so.

Inflation Running Hot
Inflation has been the buzzword of 2021 so far. With record fiscal
stimulus, supply chain bottlenecks, semiconductor shortages, a              Dr. Copper Puts The Pedal To The Metal
potentially tightening labor force, and an economy nearly fully             It is said that copper has a Ph.D. in economics because of
open, the threat of inflation is very real. Given the core Consumer         its ability to predict turning points in the overall global
Price Index (CPI) (excluding volatile food and energy) in May soared        economy. Copper is used in everything from homes, to
to its highest year-over-year change since 1992, the threat of higher       cars, to power generation, to even jewelry. If the global
inflation is no doubt real. Many worry the Fed is behind the curve          economy is strong, copper will also be strong.
and will be forced to hike rates sooner and more aggressively to                Copper recently broke out to new all-time highs, after
prevent runaway 1970s-style inflation, though we don’t share                trading in a trading range for nearly 15 years. In the mid-
these worries.                                                              2000s copper also broke out to new highs after trading in
   It makes sense that we would see historically high inflation over        a range for nearly 15 years. It went on to gain more than
the summer months for the simple fact that a year ago at this time          150% in less than two years. Should copper do anything
CPI was negative three months in a row during the shutdowns,                like that again this time, it will likely be another sign of a
elevating the year-over-year comparisons.                                   healthy global economy.
   Higher inflation will likely be “transitory” before things get
back to normal later this year. Don’t forget that structural forces

5    Member FINRA/SIPC
MIDYEAR OUTLOOK 2021: POLICY

POLICY: TAKING A BACKSEAT
During much of 2020 and early 2021, markets have been focused            non-defense each contributing about half of that amount. Federal
on fiscal policy due to massive government efforts to help the           spending has not contributed more than 0.5% to GDP growth since
economy speed past the impact of COVID-19 restrictions. Policy still     1986, and even in 2020 only contributed 0.29%. Stimulus was more
matters, but it will matter far less to markets over the rest of 2021    about borrowing than government spending.
despite some important debates going on in Washington. Markets              But even a small contribution to GDP growth can be massive
may anticipate an increase in government spending if Congress            in absolute terms. With proposals for the two pieces of the Build
passes some version of the Biden administration’s Build Back Better      Back Better plan at near $4 trillion–$1.8 trillion for the American
initiative, but it will likely be spread out over almost a decade. The   Families Plan and over $2 trillion for the infrastructure bill (known
biggest risk may be around taxes, with businesses and wealthy            as the American Jobs Plan)—higher taxes would be needed to
households both facing the prospect of a higher tax burden to pay        help finance the new spending. Let’s be clear, with a 50/50 Senate
for the plan and help manage the deficit.                                (Vice President Kamala Harris breaks ties) and the historically slim
                                                                         Democratic majority in the House, we think these final numbers will
Federal Spending Unlikely To Change Market Trajectory                    likely come in at $2–2.5 trillion combined, as these initial numbers
Much of the approximately $5 trillion in direct COVID-related            from the Democrats are starting points for negotiations.
stimulus in 2020 and 2021 did not flow through directly as
government spending. Instead, the federal government used its            Taxes May Change Market Path, But Not Direction
borrowing power to distribute funds to households and businesses.        Federal spending is generally funded by taxes or debt, and the
That impact will fade over the remainder of the year, but will be        Biden administration plans to raise taxes to help pay for the Build
replaced by the private economy accelerating, which is where we          Back Better initiative. President Biden has proposed increasing
would want it to be.                                                     taxes on both corporations and wealthier households, including
   Actual government spending may continue to grow, but the direct       an increase in the capital gains tax (the tax on investment profits).
payments will likely end and the rate of growth will not make a large    Markets so far have taken the proposed changes in stride, due to
difference to overall output. According to the Bureau of Economic        expectations that the proposed tax increases will be reduced during
Analysis, federal spending added an average of about 0.15% per           negotiations and that the economy will be strong enough to absorb
year to GDP growth between 2000 and 2020, with defense and               the impact.

6   Member FINRA/SIPC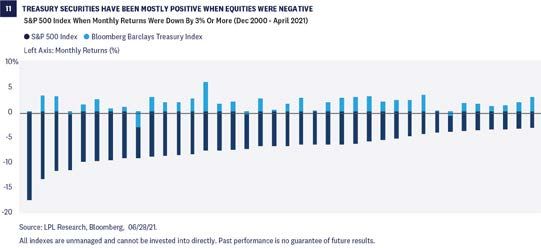
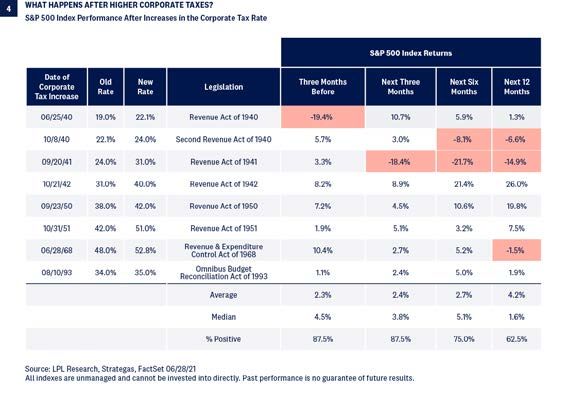
MIDYEAR OUTLOOK 2021: POLICY

   The Tax Cut and Jobs Act (TCJA), signed into law by former         we believe the more likely outcome is that we see the rate end up
President Trump in December 2017, reduced the top tax rate on         closer to 25%. The negative news for markets is that corporate
corporations from 35%, where it had been since 1993, to 21%. The      earnings growth will take an approximately proportional direct hit.
top U.S. statutory corporate tax rate had not been under 30%          Since the stock market is fundamentally driven by earnings, the tax
since the 1940s prior to the TCJA. There were also other structural   impact will likely be a headwind for equity markets. On the positive
reforms included, such as changes to the way US corporate profits     side, this move has been anticipated for quite some time and should
from abroad are taxed in an attempt to make U.S. companies            not be much of a surprise to markets. Further, excluding the rate
more competitive.                                                     introduced by the TCJA, this will still be the lowest tax rate in about
   President Biden has proposed increasing the corporate tax rate     70 years. Historically, markets have absorbed higher corporate tax
to 28%, but that should be viewed as a bargaining position and        rates, although with below-average returns [Figure 4].

7   Member FINRA/SIPC
MIDYEAR OUTLOOK 2021: POLICY

While we don’t think higher rates would be retroactive, they could      Looking at history, capital gains taxes did increase in 1986 and
take away some of the momentum from recent upside surprises in       2013, but the economy was on a firm footing, compared with the
earnings growth that we’ve seen so far in 2021 and contribute to a   1970s hikes, which saw an economy marred by higher inflation and
choppier market.                                                     sluggish growth. Not surprisingly, the two more recent hikes saw
  Proposed tax provisions to raise funds for Build Back Better on    solid stock market performance, while the 1970s hikes didn’t
the household side include increasing the top tax rate on ordinary   [Figure 5]. Is it as simple as how the economy is doing? Policy
income to 39.6% from 37%, and capital gains and taxes on those       matters, but broader economic trends matter more. If we see a
who earn more than $1 million to a maximum of 43.4% from the         capital gains tax increase, we do expect some investors may rotate
current 23.8%. Fun statistic: Only 0.32% of the population makes     out of equities and seek more tax-friendly opportunities—but at the
more than $1 million a year, so the truth is this won’t impact the   cost of accelerating capital gains. Long-term investors may simply
other 99.68% of the population.                                      wait out the new rate, on expectations that it may be changed again
                                                                     by a subsequent administration.

8   Member FINRA/SIPC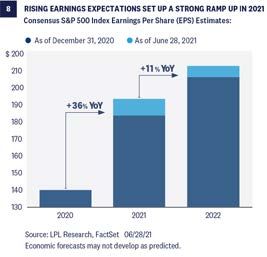
MIDYEAR OUTLOOK 2021: STOCKS
STOCKS: GAINING GROUND
We expect the strong economic recovery to continue to drive 2020 lows through June 28, 2021—stock prices reflect a lot of good
strong earnings growth and support further gains for stocks news. As inflationary pressures build and interest rates potentially
[Figure 6]. However, after one of the strongest starts to a bull rise further, the pace of stock market gains may slow.
market in history—including a nearly 90% gain off the March 23,
History Doesn’t Repeat But It Often Rhymes
Although no one would argue that this cycle looks like any other we
have experienced in modern history, studying the second years of
historical bull markets—as we also did in our Outlook 2021—can
be instructive.
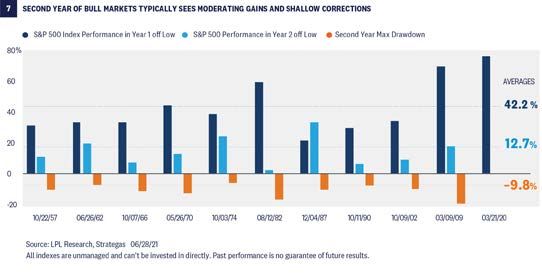
Looking back at all of the bull markets since 1950, the average
S&P 500 gain during the second year has been about 13%
[Figure 7]. Achieving that return would put the index slightly over
4,400 and within our target range. However, when focusing on bull
markets that followed 30% or greater declines, as the current one
did, the average gain during the second year has actually been 17%.
Following that pattern would put the index near 4,600 and well
above the high end of our year-end fair value target range.
9 Member FINRA/SIPCMIDYEAR OUTLOOK 2021: STOCKS
Volatility May Increase Reflecting the tremendous strength in corporate profits, our
Looking at pullbacks (5-10% decline) and corrections (10–20% forecast for S&P 500 earnings-per-share (EPS) in 2021 is $195, a
decline) during the second years of historical bull markets, we 36% increase from 2020, and up from our $165 estimate at the start
can get an idea of the type of volatility the stock market might of the year. We believe our forecast, which is above with the current
experience in the second half of 2021 or early in 2022. The average consensus estimate, is reasonable given the strong economic
maximum drawdown for the index during those two-year-old bull growth outlook and massive amount of fiscal stimulus still working
markets has been about 10%. In the second year of the 2009 bull its way through the economy. We expect corporate America to build
market, the index corrected about 17% [Figure 7]. on its strong earnings performance in 2022. Our 2021 year-end S&P
Given the jolts from the reopening and the stimulus still working 500 fair-value target range of 4,400–4,450 is based on a PE of 21.5
its way through the economy, pullbacks may be short lived and and our 2022 S&P 500 EPS forecast of $205.
corrections less severe. Inflation that proves longer lasting than While the economic recovery looks very likely to drive strong
the Fed expects, which could drive interest rates sharply higher, revenue growth, inflation could present risk to corporate profit
ranks at the top of the list of potential causes of a correction. Tax margins and weigh on earnings. Companies may see upward
increases, COVID-19 spread outside the U.S., and geopolitics are pressure on wages if the labor market tightens further as more of
among other possible bumps in the road. the economy reopens. Supply shortages, higher commodity prices,
and rising borrowing costs could also erode the profitability of
Earnings Outlook Gathers Steam U.S. companies. And U.S. businesses are closely monitoring policy
Coming off a stunning first-quarter earnings season with one of developments, as a potential increase in the corporate tax rate
the biggest upside surprises ever recorded, corporate America is would have immediate impact on their bottom lines.
firing on all cylinders. Not only are earnings expected to ramp up
significantly over the remainder of 2021 as the economic rebound Low Interest Rates Providing Support For Valuations
continues, but estimates have risen significantly since the start of Strong earnings have helped stocks grow into their valuations but
the year [Figure 8]. based on the most common valuation metrics such as the price-to-
earnings ratio (P/E), stock valuations remain elevated. The S&P 500
Index is trading at a forward P/E of 21 times the consensus earnings
estimate for the next 12 months, above the post-1980 average of 17
(source: FactSet).
But when incorporating interest rates to get a more complete
picture, we find stocks are actually reasonably priced. Based on
2021 forecasts, the S&P 500 earnings yield (the inverse of the price-
to-earnings ratio) is about three percentage points higher than the
10-year Treasury yield, or the “earnings” that Treasuries generate.
This “equity risk premium” is well above the long-term average of
0.8%, indicating stocks are cheaper than bonds on an apples-to-
apples basis.
If inflation risk remains manageable through year-end, as we
expect, and yields rise only gradually, we would expect earnings
growth to continue to support stock market gains.
10 Member FINRA/SIPCMIDYEAR OUTLOOK 2021: STOCKS
The Road Ahead Door is Open for Developed International
We expect additional gains for stocks in the second half of the year, The improved value-style performance has opened the door for
but they are likely to come at a slower place and with more bumps developed international stocks to potentially outperform U.S.
along the way as inflation picks up and concerns about the Fed stocks for the first time in over a decade. The recovery the U.S. is
pulling back monetary support intensify. currently experiencing from COVID-19 still lies ahead for Europe
and Japan.
Style Rotation May Have Room to Run
The economy’s transition to a durable and lasting expansion Emerging Markets Face More Headwinds
positions cyclical stocks to outperform defensives in the second As the developed world continues to recover from the pandemic,
half of the year. In this environment, the value style will likely emerging markets may lose some relative appeal. While valuations
outperform growth and the financials, industrials, and materials are attractive and the U.S. dollar may weaken, geopolitical and
sectors may be positioned for solid gains, though the growth style regulatory threats may limit gains for the China-heavy emerging
won’t go quietly given technology’s tremendous earnings power. markets index.
Small Caps For Early Cycle
Small cap stocks historically have outperformed early in bull
markets. Small cap valuations are still reasonable despite strong
gains since March 2020, in our view, supported by a strong
earnings rebound.
11 Member FINRA/SIPCMIDYEAR OUTLOOK 2021: BONDS
BONDS: SAFETY FEATURES
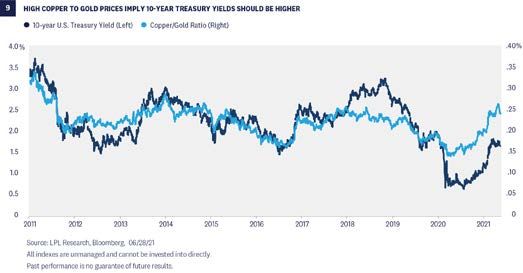
Interest rates have moved off their historically low levels to start increased due to the strengthening of the global economy, 10-year
the year, but we believe they can still go higher. Higher inflation Treasury yields haven’t quite kept up. While not a perfect predictor,
expectations, the strong economic recovery, less involvement in the copper/gold ratio has been a reliable one and suggests interest
the bond market from the Fed (more on this below), and a record rates can still move higher from current levels.
amount of Treasury issuance this year are all reasons why we
believe interest rates can move higher. Our target for the 10-year Stalling Out
Treasury Yield at the end of 2021 is between 1.75% and 2.0%. Rising Treasury yields have been a headwind to core fixed income
returns this year, with the first quarter going down as one of the
The Case For (Still) Higher Yields worst quarters ever for bond returns. Generally speaking, the
Inflationary pressures are building as the economy continues to yield spread between Treasury securities and non-Treasury bond
recover. As a bondholder’s main nemesis, inflation erodes the “real” securities can help cushion losses when interest rates move higher
value of principal and interest payments, making them worth less. (and bond prices fall). However, with valuations within most fixed
While we don’t believe inflation will be a lasting problem, we do income sectors already at lofty levels, there hasn’t been enough
expect higher consumer prices in the near term, which should nudge spread to offset rising Treasury yields. This has caused the prices
interest rates higher over the rest of this year. of many bond sectors to fall as interest rates have moved higher.
We are also keeping a close eye on copper prices. The ratio Unfortunately, we expect the trend of higher interest rates to
of copper prices to gold prices has been an important predictor continue, albeit at a much slower pace than what we’ve experienced
of where the 10-year Treasury could be [Figure 9]. Copper is an so far this year, putting further downward pressure on core fixed
important input price for several products, and as copper prices income returns.
12 Member FINRA/SIPCMIDYEAR OUTLOOK 2021: BONDS
Expected returns for core fixed income (as defined by the For suitable income-oriented investors, adding more credit-
Bloomberg Barclays U.S. Aggregate Bond Index) through the sensitive sectors, such as bank loans and emerging market debt,
remainder of the year are low to even negative in certain scenarios to their portfolios may help compensate for the reduced income
[Figure 10]. Because we believe interest rates will move higher from potential of a low-rate environment, but we would still recommend
current levels, core fixed income returns may add more negative that high-quality bonds make up the bulk of any bond allocation.
returns to the already negative year-to-date returns. If core fixed
income returns are negative for the year, it will be the first time Use Bonds as a Buffer
since 2013, which was a great year for stocks, but was also the So, if we’re expecting higher Treasury yields and low-to-negative
last time the Fed started talking about tapering its bond buying returns for core fixed income, why would anyone want to own
programs. History may be rhyming again. bonds? Frankly, in case something bad happens to cause equity
We still recommend investors reduce the interest-rate sensitivity markets to sell off. Simply put, bonds help you stay in stocks and
in their portfolios. Mortgage-backed securities (MBS) do not offer make progress toward your long-term goal. Core bonds, and more
the upside of corporate bonds, but they can be more resilient in a specifically Treasury securities, continue to be the best diversifier
rising-rate environment. Investment-grade corporates tend to be during equity market declines. As we look at how Treasury securities
more rate-sensitive than MBS, and their credit sensitivity may make have performed during periods when the S&P 500 Index was down
them more vulnerable than MBS if stocks pull back, but we still 3% or more, we see that Treasury security returns have been mostly
think the short-to-intermediate part of the corporate credit universe positive [Figure 11]. When you consider stocks are in the second
makes sense. Remember, longer-term bonds are more impacted year of a bull market and that, historically, has brought increased
by higher rates, which is why we recommend an underweight volatility, core fixed income can help dampen and potentially offset
to Treasuries. some of those losses. While we still like stocks over bonds over the
course of the year, we do think high-quality fixed income continues
to serve a purpose in portfolios.
13 Member FINRA/SIPCMIDYEAR OUTLOOK 2021: BONDS
All Eyes on the Fed support wanes. While we still think it’s too early for the Fed to begin
to increase short-term interest rates, we do think the discussion
When we evaluate the economic and financial landscapes, the Fed
around reducing the size and scope of bond purchases (also known
is a key risk we’re keeping our eyes on. Since March 2020, the Fed
as tapering) will start to take place soon. How the market will react
has supported the economy and financial markets by purchasing
to these discussions is unclear at this point and there is the risk
$80 billion in Treasuries and $40 billion in mortgage securities
that a communication error by the Fed could cause interest rates to
and keeping short-term interest rates near zero. As the economy
move higher.
continues to recover, however, the need for continued monetary
14 Member FINRA/SIPCMIDYEAR OUTLOOK 2021
CONCLUSION: OPEN ROADS AHEAD
We’ve been seeing it around us for months now. The U.S. economy when times are easier so that we can stick with them when times
is well on its way to fully reopening and much of the rest of the are hard, or just enjoy the benefits when times are good.
globe isn’t that far behind. We’re also experiencing the transition to Looking out over the rest of 2021, it seems like the worst of the
normalcy, the burst of pent-up demand for everything that’s been hard times are behind us. Now we’re going full speed ahead, and
on hold, including just ordinary, everyday life outside the pandemic. we all want to take some time to enjoy the thrill after a long period
In its own way, that transition itself feels like it’s moving fast. And of caution. But these are also the times when planning is most
if you’re looking to go fast and want to navigate the challenges that effective—early in the economic cycle, with the next recession
come with speed, it’s always smart to bring a crew. To keep you potentially years away, a strong start to a bull market in full gear,
fueled. To calm your nerves when you hit some traffic. To help plan and a relatively calm market environment. Right now, in fact,
your strategy and potentially change course. And to share your is the ideal time to consult your financial professional on your
successes at the finish line. financial goals, the most effective way to reach them, and how to
In 2020, a year in which planning anything seemed impossible, be prepared for market volatility down the road. LPL Research’s
having a financial plan and sticking to it was more valuable than Midyear Outlook 2021: Picking Up Speed is here to help you
ever. But that plan didn’t suddenly just appear. The time to make a navigate the risks and opportunities over the rest of 2021 and
plan isn’t when navigating a tricky environment. We build our plans beyond, but your crew remains the key to progressing toward your
long-term goal.
15 Member FINRA/SIPCMIDYEAR OUTLOOK 2021
GENERAL DISCLOSURES The Standard & Poor’s 500 Index is a capitalization-weighted index of 500 stocks
designed to measure performance of the broad domestic economy through changes in
The opinions, statements and forecasts presented herein are general information only
the aggregate market value of 500 stocks representing all major industries.
and are not intended to provide specific investment advice or recommendations for
any individual. It does not take into account the specific investment objectives, tax and The Bloomberg Barclays U.S. Aggregate Bond Index is an index of the U.S.
financial condition, or particular needs of any specific person. There is no assurance investment-grade fixed-rate bond market, including both government and
that the strategies or techniques discussed are suitable for all investors or will be corporate bonds.
successful. To determine which investment(s) may be appropriate for you, please
consult your financial professional prior to investing.
EQUITY RISK:
Any forward-looking statements including the economic forecasts herein may not
develop as predicted and are subject to change based on future market and other Investing in stock includes numerous specific risks including the fluctuation of
conditions. All performance referenced is historical and is no guarantee of dividend, loss of principal and potential illiquidity of the investment in a falling market.
future results. Because of their narrow focus, sector investing will be subject to greater volatility than
investing more broadly across many sectors and companies. Value investments can
References to markets, asset classes, and sectors are generally regarding the
perform differently from the market as a whole. They can remain undervalued by the
corresponding market index. Indexes are unmanaged statistical composites
market for long periods of time. The prices of small and mid-cap stocks are generally
and cannot be invested into directly. Index performance is not indicative of the
more volatile than large cap stocks.
performance of any investment and does not reflect fees, expenses, or sales charges.
All performance referenced is historical and is no guarantee of future results.
Any company names noted herein are for educational purposes only and not an EQUITY DEFINITIONS:
indication of trading intent or a solicitation of their products or services. LPL Financial Cyclical stocks typically relate to equity securities of companies whose price is
doesn’t provide research on individual equities. affected by ups and downs in the overall economy and that sell discretionary items
All index data from FactSet. that consumers may buy more of during an economic expansion but cut back on during
a recession. Counter-cyclical stocks tend to move in the opposite direction from the
All information is believed to be from reliable sources; however, LPL Financial makes
overall economy and with consumer staples which people continue to demand even
no representation as to its completeness or accuracy.
during a downturn.
A growth stock is a share in a company that is anticipated to grow at a rate
GENERAL RISK DISCLOSURES: significantly above the average for the market due to capital appreciation.
Investing involves risks including possible loss of principal. No investment strategy A value stock is anticipated to grow above the average for the market due to trading at
or risk management technique can guarantee return or eliminate risk in all market a lower price relative to its fundamentals, such as dividends, earnings, or sales.
environments. There is no guarantee that a diversified portfolio will enhance overall
Large cap stocks are issued by corporations with a market capitalization of $10 billion
returns or outperform a non-diversified portfolio. Diversification does not protect
or more, and small cap stocks are issued by corporations with a market capitalization
against market risk. Investing in foreign and emerging markets debt or securities
between $250 million and $2 billion.
involves special additional risks. These risks include, but are not limited to, currency
risk, geopolitical risk, and risk associated with varying accounting standards. Investing
in emerging markets may accentuate these risks. FIXED INCOME RISKS:
Bonds are subject to market and interest rate risk if sold prior to maturity. Bond
GENERAL DEFINITIONS: values will decline as interest rates rise and bonds are subject to availability and
change in price. Bond yields are subject to change. Certain call or special redemption
Gross domestic product (GDP) is the monetary value of all the finished goods and
features may exist which could impact yield. Government bonds and Treasury bills are
services produced within a country’s borders in a specific time period, though GDP is
guaranteed by the US government as to the timely payment of principal and interest
usually calculated on an annual basis. It includes all of private and public consumption,
and, if held to maturity, offer a fixed rate of return and fixed principal value. Corporate
government outlays, investments and exports less imports that occur within a
bonds are considered higher risk than government bonds but normally offer a higher
defined territory.
yield and are subject to market, interest rate, and credit risk, as well as additional
The PE ratio (price-to-earnings ratio) is a measure of the price paid for a share relative risks based on the quality of issuer, coupon rate, price, yield, maturity, and redemption
to the annual net income or profit earned by the firm per share. It is a financial ratio features. Mortgage-backed securities are subject to credit, default, prepayment,
used for valuation: a higher PE ratio means that investors are paying more for each unit extension, market and interest rate risk.
of net income, so the stock is more expensive compared to one with lower PE ratio.
Earnings per share (EPS) is the portion of a company’s profit allocated to each
outstanding share of common stock. EPS serves as an indicator of a company’s
profitability. Earnings per share is generally considered to be the single most important
variable in determining a share’s price. It is also a major component used to calculate
the price-to-earnings valuation ratio.
16 Member FINRA/SIPCMIDYEAR OUTLOOK 2021
FIXED INCOME DEFINITIONS: International debt securities involve special additional risks. These risks include, but
are not limited to, currency risk, geopolitical and regulatory risk, and risk associated
Credit quality is one of the principal criteria for judging the investment quality of
with varying settlement standards. These risks are often heightened for investments in
a bond or bond mutual fund. As the term implies, credit quality informs investors
emerging markets.
of a bond or bond portfolio’s credit worthiness, or risk of default. Credit ratings are
published rankings based on detailed financial analyses by a credit bureau specifically High yield/junk bonds (grade BB or below) are not investment grade securities, and
as it relates to the bond issue’s ability to meet debt obligations. The highest rating are subject to higher interest rate, credit, and liquidity risks than those graded
is AAA, and the lowest is D. Securities with credit ratings of BBB and above are BBB and above. They generally should be part of a diversified portfolio for
considered investment grade. The credit spread is the yield on corporate bonds less sophisticated investors.
the yield on comparable maturity Treasury debt. This is a market-based estimate of
Municipal bonds are subject to availability and change in price. They are subject
the amount of fear in the bond market. BBB-rated bonds are the lowest quality bonds
to market and interest rate risk if sold prior to maturity. Bond values will decline as
that are considered investment-grade, rather than high-yield. They best reflect the
interest rates rise. Interest income may be subject to the alternative minimum tax.
stresses across the quality spectrum.
Municipal bonds are federally tax-free but other state and local taxes may apply. If sold
The Bloomberg Barclays Aggregate US Bond Index represents securities that are prior to maturity, capital gains tax could apply.
SEC-registered, taxable, and dollar denominated. The index covers the US investment-
grade fixed rate bond market, with index components for government and corporate
securities, mortgage pass-through securities, and asset-backed securities.
This material was prepared by LPL Financial, LLC.
Securities and advisory services offered through LPL Financial (LPL), a registered investment advisor and broker-dealer (member FINRA/SIPC).
Insurance products are offered through LPL or its licensed affiliates. To the extent you are receiving investment advice from a separately registered independent investment
advisor that is not an LPL affiliate, please note LPL makes no representation with respect to such entity.
Not Insured by FDIC/NCUA or Any Not Bank/Credit Union Not Bank/Credit Union Deposits
May Lose Value
Other Government Agency Guaranteed or Obligations
For Public Use.
Member FINRA/SIPC.
17 RES-750000-0521 Tracking #1-05155985 (Exp. 07/22)You can also read