Modified release of encapsulated bioactive compounds from annatto seeds produced by optimized ionic gelation techniques - Nature
←
→
Page content transcription
If your browser does not render page correctly, please read the page content below
www.nature.com/scientificreports
OPEN Modified‑release of encapsulated
bioactive compounds from annatto
seeds produced by optimized ionic
gelation techniques
Ana María Naranjo‑Durán *
, Julián Quintero‑Quiroz, John Rojas‑Camargo &
Gelmy Luz Ciro‑Gómez
To compare the encapsulation of annatto extract by external gelation (EG) and internal gelation
(IG) and to maximize process yield (% Y), two central composite designs were proposed. Calcium
chloride (CaCl2) concentration (0.3–3.5%), alginate to gelling solution ratio (1:2–1:6); acetic acid
(CH3COOH) concentration (0.2–5.0%) and alginate to gelling solution ratio (1:2–1:6) were taken as
independent variables for EG and IG respectively. Release studies were conducted under different
conditions; morphology, particle size, the encapsulation efficiency (EE), and release mechanism
were evaluated under optimized conditions. The optimized EG conditions were 0.3% CaCl2 and 1:1.2
alginate to gelling solution ratio, whereas a 0.3% CH3COOH and 1:5 alginate to gelling solution ratio
were optimized conditions for IG. When 20% extract was employed, the highest EE was achieved, and
the largest release was obtained at a pH 6.5 buffer. The Peppas–Sahlin model presented the best fit
to experimental data. Polyphenol release was driven by diffusion, whereas bixin showed anomalous
release. These results are promising for application as modulated release agents in food matrices.
Bixa orellana L. (annatto) is a native shrub from Latin America, it is widely cultivated due to the high content of
carotenoids such as bixin in the seeds. This compound is a natural dye that works as an alternative substitute for
synthetic dyes. In addition, the aqueous extract from the seeds has also been revealed to have antioxidant and
antimicrobial properties attributed to their high content of carotenoid and polyphenol compoundds1,2. About
80% of carotenoids correspond to bixin (methyl hydrogen 9′-cis-6, 6′-diapocarotene-6,6′-dioate)3. This compound
has nine conjugated double bonds and two carboxylic groups responsible for its ability to trap reactive oxygen and
nitrogen species, along with free radicals4. The main polyphenol compounds found in the extract are catechin,
chlorogenic acid, chrysine, butein, hypoaletin, licochalcona, and x anthoangelol5. The compounds can limit the
action of free radicals and inhibit the growth of microorganisms in food products.
Furthermore, they can form extracellular complexes with cell wall proteins3,6. However, the major drawback
of annatto extracts is its low stability, leading to the rapid degradation of the bioactive compounds (BC), resulting
in poor performance if applied in food matrixes. The encapsulation technique has been shown to improve the
effectiveness of preventing these compounds’ degradation and could also achieve desirable effects like controlled
delivery and extending shelf life to improve this extract’s use for several food and pharmaceutical applications4.
Ionic gelation is one of the most straightforward and inexpensive techniques for encapsulating bioactive
compounds since it does not require high temperatures or solvents; thus, it is especially useful for heat-sensitive
compounds. There are two major types of ionic gelation; the first is external gelation (EG), and the second is
internal gelation (IG). In EG, a sodium alginate solution containing the extract is extruded into a calcium chloride
solution, and the capsule is formed when the Ca2+ ions diffuse from the salt solution toward the polymer and
the BC. IG instead occurs when a solution containing alginate, extract, and C aCO3 is extruded into a medium
composed of acidified oil. The reaction starts when the C a2+ ions solubilize in the acidified medium, react with
the alginate through ionic interactions, and form hydrogels, which entrap the BC. The significant difference
between these two mechanisms is based on the reaction kinetics, which affects the wall structure, encapsulation
efficiency, and BC release rate7. Some authors have studied the different properties between particles obtained
by these two gelation mechanisms. Lupo et al. in 2 0157 reported that the particles obtained by EG are smaller
and harder than particles by IG. These characteristics are attributed to gelation kinetics on the surface, due to
College of Pharmaceutical and Food Sciences, University of Antioquia, Street 67, 53‑108 Medellin, Colombia. *email:
amaria.naranjo@udea.edu.co
Scientific Reports | (2021) 11:1317 | https://doi.org/10.1038/s41598-020-80119-1 1
Vol.:(0123456789)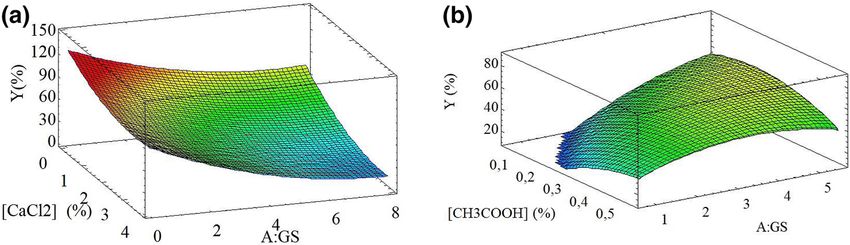
www.nature.com/scientificreports/
the more rigid layer it forms when calcium migrates from outside the drops. Instead, the particles obtained by
IG are more homogeneous and smoother on their surface because gelation occurs from inside the drop. In the
same way, Leong et al. in 20168 concluded that the internal and external gelation mechanisms provide different
particle sizes and morphological properties. However, no study was found comparing these processes already
optimized using the response surface methodology and the evaluation of bixin and polyphenols release kinetic
from the beads obtained by both encapsulation technics IG and EG. Therefore, this study aimed to compare the
bioactive compounds’ physicochemical properties and release rate from annatto extract encapsulated by IG and
EG’s optimized process.
Materials and methods
Production and characterization of the extract obtained from annatto seeds. The extract was
obtained by leaching using ethanol as a solvent. The conditions adopted were a pH of 4.0, a 1:5 seed-to-solvent
ratio, a temperature of 25 °C and constant stirring for 48 h8. The extract thus obtained was filtered and the liquid
phase concentrated at 60 mbar and 35 °C (R-114, R otavapor®, B-CHI). This solid was combined with the solid
residue using a high shear homogenizer (D-500, SUCCESS TECHNIQUE) followed by freeze-drying and stor-
ing at 4 °C until further use.
Experimental conditions. The optimal EG and IG conditions were determined by a surface response
experimental design (RSM), using the Design E xpert® software (Vs. 8.0.6, Stat-Ease, USA). The calcium chloride
concentration [CaCl2: 0.3–3.5% (w/v)] and gelling solution ratio (A:GS 1:2–1:6) were taken as independent vari-
ables for EG. On the other hand, for IG were glacial acetic acid concentration ( [CH3COOH]: 0.2–0.5%), and
alginate:gelling solution ratio (A:GS 1:2–1:6). In both methods, the process yield Y % (w/w)) was taken as the
response variable and it was determined as follows:
Experimental quantity of obtained beads
Y= × 100% (1)
Theoretical quantity of obtained beads
1% (w/v) sodium alginate solution was poured into a C aCl2 as a gelling solution using a 21-gauge needle
syringe to obtain beads by EG. The solution was then stirred at 700 rpm with a magnet (Corning™ PC-420 d) for
15 min. The resulting beads were filtered and washed with distilled w ater7. Likewise, beads were produced by IG
pouring a mixture of 1% sodium alginate solution and 0.35% (w/v) CaCO3 into a mixture of sunflower oil and
acetic acid gelling solution. The mixture was then stirred at 700 rpm for 1 h. The resulting beads were separated
from the acidic oil by centrifugation at 600 rpm for 10 min (centrifuge Z 206 A HERMLE) and degreased with
petroleum ether. The yield of both methods was then determined (Eq. 1). The experimental data obtained for
EG and IG were adjusted to polynomial models by multiple regressions. The coefficients of determination (r2)
and the adjusted coefficient of determination ( r2-adj) were used as the regression model’s adjustment parameters.
The statistical significance of the independent variables and the models were obtained by analyzing variance
(ANOVA) using the LSD-Fisher test with a 95% confidence level. The response optimization was conducted in
order to maximize yield for both t echniques9.
Encapsulation efficiency of annatto extract by the optimized EG and IG techniques. This was
calculated indirectly from the alginate beads containing extract concentrations of 5, 10, and 20% (v/v), following
the method described by Chan (2011)10 with minor modifications. Briefly, the content of bixin and total poly-
phenol compounds in the alginate dispersions was determined after the encapsulation process. The encapsula-
tion efficiency of the extract was determined using Eq. (2). The experiments were conducted in triplicate.
ma − m b
%EE =
ma
× 100 (2)
where, ma and mb correspond to the initial amount of BC and the non-encapsulated amount of these materials,
respectively.
Quantification of total polyphenol compounds. The total polyphenol content was determined by spectropho-
tometry using the Folin–Ciocalteu method described by Nunes et al.11. Briefly, 30 μL of the sample was poured
into 96-well microplates followed by 150 μL of Folin–ciocalteu reagent (0.2 N) and 120 μL of N a2CO3 (7.5%,
w/v). The microplates were incubated in darkness for 15 min at 45 °C, followed by incubation at 25 °C for
30 min. Subsequently, the sample absorbance was measured at 765 nm using a spectrophotometer (Multiskan
GO, Thermo Fisher Scientific). All measurements were taken in triplicate and expressed as mg equivalent of Gal-
lic acid per mL (0–216 μg/mL; r2 = 0.999).
Quantification of bixin. 75 mg of sample was mixed with 1.5 mL of dimethylsulfoxide, followed by dilution
with acetone to obtain an absorbance value ≤ 0.15 at 487 nm employing a UV/VIS spectrophotometer (1700,
Shimadzu Europe®). The concentration of bixin in the sample was determined using the following expression:12
A × 1000 × V
Bixin (mg/mL) = (3)
A1%
1 cm × 100
−1 −1
where: A1%
1cm : specific absorptivity coefficient of bixin in acetone (3090 g/100 mL) × 1 cm ; A: sample absorb-
ance and V: dilution volume (mL)13,14.
Scientific Reports | (2021) 11:1317 | https://doi.org/10.1038/s41598-020-80119-1 2
Vol:.(1234567890)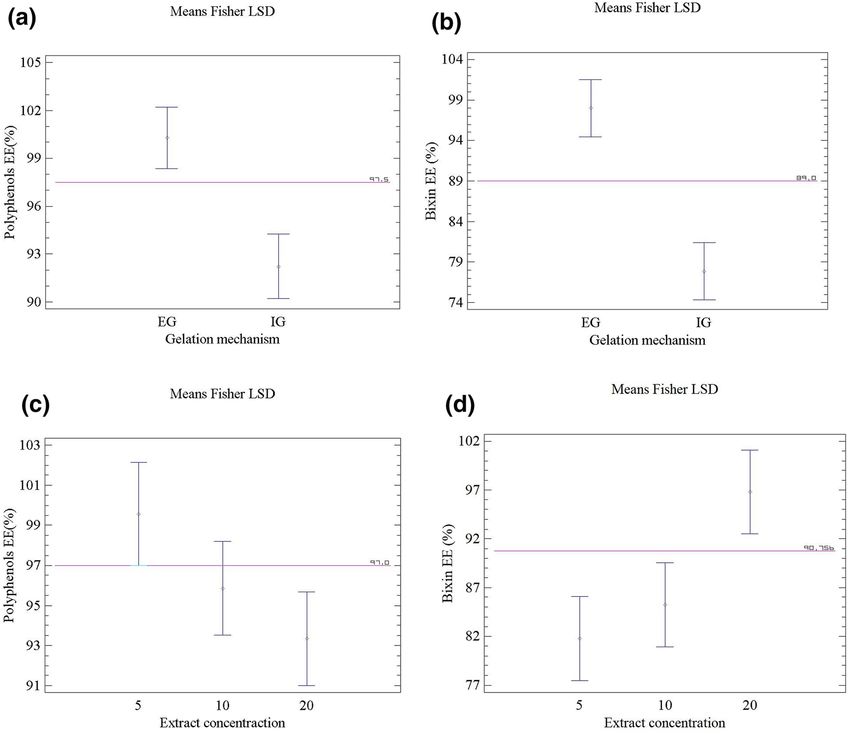
www.nature.com/scientificreports/
Morphology and particle size of the beads. These were determined using a Scanning Electron Micro-
scope (SEM, Joel 6490LV, Peabody, MA, USA) at an accelerated voltage of 20 kV. The beads were fixed to alu-
minum sample holders and coated with a 5 nm gold layer using a vacuum chamber (Desk IV, Denton Vacuum,
Moorestown, NJ, USA)15. The particle size was measured by digital image analysis using the method described
by Londoño and Rojas16, with minor modifications. The microphotographs were taken with a digital camera.
Around 1000 particles were randomly selected per microphotograph and their projected area, aspect ratio (AR)
and sphericity were determined using the ImageJ® software.
Infrared transmission spectroscopy (FT‑IR) characterization. This was conducted according to the
method described by Belscak-Cvitanovic et al.17. The samples were mixed with KBr in an agate mortar and com-
pressed into pellets using a single tablet press. Spectra were taken on a FT-IR spectrophotometer (IRAffinity-1
SHIMADZU) in a range between 4000 and 400 cm−1, 16 scans with a resolution of 4 cm−1.
Release studies of polyphenol compounds and bixin from the beads. The effect of pH (3.0, 6.5
and 10), ionic strength (0 and 100 mM), thermal treatment (60 and 90 °C), and surfactants (anionic and non-
ionic) were studied. The pHs of 3.0 and 6.5 were used sodium phosphate buffer, whereas the tris buffer was pH to
10. The ionic strength was adjusted with NaCl solutions at 0 and 100 mM. The surfactant effect was studied with
a 5% SDS and a 2% of tween 80. The thermal treatment was studied at 60 °C for 30 min and 90 °C for 10 min18,19.
Approximately, 1 g of beads were poured into a polypropylene bag (1 cm2), and placed into 5 mL of the solu-
tions maintained at the conditions described previously and stirred at 210 rpm employing a shaker (HZQ-120H,
Thermo) at 25 °C. 1 mL Aliquots were taken at 15, 30, 45, 60, 90, 120, 150, 180, 210, 240, 300 and 360 min and at
12 h and 24 h. The respective solution immediately replaced the respective volume taken. The concentration of
total polyphenol compounds and bixin was then calculated using a calibration curve conducted with the same
media. All measurements were performed in t riplicate20.
The release kinetics was studied according to the method described by Yu et al. with minor m odifications21.
100 mg of beads were poured into 15 mL was stirring at 210 rpm for 48 h. Subsequently, aliquots were taken at 1,
2, 3, 4, 5, 6, 12, 24, and 48 h the content of polyphenol compounds and bixin was determined. The release kinetics
of the BC (f vs t) was plotted until reaching a released fraction of 0.6. The experimental data were adjusted to
the kinetic Peppas, Peppas–Burst, and Peppas–Sahlin models, which showed the best fit 21,22 (Eqs. 4, 5, and 6):
f = k × tn (4)
f = k × tn + α (5)
f = (k1 × t m ) + (k2 × t 2m ) (6)
where: f, k, n, k1, k2 and m corresponds to the fraction of compound released, the system structural and geometric
characteristics, release mechanism, Fickian diffusion, relaxation mechanism and diffusive geometric coefficient,
respectively.
Statistical analysis. The results were expressed as mean ± standard deviation (SD) of three replicate. The
experimental designs, analysis of variance, and mathematical models were conducted using the STATGRA
PHICS CENTURION® software. Comparisons of the means were made with the Fisher LSD test with a 95%
confidence level.
Results
Optimization of the external (EG) and internal (IG) ionic gelation mechanisms. The numeri-
cal optimization and the grid search within the contour plots were employed to select the optimal region that
presented the maximized yield. Yield varied from 22.89 to 97.40% for the EG process (Table 1). Therefore, the
optimized conditions were 0.3% to CaCl2 (equivalent to 0.0024 moles of Ca2+/galginate) and ratio (A:GS) of 1:1.2.
The optimized parameters were validated experimentally by conducting a checkpoint run with a resulting yield
of 88.06 ± 0.55% with a relative bias of − 0.12. On the other hand, the IG encapsulation process rendered the
highest yield when 0.30% CH3COOH and a 1:5 (A:O) ratio were employed, resulting in a yield of 56.51 ± 3.18.
Furthermore, a validation run rendered a 56.51 ± 3.18% yield with a relative bias of 11.91%. No studies show
the use of IG techniques for the encapsulation of these types of extracts; perhaps the resulting low yields are
responsible for this.
The analysis of variance (ANOVA) of the experimental design applied to the EG process (Table 2) shows the
significance of the linear and quadratic terms (p < 0.05) and explain 82.1% of the yield variability. However, no
statistically significant differences were found between the interaction factors (p = 0.6349). Likewise, the ANOVA
table for IG indicates that the model, the factors evaluated in their linear and quadratic terms, and their linear
interaction were statistically significant (p < 0.05) and explained 82.33% of the yield variability.
Equations (7) and (8) show the polynomial equation for yield as a function of the factors evaluated, and
Fig. 1 depicts the surface response plots showing the effect of the independent variables on yield by EG and IG,
respectively. In panel A, yield increased as the C aCl2 concentration and ratio A:GS decreased. Therefore, panel B
shows that as the A:GS ratio increased, yield increased, especially at low acetic acid levels. Also, at 63.24% yield,
there is an inflection point demonstrating the quadratic effect with the increase of acetic acid.
Scientific Reports | (2021) 11:1317 | https://doi.org/10.1038/s41598-020-80119-1 3
Vol.:(0123456789)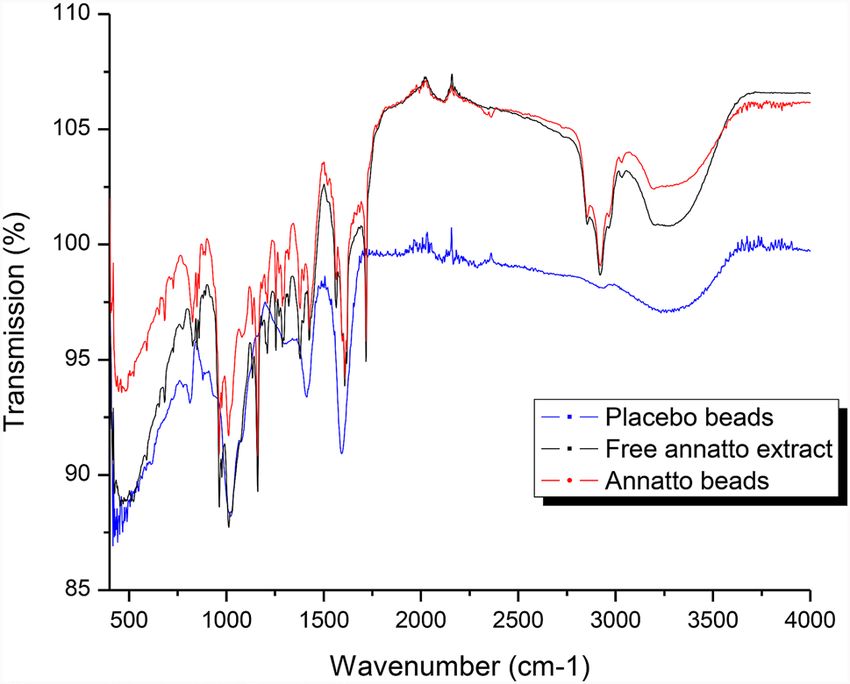
www.nature.com/scientificreports/
Rotary composite central factorial Face-centered composite central factorial
design for EG design for IG
Run [CaCl2] (%) A:GS 1:x Y (%) [CH3COOH] (%) A:GS 1:x Y (%)
1 1.9 4.0 38.47 0.3 0.2 0.00
2 0.8 2.0 65.30 0.3 3.0 48.87
3 1.9 4.0 37.64 0.1 1.0 0.00
4 3.0 2.0 49.18 0.3 3.0 53.18
5 3.5 4.0 30.27 0.1 5.0 70.59
6 1.9 4.0 44.36 0.1 5.0 70.83
7 1.9 6.8 26.07 0.3 0.2 0.00
8 0.8 6.0 44.24 0.3 5.8 49.72
9 3.0 6.0 23.62 0.5 5.0 54.87
10 0.3 4.0 73.81 0.1 1.0 0.00
11 1.9 1.2 64.04 0.6 3.0 50.64
12 1.9 4.0 44.88 0.5 1.0 34.41
13 0.8 2.0 70.21 0.3 5.8 55.02
14 1.9 4.0 39.24 0.3 3.0 37.98
15 3.0 2.0 54.66 0.3 3.0 58.84
16 3.5 4.0 38.34 0.6 3.0 52.25
17 1.9 4.0 50.00 0.5 5.0 54.05
18 1.9 6.8 35.35 0.3 3.0 53.67
19 0.8 6.0 50.04 0.02 3.0 0.00
20 3.0 6.0 22.89 0.3 3.0 55.91
21 0.3 4.0 89.94 0.5 1.0 31.62
22 1.9 1.2 83.73 0.02 3.0 0.00
23 1.9 4.0 44.88 N.A N.A N.A
24 0.8 2.0 81.97 N.A N.A N.A
25 1.9 4.0 52.91 N.A N.A N.A
26 3.0 2.0 59.19 N.A N.A N.A
27 3.5 4.0 28.65 N.A N.A N.A
28 1.9 4.0 51.39 N.A N.A N.A
29 1.9 6.8 35.79 N.A N.A N.A
30 0.8 6.0 53.60 N.A N.A N.A
31 3.0 6.0 30.11 N.A N.A N.A
32 0.3 4.0 85.56 N.A N.A N.A
33 1.9 1.2 97.40 N.A N.A N.A
Predicted value 0.30 1:1.2 100 0.3 1:5 63.24
Experimental value 0.30 1:1.2 88.06 ± 0.55 0.3 1:5 56.51 ± 3.18
Table 1. Experimental design matrix for optimization of yield. [CaCl2] (%) calcium chloride concentration,
A:GS (1:X) alginate: gelling solution ratio, [CH33COOH] (%) acetic acid concentration, Y (%) process yield
percentage.
EG IG
p value p value
A-[CaCl2] < 0.0001 A-[CH3COOH] 0.0005
B-A:GS < 0.0001 B-A:O < 0.0001
AB 0.6349 AB 0.0049
A2 0.0295 A2 0.0077
B2 0.0423 B2 0.0099
2
r 0.8616 r2 0.8653
r2-adjusted 0.8212 r2-adjusted 0.8233
Table 2. ANOVA Table for the ionic gelation optimization process. EG external gelation, IG internal gelation,
[CaCl2] (%) calcium chloride concentration, A:GS (1:X) alginate: gelling solution ratio, [CH3COOH] (%) acetic
acid concentration.
Scientific Reports | (2021) 11:1317 | https://doi.org/10.1038/s41598-020-80119-1 4
Vol:.(1234567890)www.nature.com/scientificreports/
Figure 1. Responses surfaces plots for (%Y) resulted from (a) EG and (b) IG.
Figure 2. Fisher’s LSD test with 95% confidence for: (a) EE for polyphenols compounds with respect to gelation
type; (b) EE for bixin with respect to gelation type; (c) EE for polyphenol compounds with respect to the extract
concentration; (d) EE of bixin with respect to the extract concentration.
Y (%) = 126.991 − 25.491A − 15.295B + 3.920A2 − 0.559AB + 1.099B2 (7)
Y (%) = −66.042 + 283.564A + 33.925B − 30.791AB − 224.953A2 − 2.373B2 (8)
Encapsulation efficiency of annatto extract conducted under the optimized conditions. A
statistically significant effect was found for both factors in bixin (p < 0.05). Conversely, the EE of polyphenol
compounds showed the gelation type as the only statistically significant factor (p = 0.0007). Fisher’s LSD test
comparing the EE concerning the gelation type is shown in Fig. 2a,b. The EE of polyphenol compounds and
bixin was much higher when the extract was encapsulated by the EG rather than IG (p < 0.05). Likewise, the EE
also varied concerning the extract (Fig. 2c,d). There were no statistically significant differences between the EE
of polyphenol compounds for the extract at concentrations from 5 to 20%. Conversely, the EE of bixin (Fig. 2d)
reached 100% when a 20% extract was employed (p < 0.005).
Scientific Reports | (2021) 11:1317 | https://doi.org/10.1038/s41598-020-80119-1 5
Vol.:(0123456789)www.nature.com/scientificreports/
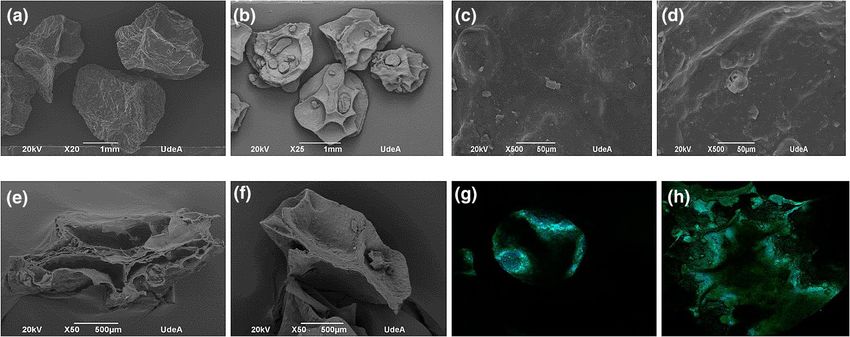
Figure 3. SEM micrographs for beads obtained by EG and IG. (a) EG beads at 20 ×; (b) IG beads at 25 ×; (c)
surface obtained by EG at 500 ×; (d) surface obtained by IG at 500 ×; (e) Cross-sectional view obtained by EG
at 50 ×; (f) cross-sectional view obtained by IG at 50 ×, (g) confocal image obtained by IG; (h) confocal image
obtained by EG.
Figure 4. FT-IR spectrum obtained for free annatto extract, encapsulated by EG and blank (beads without
extract obtained by EG).
Particle size and morphology. The annatto beads obtained by EG were 3.3 times larger
(2291.040 ± 19.213 μm) than those obtained by IG (697.147 ± 20.395 μm) (Fig. 3a,b). In addition, the beads
obtained by EG had a more homogeneous particle size than those obtained by IG. IG rendered a bimodal parti-
cle size population composed of a large one and smaller one. In addition, the surface of the beads was rough and
did not show any difference with respect to the gelation type. The beads’ cross-section (Fig. 3e,f) also showed that
those obtained by IG have a more compact internal structure compared to those obtained by EG. Furthermore,
the confocal microphotographs showed an anisotropic blue area where the encapsulated extract took place.
FT‑IR characterization of annatto extract. Figure 4 shows the FT-IR spectra obtained for the samples.
The placebo beads had a marked peak at 1029 cm−1 attributed to the presence of C–O–C of alginate. The bands
at 1620 and 1395 cm−1 correspond to the symmetric and asymmetric vibrations of carboxylic groups, which are
rocess22. In addition, the spectra of free annatto extract and annatto beads are
essential for the ionic gelation p
−1
observed at 3276 cm , which are attributed to the elastic vibrations of OH groups present in the alginate, bixin
and polyphenol structures. The band at 1167 cm−1 and 1015 cm−1 represents the symmetric and asymmetric
vibrations of C–O–C present in the bixin structure23.
Scientific Reports | (2021) 11:1317 | https://doi.org/10.1038/s41598-020-80119-1 6
Vol:.(1234567890)www.nature.com/scientificreports/
Figure 5. Effect of release media conditions on the release efficiency of BC from beads produced by EG and IG
(a) bixin and (b) polyphenol compounds.
Figure 6. Kinetics release profile for (a) polyphenol compounds, and bixin (b) present in annatto extract
encapsulated by EG (filled circles) and by IG (filled triangles) in a 0.1 M sodium phosphate buffer medium at a
pH of 6.5, 25 °C and 210 rpm.
Release studies of bioactive compounds at different media conditions. Figure 5 shows the
release profiles of bixin and polyphenol compounds from beads suspended in a media with different pH, ionic
strength, surfactants, and temperature conditions. Panel 5 a, shows the largest bixin release (67.56%, vs. 48.41%)
at a pH of 6.5 for EG and IG, respectively (p = 0.000 and p = 0.198). At this pH, calcium ions compete with more
complex ions such as phosphates changing the cross-linking magnitude with a lginates24. Phosphate ions increase
the hydrophobicity at neutral pH25, whereas, at acidic pH values, bixin (pKa 4.9) loses solubility in the media
and precipitates, resulting in poor release in the phosphate buffer s olution23. The release of bixin under other
media conditions was below 10% due to the low bixin solubility in an aqueous medium. This is explained by an
aliphatic conjugated double bonds structure and a carboxylic acid and a methyl ester group on each chain side26.
The polyphenol compounds release (Fig. 5b) was much lower (< 37%) than those obtained with bixin
(67.56%). The highest release at 90 °C for beads obtained by EG (35.15%) followed by those obtained by IG
(30.91%) and by EG at 60 °C (30%).
Release kinetics of the bioactive compounds from bead produced by EG and IG. These studies
were conducted at the conditions which give the greatest release. Thus is, at a pH of 6.5 in a medium containing
0.1 M Phosphate buffer. The fraction released with respect to time is shown in Fig. 6. Polyphenol compounds
released from beads made by EG reach a fraction of 0.44 within 24 h, whereas those obtained by IG release a
fraction of 0.37 of the polyphenol compounds (Fig. 6a). Conversely, the release kinetics of bixin was greater for
beads made by EG (0.88) rather than IG (0.36) after 12 h (Fig. 6b).
Table 3 lists the parameters obtained from data fitting to the Peppas, Peppas–Burst, and Peppas–Sahlin mod-
els. In this case, the Peppas–Sahlin model showed the best fitting for the polyphenol compound independent of its
technique. In addition, the value of the diffusion constant ( k1) was greater than the value of the polymer relaxa-
tion constant (k2), indicating that a diffusional mechanism dominated the release of polyphenol compounds.
Furthermore, the “m” values of 0.920 and 0.807 for beads obtained by EG and IG, indicates that most beads had
Scientific Reports | (2021) 11:1317 | https://doi.org/10.1038/s41598-020-80119-1 7
Vol.:(0123456789)www.nature.com/scientificreports/
BC Sample Model k1 k2 a n m r2 r2-aj
Peppas 0.077 0.483 0.809 0.801
EG Peppas–Burst 0.127 − 0.071 0.389 0.834 0.821
Peppas–Sahlin 0.037 0.000 0.920 0.952 0.948
Polyphenol compounds
Peppas 0.087 0.456 0.851 0.845
IG Peppas–Burst 0.135 − 0.066 0.374 0.872 0.862
Peppas–Sahlin 0.048 0.000 0.807 0.969 0.967
Peppas 0.083 1.046 0.949 0.943
EG Peppas–Burst 0.040 0.058 1.412 0.962 0.954
Peppas–Sahlin 0.115 0.1400 0.088 0.983 0.979
Bixin
Peppas 0.010 1.574 0.929 0.925
IG Peppas–Burst 0.002 0.052 2.254 0.961 0.956
Peppas–Sahlin 0.014 0.0100 0.703 0.959 0.955
Table 3. Release parameters obtained in a sodium phosphate buffer medium (0.1 M) at a pH of 6.5 BC
bioactive compounds, EG external gelation, IG internal gelation.
ehavior27. On the other hand, the Peppas–Sahlin
a cylindrical shape and exhibited a purely Fickian diffusional b
model showed the best fit to the bixin experimental data; beads made by EG showed a k 2 value slightly larger
than k1, indicating that both mechanisms occurred for the release of bixin. Conversely, in beads made by IG,
the diffusion constant (k1) was greater than the polymer relaxation constant (k2). In fact, the bixin k1 and k 2
constant of EG were 100 times larger than those obtained for beads made by IG. In addition, the m values for
EG ranged from 0.088 to 0.920, indicating a case II transport, whereas IG had values ranging from 0.703 and
0.807, indicating anomalous release mediated by both release mechanisms27.
Discussion
Encapsulation of annatto extract. The results from the experimental design for the optimization of the
external ionic gelation mechanisms were in agreement with those obtained by Rezvanian and c ollaborators28,
who studied the effect of different concentrations of CaCl2, concluding that calcium alginate films were formed
at calcium levels as low as 0.5–1%. Additionally, the results found for annatto extract’s encapsulation efficiency
by the optimized EG and IG techniques are consistent with those found by other authors, who established that
calcium alginate beads are suitable for the encapsulation of large molecules, especially hydrophobic materials
with efficiencies larger than 90%29. In this case, it explains the high EE of bixin. On the contrary, the decrease in
EE of bixin by IG might be explained by the high affinity of bixin molecules towards vegetable oil. In fact, bixin
has a hydrocarbon chain with double conjugated bonds, which governs its non-polar nature and fat solubility26.
On the other hand, polyphenols compounds showed EE below 95%, which was higher than those found by
Belščak-Cvitanović and collaborators30. They obtained an EE of 73% for EG polyphenol compounds, whereas
Moura and collaborators obtained values up to 88.5%31.
Particle size and morphology. The beads’ cross-section showed that those obtained by IG (Fig. 3f) have
a more compact internal structure than those obtained by EG; the same phenomenon was observed by B. Lupo
et al.7, who found that the gelation mechanism played a crucial role in the internal structure of the beads. These
internal structures are related to the calcium-alginate reaction kinetics. In EG, the formation of the outer layer
occurred at the beginning of the gelation process, decreasing the diffusion of calcium ions through the wall, lead-
ing to a low degree of crosslinking and, therefore more porous internal core. Most of the reported studies exam-
ine EG due to its simplicity. There are several studies that compare these two gelation mechanisms: For example,
Chan and c ollaborators32, studied the impact of both techniques on the properties of calcium alginate films. They
concluded that films obtained by EG had a less permeable surface due to the alginate chains, which were more
cross-linked on the surface than within the core. They also established an optimal amount of cross-linking agent,
since an excessive amount showed no statistically significant differences for the properties studied. On the other
hand, Lupo et al.7 found significant differences in both techniques: particle size and texture were reduced when a
high concentration of Ca2+ ions was employed. In addition, particles obtained by EG were harder and less flexible
than those obtained by IG, whereas the latter demonstrated greater cohesiveness due to its smoother and more
homogeneous structure independent of the amount of Ca2+ used.
Release studies of bioactive compounds. The release studies of bioactive compounds under different media con-
ditions were similar to those obtained by Theaj and c ollaborators33. They reported that by increasing the media’s
temperature from 37 °C to 45 °C, the polyphenols release was increased from 73 to 90% in 48 h. In fact, a high
temperature increases the media’s kinetic energy, accelerating water penetration into the calcium alginate beads,
promoting their swelling, and increasing the diffusion rate of the polyphenol compounds towards the m edia18.
On the other hand, the ionic strength also had a statistically significant effect independent of the technique
employed. The osmotic effect explains this phenomenon between media and beads, where the N a+ ions in the
media diffuse across the calcium alginate beads replacing C a2+ ions, hence disrupting the bead structure by
increasing the release r ate18. In addition, polyphenol compounds release between 26.67 and 37.09% was favored
Scientific Reports | (2021) 11:1317 | https://doi.org/10.1038/s41598-020-80119-1 8
Vol:.(1234567890)www.nature.com/scientificreports/
at a pH of 3.0 and 6.5 independent of the technique employed. Other authors report the highest release of the
polyphenolic compounds such as procyanidin, catechin and epicatechin at a pH of 1.434. In fact, the release kinet-
ics from calcium alginate beads depended on factors such as hardness, porosity, solubility, and affinity towards
the media. In addition, the conditions of the release media affect the degree of swelling and erosion. Gener-
ally, most polyphenol compounds are hydrophilic and hence are released by diffusion mechanisms, whereas
hydrophobic compounds such as bixin are mainly released by e rosion35. A diffusional mechanism dominated
the release of polyphenol compounds. This phenomenon was explained by the migration of some water-soluble
polyphenol compound from the core to the outer surface during the freeze-drying process. Once the beads were
in contact with the release media, many of these compounds on the surface were released at a higher diffusion
rate36,36. These results are similar to those found by Singh et al.38, who reported an anomalous kinetics release
for fungicide-alginate beads reinforced with starch and clay. However, the work carried out by Arriola et al.36
encapsulating stevia extract adjusted to the Peppas–Burst model ( r2 = 0.99) revealed a diffusion release mainly
due to the low molecular weight of the polyphenol compounds and their high solubility in aqueous systems that
facilitated their diffusion throughout the porous structure even before swelling or erosion o ccurred37.
Bera et al. studied the release of carotenoids from hydrogel particles in aqueous media39, and found that
bacterial canthaxanthin released from alginate and chitosan hydrogels was larger in neutral media than in
acidic media, and follows an anomalous release with n values of 0.723 and 0.778, respectively. The Peppas model
parameters, with r 2-adjusted values of 0.943 for beads obtained by EG and 0.925 for IG, and n values > 0.85 for
both samples, indicate a case II super relaxation associated with the vitreous stress of hydrophilic polymers that
swell in water27,40,41. In conclusion, EG mechanism presented the highest process yield and the encapsulation
efficiencies of the bioactive compounds were higher than those obtained by IG. However, the beads obtained
by GE at the optimal conditions, presented a large particle size, unsuitable to use in food or pharmaceutical
applications, so it is recommended for future research to study how to reduce the particle size used by emerging
technologies such as electrospray.
Received: 18 December 2019; Accepted: 15 December 2020
References
1. Quintero-Quiroz, J. et al. Optimization of the microwave-assisted extraction process of bioactive compounds from annatto seeds
(Bixaorellana L.). Antioxidants 8, 1–11 (2019).
2. Cuong, T. V. & Thoa, N. T. Effects of partial replacement of nitrite by annatto (Bixaorellana L.) seed powder on the properties of
pork sausages. J. Sci. Technol. 55, 178–187 (2017).
3. Shahid-ul-Islam, Luqman, J. R., Faqeer, M. (2016). Phytochemistry, biological activities and potential of annatto in natural colorant
production for industrial applications—A review. J. Adv. Res. 7, 499–514.
4. Butnariu, M. Methods of analysis (extraction, separation, identification and quantification) of carotenoids from natural products.
J. Ecosyst. Ecogr. 6, 1–19 (2016).
5. Quintero-Quiroz, J., Naranjo-Duran, A. M., Silva-Garcia, M., Ciro-Gomez, G. L. & Rojas-Camargo, J. J. Ultrasound-assisted extrac-
tion of bioactive compounds from annatto seeds, evaluation of their antimicrobial and antioxidant activity, and identification of
main compounds by LC/ESI-MS analysis. Int. J. Food Sci. 2019, 1–9 (2019).
6. Medina-Flores, D. et al. Antibacterial activity of Bixaorellana L. (achiote) against Streptococcusmutans and Streptococcussanguinis.
Asian Pac. J. Trop. Biomed. 6, 400–4003 (2016).
7. Lupo, B., Maestro, A., Gutierrez, J. M. & Gonzalez, C. Characterization of alginate beads with encapsulated cocoa extract to prepare
functional food: Comparison of two gelation mechanisms. Food Hydrocoll. 49, 25–34 (2015).
8. Naranjo-Duran A. M., Quintero-Quiroz, J. & Ciro-Gómez G. L. Optimización del proceso de lixiviación de los compuestos bio-
activos de las semillas de Bixa orellana L. (annato). Rev Cuba Plantas Med. 22 (2017).
9. Gazori, T. et al. Evaluation of alginate/chitosan nanoparticles as antisense delivery vector: Formulation, optimization and in vitro
characterization. Carbohydr. Polym. 77, 599–606 (2009).
10. Chan, E.-S. Preparation of Ca-alginate beads containing high oil content: Influence of process variables on encapsulation efficiency
and bead properties. Carbohydr. Polym. 84, 1267–1275 (2011).
11. Nunes, M. A. et al. Olive pomace as a valuable source of bioactive compounds: A study regarding its lipid- and water-soluble
components. Sci Total Environ. 644, 229–236 (2018).
12. Mínguez-Mosquera, M. I., Hornero-Méndez, D. & Pérez-Gálvez, A. Carotenoids and provitamin A. In Functional foods. Methods
of analysis for functional food (ed. Hurst, W. J.) 277–337 (Wiley, Hoboken, 2008).
13. FAO/WHO. Compendium of Food Additive Specifications; Joint FAO/WHO Expert Committee on FoodAdditives vol. 4 (2006).
14. FAO. Total Colouring Matters Content vol. 4.
15. Hosseini, S. M. et al. Incorporation of essential oil in alginate microparticles by multiple emulsion/ionic gelation process. Int. J.
Biol. Macromol. 62, 582–588 (2013).
16. Londoño, C. & Rojas, J. Effect of different production variables on the physical properties of pellets prepared by extrusion-
spheronization using a multivariate analysis. Pharm. Sci. 41, 69–75 (2017).
17. Belščak-Cvitanović, A. et al. Emulsion templated microencapsulation of dandelion (Taraxacumofficinale L.) polyphenols and
β-carotene by ionotropic gelation of alginate and pectin. Food Hydrocolloids 57, 139–152 (2016).
18. Tan, P. Y. et al. Effects of environmental stresses and in vitro digestion on the release of tocotrienols encapsulated within chitosan-
alginate microcapsules. J. Agric. Food Chem. 65, 10651–10657 (2017).
19. Prataa, A. S., Zanin, M. H. A., Maria, I., Ré, M. I. & Grosso, C. R. F. Release properties of chemical and enzymatic crosslinked
gelatin-gum Arabic microparticles containing a fluorescent probe plus vetiver essential oil. Colloids Surf. B Biointerfaces 67, 171–178
(2008).
20. Sun, X., Cameron, R. G. & Bai, J. Microencapsulation and antimicrobial activity of carvacrol in a pectin-alginate matrix. Food
Hydrocoll. 92, 69–73 (2019).
21. Yu, C.-Y. Composite microparticle drug delivery systems based on chitosan, alginate and pectin with improved pH-sensitive drug
release property. Colloids Surfaces B Biointerfaces 68, 245–249 (2009).
22. Das, R. K., Kasoju, N. & Bora, U. Encapsulation of curcumin in alginate-chitosan-pluronic composite nanoparticles for delivery
to cancer cells. Nanomed. Nanotechnol. Biol. Med. 6, 153–160 (2010).
23. Rahmalia, W., Fabre, J. F. & Mouloungui, Z. Effects of cyclohexane/acetone ratio on bixin extraction yield by accelerated solvent
extraction method. Procedia Chem. 14, 455–464 (2015).
Scientific Reports | (2021) 11:1317 | https://doi.org/10.1038/s41598-020-80119-1 9
Vol.:(0123456789)www.nature.com/scientificreports/
24. Paques, J. P. Alginate nanospheres prepared by internal or external gelation with nanoparticles. In Microencapsulation and micro-
spheres for food applications (ed. Sagis, L. M. C.) 39–55 (Academic Press, London, 2015).
25. Jahangiri, A. Incorporation of bixin in aqueous media: Self-formulation with sorbitol ester of norbixin. Food Chem. 294, 433–439
(2019).
26. Jahangiri, A. Hydrophilization of bixin by lipase-catalyzed transesterification with sorbitol. Food Chem. 268, 203–209 (2018).
27. Peppas, N. A. & Sahlin, J. J. A simple equation for the description of solute release. III. Coupling of diffusion and relaxation. Int.
J. Pharm. 57, 169–172 (1989).
28. Rezvanian, M., Ahmad, N., Mohd, M. C. I. & Ng, S. F. Optimization, characterization, and in vitro assessment of alginate-pectin
ionic cross-linked hydrogel film for wound dressing applications. Int. J. Biol. Macromol. 97, 131–140 (2017).
29. Leong, J. Y. Advances in fabricating spherical alginate hydrogels with controlled particle designs by ionotropic gelation as encap-
sulation systems. Particuology 24, 44–60 (2016).
30. Belščak-Cvitanović, A. et al. Encapsulation templated approach to valorization of cocoa husk, poppy and hemp macrostructural
and bioactive constituents. Ind. Crops Prod. 112, 402–411 (2019).
31. Aguirre-Calvo, T. R., Perullini, M. & Santagapita, P. R. Encapsulation of betacyanins and polyphenols extracted from leaves and
stems of beetroot in Ca(II)-alginate beads: A structural study. J. Food Eng. 235, 32–40 (2018).
32. Chan, L. W., Lee, H. Y. & Heng, P. W. S. Mechanisms of external and internal gelation and their impact on the functions of alginate
as a coat and delivery system. Carbohydr. Polym. 63, 176–187 (2006).
33. Theaj, R. & Upputuri, P. Mathematical modeling and release kinetics of green tea polyphenols released from casein nanoparticles.
Iran. J. Pharm. Res. 18, 1137–1146 (2019).
34. Lavelli, V. & Sri Harsha, P. S. C. Microencapsulation of grape skin phenolics for pH controlled release of antiglycation agents. Food
Res. Int. 119, 822–828 (2019).
35. Costa, P. & Lobo, J. M. S. Modelling and comparison of dissolution profiles. Eur. J. Pharm. Sci. 13, 123–133 (2001).
36. Aceval-Arriola, N., de Medeiros, P. M., Prudencio, E. S. & Carmen Maria Olivera-Müller, C. M. Encapsulation of aqueous leaf
extract of Steviarebaudiana Bertoni with sodium alginate and its impact on phenolic content. Food Biosci. 13, 32–40 (2016).
37. Huang, X. & Brazel, C. S. On the importance and mechanisms of burst release in matrix-controlled drug delivery systems. J. Control
Release 73, 121–136 (2001).
38. Singh, B., Sharma, D. K., Kumar, R. & Gupta, A. Controlled release of the fungicide thiram from starch–alginate–clay based
formulation. Appl. Clay Sci. 45, 76–82 (2009).
39. Bera, S. & Dutta, D. Encapsulation and release of a bacterial carotenoid from hydrogel matrix: Characterization, kinetics and
antioxidant study. Eng. Life Sci. 17, 739–748 (2017).
40. Siepmann, J. & Peppas, N. Modeling of drug release from delivery systems based on hydroxypropyl methylcellulose (HPMC). Adv.
Drug Deliv. Rev. 48, 139–157 (2001).
41. Ritger, P. L. & Peppas, N. A. A simple equation for description of solute release II. Fickian and anomalous release from swellable
devices. J. Control Release. 5, 37–42 (1897).
Acknowledgements
This research was sponsored by COLCIENCIAS through the 715 for research and development projects in
engineering-2015 and for the University of Antioquia.
Author contributions
A.M.N.-D. and J.Q.-Q. performed the experimental part; A.M.N.-D. wrote the manuscript, J.Q.-Q. and A.M.N.-D.
organized Figs. 1, 2, 3, 4, 5 and 6; John Rojas advised the design of controlled release experiments and G.L.C.-G.
advised the design of experiments for the encapsulation part and finally J.R. and G.L.C.-G. reviewed and cor-
rected the manuscript.
Competing interests
The authors declare no competing interests.
Additional information
Correspondence and requests for materials should be addressed to A.M.N.-D.
Reprints and permissions information is available at www.nature.com/reprints.
Publisher’s note Springer Nature remains neutral with regard to jurisdictional claims in published maps and
institutional affiliations.
Open Access This article is licensed under a Creative Commons Attribution 4.0 International
License, which permits use, sharing, adaptation, distribution and reproduction in any medium or
format, as long as you give appropriate credit to the original author(s) and the source, provide a link to the
Creative Commons licence, and indicate if changes were made. The images or other third party material in this
article are included in the article’s Creative Commons licence, unless indicated otherwise in a credit line to the
material. If material is not included in the article’s Creative Commons licence and your intended use is not
permitted by statutory regulation or exceeds the permitted use, you will need to obtain permission directly from
the copyright holder. To view a copy of this licence, visit http://creativecommons.org/licenses/by/4.0/.
© The Author(s) 2021
Scientific Reports | (2021) 11:1317 | https://doi.org/10.1038/s41598-020-80119-1 10
Vol:.(1234567890)You can also read