More Goals, Fewer Babies? On National Teams' Performance and Birth Rates - DISCUSSION PAPER SERIES - Institute of Labor ...
←
→
Page content transcription
If your browser does not render page correctly, please read the page content below
DISCUSSION PAPER SERIES

IZA DP No. 14448

More Goals, Fewer Babies?
On National Teams’ Performance
and Birth Rates

Luca Fumarco
Francesco Principe

JUNE 2021
DISCUSSION PAPER SERIES

IZA DP No. 14448

More Goals, Fewer Babies?
On National Teams’ Performance
and Birth Rates

Luca Fumarco
Tulane University and IZA
Francesco Principe
Tinbergen Institute and ECASE

JUNE 2021

Any opinions expressed in this paper are those of the author(s) and not those of IZA. Research published in this series may
include views on policy, but IZA takes no institutional policy positions. The IZA research network is committed to the IZA
Guiding Principles of Research Integrity.
The IZA Institute of Labor Economics is an independent economic research institute that conducts research in labor economics
and offers evidence-based policy advice on labor market issues. Supported by the Deutsche Post Foundation, IZA runs the
world’s largest network of economists, whose research aims to provide answers to the global labor market challenges of our
time. Our key objective is to build bridges between academic research, policymakers and society.
IZA Discussion Papers often represent preliminary work and are circulated to encourage discussion. Citation of such a paper
should account for its provisional character. A revised version may be available directly from the author.

 ISSN: 2365-9793

 IZA – Institute of Labor Economics
Schaumburg-Lippe-Straße 5–9 Phone: +49-228-3894-0
53113 Bonn, Germany Email: publications@iza.org www.iza.org
IZA DP No. 14448 JUNE 2021

 ABSTRACT
 More Goals, Fewer Babies?
 On National Teams’ Performance
 and Birth Rates
 Does national team performance boost birth rates? We compiled a unique dataset
 combining country-level monthly birth rates for 50 European countries, along 56 years,
 with measures of national teams’ performance in 27 international football events. We find
 that an increase in national teams’ performance in international cups is associated with a
 drop in birth rates nine months after the event. We hypothesize that these results might be
 explained by individuals’ time allocation choices.

 JEL Classification: I10, J10, J11, J13
 Keywords: football, sporting events, time allocation, birth rates, fertility

 Corresponding author:
 Luca Fumarco
 STATEC Research – National Institute of Statistics and Economic Studies
 Rue Erasme 13
 L-1468, Luxembourg
 Grand-Duchy of Luxembourg
 E-mail: luca.fumarco@statec.etat.lu
1 Introduction
Anecdotic evidence suggests that a great performance in major sports competitions results in births
increase among fans. International press reported various cases, namely a baby boom in Iceland nine
months after the Euro 2016 win against England, an increase in births in Barcelona
after Iniesta’s last-minute goal in the 2009 Champions League semi-final. In the US, this
phenomenon is often referred to as “Super Bowl babies”: an increase in births among fans of the
NFL Super Bowl winning team.

Indeed, major sporting events, such as FIFA World Cup, play an important role in reviving national
pride and are by far the most watched events on television. For example, the latest World Cup,
hosted by Russia in 2018, attracted a total of 3.6 billion watchers worldwide. In Europe, 86.1% of
the population watched at least one minute of the competition (FIFA, 2018). As shown by a recent
literature, the qualification and participation of the national team in the tournament represents the
most relevant predictor of audience size, followed by match quality and scheduling-related variables
(Uribe et al. 2021).

A growing body of literature has investigated the main determinants of birth rates and fertility,
focusing on socioeconomic conditions (Kearney and Wilson 2018; Schaller et al. 2020), religion
(Anderson and Coale 2017; Basedau et al. 2018), natural disasters (Nandi et al. 2018), power outages
(Burlando 2014; Fetzer et al. 2018), mass media exposure (Billari et al. 2019; La Ferrara et al. 2012),
and weather (Barreca et al. 2018). While the idea that euphoria generated by sports success can
nurture hedonic sensations and then increase human conception has been widely suggested in
society and mass media, it has not received much empirical attention. We fill this gap in the literature
and provide the first empirical evidence on the relationship between national sports success and
birth rates.

We compiled a unique dataset combining country-level monthly births for 50 European countries,
along 56 years, with measures of national teams’ performance in 27 major international football
events (i.e., FIFA Wold Cup and UEFA European Football Championship). Our empirical results
contradict the anecdotical evidence. We find that an increase in national teams’ performance is
associated with a reduction in births nine months after the event.

 2
The remainder of this paper is organized as follows. Section 2 describes the data. Section 3 presents
the main empirical analyses, while Section 4 presents some robustness checks. Section 5 discusses
and concludes.

2 Data
We combined data from Eurostat on country-level monthly births for 50 European countries, from
1960 to 2016, with national team’s performance, as measured by the ELO rating system, which is
used by FIFA to compile the world national teams rank.

The ELO system accounts for two aspects of performance. First, it depends on individual match
results and importance. Second, it cumulates through the competition, so it accounts for the
permanence in the competitions and for the different number of games per competition over time.
Both aspects are important for the results interpretation. More details are provided in Appendix A.

Information on national teams’ performance is obtained from Wikipedia and covers 13 European
Championships and 14 World Cups. About half of the competitions takes place between June and
July, half in June, and two in July. Table 1 reports the main descriptive statistics.

 Table 1. Descriptive statistics.
 Variables N Mean SD Min Max
 Monthly births 17,658 15,548.17 22,689.18 5 174,839
 Performance, ELO 17,658 1.628 18.074 0 425
 Organizer 17,658 0.001 0 1
 Year 17,658 1960 2016
 Note: ELO is the rating system used by FIFA.

The ELO score ranges between 0 (i.e., country c did not participate) and 425 (i.e., country c wins the
competition and most matches). Table B.1 in Appendix B shows the complete list of countries, their
first and last year in the Eurostat database.

3 Empirical analysis
To investigate the relationship between national football teams’ performance and birth rates, we
estimate the following equation by means of FE estimator:

 _ ℎ +9 = + _ + + + (1)

 3
Where _ ℎ +9 is the natural logarithm of monthly births in country c and month t+9,
 _ is the standardized measure of national team’s performance, is a dummy
taking value 1 if country c hosted the competition in t. is a vector for time fixed effects, while
country fixed effects are eliminated by the within transformation. Standard errors are clustered at the
level of the country.

Results from estimating Equation (1) are presented in Table 2 and look very robust. Across all the
specifications, we see that, on average, an increase in performance by one standard deviation is
associated with a reduction in monthly births by 0.3% nine months after the event. Thus, these
results challenge the anecdotical narrative often provided by mass media. On the contrary, they
provide strong evidence that national teams’ performance in major sports competitions is associated
with a drop in births.

A back-of-the-envelope calculation of the number of missed births unveils the economic
significance of our results. Let us consider a basic case, a participating country that obtains 127.74
points (i.e., the average score of a participating country); in this case, we could expect a drop in
monthly births by 2.13% ([127.74/18] *0.3) nine months after the competition. More concretely,
consider Italy and France, with average monthly births equal to 52k and 66.5k respectively, this
result corresponds to 1.1k and 1.4k fewer monthly births, respectively.

Table 2. Effect of performance on the natural logarithm of number of births, 9 months after the
beginning of the tournament; fixed-effect parameter estimates.
Variables Ln_Births 9 months after the tournament
 (1) (2) (3) (4) (5) (6) (7) (8)

Std_ELO -0.003** -0.003** -0.003*** -0.003** -0.003* -0.004*** -0.002* -0.003**
 (0.001) (0.001) (0.001) (0.001) (0.001) (0.001) (0.001) (0.001)

Organizer X X X X X X X
Year FE X X
Month FE X
Month × Country FE X X X X
Year × Month X
Year × Month FE X X
Year × Month × X X
Country

N 17,010 17,010 17,010 17,010 17,010 17,010 17,010 17,010
N countries 50 50 50 50 50 50 50 50
Note: Robust standard errors, clustered at country level, in parentheses. *** p
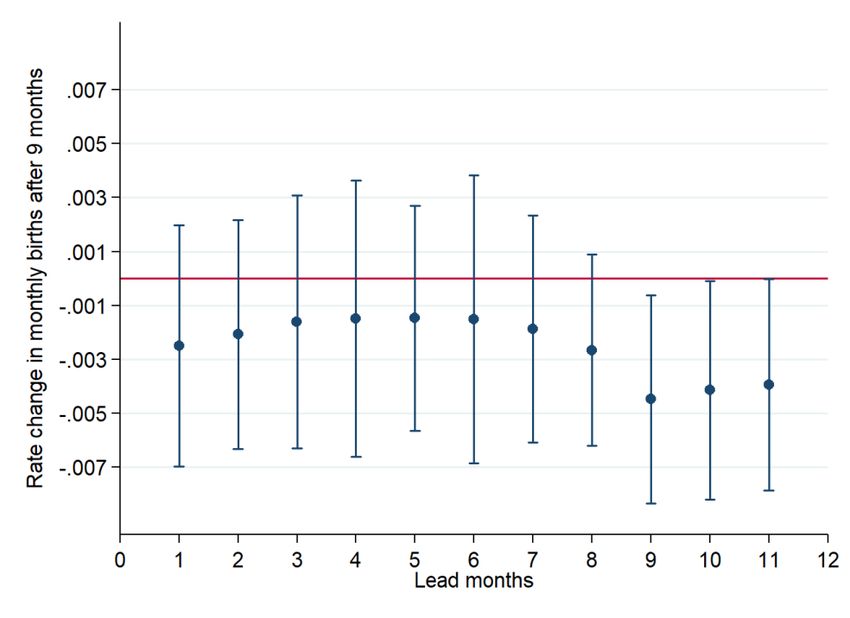
Notice that column (6) to (8) account for general and for country-specific time trends. Among other
unobservable trends, these analyses account for evolution and spread over time of television and
internet. This point is discussed in Section 5.

4 Robustness checks
We conduct a series of falsification tests. First, we conduct analyses on births from 1 to 11 months
after the competition on the subsample of years when the tournaments were held entirely in one
month, either only June or only July. These analyses are based on observations from 17 years (i.e.,
about 4k observations), which gives a smaller sample; thus, we use model specification from Column
(3), Table 2.

Figure 1 illustrates the results. The effect of performance on monthly births is highly statistically
significant nine and ten months after the tournament,1 while the effect after eleven months is on the
edge of significance.2

 Figure 1. Effect of performance on monthly births

1
 That is, eight and nine months after the month when the tournament started, which gives nine and ten months of
gestation respectively.
2
 This is probably due to the lack of information on daily births. Lower conception rate at the end of the month when
the tournament started might reflect into lower birth rates about ten months later, that is, between ten and eleven
months after the beginning of the tournament.

 5
Note: The figure plots the parameter estimates alongside 95% confidence intervals of the analysis which
 estimates Equation (1) on the natural logarithm of births from 1 to 11 months after the tournament.

The results are equivalent to those from Column (3) with the same specification, and from Table 2
more in general.

Additionally, we conduct three randomization tests by means of Montecarlo simulation, 100
repetitions each: (i) we weight the ELO coefficient with a random number between 0 and 1; (ii) we
randomly reassign country-ELO scores across time for participating countries;3 (iii) we randomly
reassign monthly-births within year, for each country. Table 3 reports the results. For comparison
sake, we use the model specification from Column (3) in Table 2.

 Table 3. Effect of performance on the natural logarithm of number of
 births, 9 months after the beginning of the tournament; fixed effect
 parameter estimates. Montecarlo simulations with rescaled ELO and with
 reassigned ELO.
 Simulations
 ELO ELO Births
 rescaling reassignment reassignment
 Variables Ln_Births 9 months after
 (1) (2) (3)

 Std_ELO -0.002 -0.002 -0.002
 (0.001) (0.001) (0.001)
 Note: The table reports average estimates and standard errors across 100 simulations.
 Robust standard errors, clustered at the level of the country, in parentheses. *** p
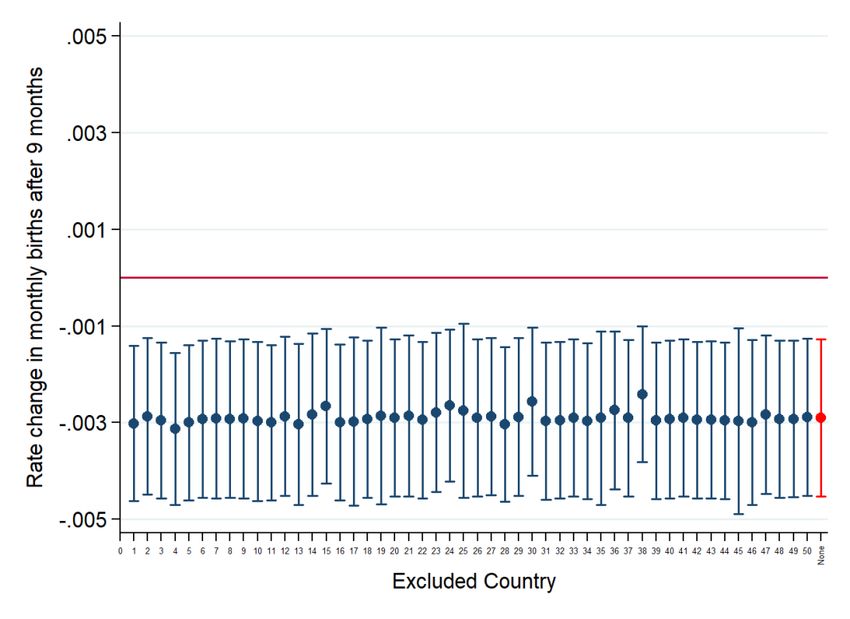
Figure 2. Leave-one-out analysis.

 Note: The figure plots the parameter estimates alongside 95% confidence intervals of the leave-one-out analysis
 which estimates Equation (1) by omitting one Country at time. The red diamond/line refers to the baseline
 estimate with no omitted Country.

5 Discussion
We have analysed the relationship between national teams’ performance in major sports
competitions and birth rates. We find that an increase in national team performance in international
football competitions is associated with a drop in births nine months after the event.

Our paper contributes to shed light on the social determinants of birth rates and fertility. While our
data provide a neat longitudinal framework, they do not allow us to investigate mechanisms linking
national teams’ performance and birth rates. We hypothesize that these results might be explained
by individuals’ time allocations choices (Mincer, 1963; Becker, 1965). In this framework, the
attendance of live events (e.g., from late afternoon to late night, on TV, at the stadium, on big

 7
screens in public places4) may reduce the time spent on physical intimacy as suggested in other
studies (Grimm et al., 2015; Dewi et al., 2017; Johnson, 2001; Hornik and McAnany, 2001). As a
support to this substitution mechanism, it is important to notice that contrary to other
entertainment video activities (e.g., watching movies and series, connecting on online social media),
sports events are characterized by their uniqueness and unrepeatability as well as by their collective
engagement. On top of that, good national teams’ performances are likely followed by celebrations
with friends and fellow countrymen, which reduces even more physical intimacy time. Differently,
bad performances cause early exclusion from the tournament, without disrupting intimacy time. To
this end, time allocation choices seem more salient than euphoria in explaining reproductive
behaviour.

Our results have implications for both economics and demography. On one hand, in high-fertility
settings, such as developing countries, governments may aim at reducing births, even with indirect
interventions, such as increasing access to entertainment activities and TV. On the other hand, our
results suggest that an increase in entertainment activities may reduce births even in low-fertility
settings, such as most European countries, where governments typically aim at increasing fertility.
While the effect of the massive increase in the consumption of media and entertainment in rich
countries is broadly debated (Wallsten, 2013), its specific effect on reproductive behaviour remains
largely unexplored.

4
 Historically, also World Cups outside of Europe scheduled matches at times corresponding to late afternoon/night in
Europe (e.g., the US and Brazil World Cups).

 8
References

Anderson, B. A., & Coale, A. J. (2017). Regional and cultural factors in the decline of marital fertility
in Europe. In The decline of fertility in Europe (pp. 293-313). Princeton University Press.
Barreca, A., Deschenes, O., & Guldi, M. (2018). Maybe next month? Temperature shocks and
dynamic adjustments in birth rates. Demography, 55(4), 1269-1293.
Basedau, M., Gobien, S., & Prediger, S. (2018). The multidimensional effects of religion on
socioeconomic development: a review of the empirical literature. Journal of Economic Surveys, 32(4),
1106-1133.
Becker, G. S. (1965). A Theory of the Allocation of Time. The Economic Journal, 75(299), 493-517.
Billari, F. C., Giuntella, O., & Stella, L. (2019). Does broadband Internet affect fertility?. Population
Studies, 73(3), 297-316.
Burlando, A. (2014). Power outages, power externalities, and baby booms. Demography, 51(4), 1477-
1500.
Fetzer, T., Pardo, O., & Shanghavi, A. (2018). More than an urban legend: the short-and long-run
effects of unplanned fertility shocks. Journal of Population Economics, 31(4), 1125-1176.
FIFA (2018). 2018 FIFA World Cup Russia™ Global broadcast and audience summary. Available
at: www.fifa.com. Last accessed: 10/05/2021
Kearney, M. S., & Wilson, R. (2018). Male earnings, marriageable men, and nonmarital fertility:
Evidence from the fracking boom. Review of Economics and Statistics, 100(4), 678-690.
La Ferrara, O., Ching, A., Duryea, S. (2012). Soap Operas and Fertility: Evidence from Brazil.
American Economic Journal: Applied Economics 2012, 4(4), 1-31.
Mincer, J. (1963) Market Prices, Opportunity costs, and Income Effects, in Measurement in Economics:
Studies in Mathematical Economics and Econometrics in honor of Yehuda Grunfield, ed. C. Christ, (Stanford,
California: Stanford University Press).
Nandi, A., Mazumdar, S., & Behrman, J. R. (2018). The effect of natural disaster on fertility, birth
spacing, and child sex ratio: evidence from a major earthquake in India. Journal of Population
Economics, 31(1), 267-293.
Schaller, J., Fishback, P., & Marquardt, K. (2020). Local Economic Conditions and Fertility from the
Great Depression through the Great Recession. AEA: Papers and Proceedings, 110, 236-240.
Uribe, R., Buzeta, C., Manzur, E., & Alvarez, I. (2021). Determinants of football TV audience: The
straight and ancillary effects of the presence of the local team on the FIFA world cup. Journal of
Business Research, 127, 454-463.
Wallsten, S. (2013). What Are We Not Doing When We’re Online. National Bureau of Economic
Research, w19549.

 9
Appendix A: FIFA ELO score To build our measure of national team’s performance, we follow the official ELO system used by FIFA. The computation of individual national teams’ performance in one international cup proceeds in two stages: first, we multiply the importance and result coefficient (see below) for each game played by one national team and, second, we sum the results of these multiplications across matches for the same national team, within the same competition. These are the two coefficients we combine: importance coefficient: 50 for matches before quarter-finals and 60 for matches in quarter-finals or later. In this dataset we have coefficients only on the final stages of international tournaments. result coefficient: 0 for a loss after regular or extra time, 0.5 for a draw or loss in a penalty shootout, 0.75 for a victory in a penalty shootout, 1 for a victory after regular or extra time. If a game ends with a winner but still requires a penalty shootouts (i.e., in the second game of a two- legged tie), it is scored as a regular game (e.g., the score is based on the regular time result). Since we are simply interested in studying a proxy for the national team’s two-performance in an international tournament, we modify the official ELO scoring system to account for four aspects. First, international competitions format changed slightly over time, with some earlier competitions having a small group stage before the semi-finals, which factually corresponded to quarter-finals. Therefore, we assigned the importance coefficient equal to 60 to matches at that stage as well. Second, we added 60 additional points to the team that wins the international cup, regardless of whether the match ends after the regular time, extra time or penalty shootouts; a final victory has to count more than a victory in the semifinals or earlier. Third, we added 1 point to all of the national teams that participate to the international cup (i.e., a national team is assigned at least 1 point, even after loosing all of the matches in the international cup). A team that participates but looses all of the matches is still better off than a team that does not participate at all. Fourth, we are not considering ELO points assigned by the FIFA to national teams up until the tournament (i.e., points cumulated during qualification matches to the final stages of the competition); related to that, we are not accounting for the opponent team strength. 10
We conduct additional robustness checks that exclude the victory bonus (i.e., the second change in
the ELO scoring system). The results are identical; it is not surprising, given that the amount of
countries that are in the Eurostat database and win an international tournament is very small (i.e.,
17).

 11
Appendix B: Countries and Years

Table B.1 First and last year in the database, by country.
Country First year Last year
Albania 1997 2016
Andorra 2005 2012
Armenia 2005 2016
Austria 1960 2016
Azerbaijan 2005 2016
Belarus 2005 2015
Belgium 1960 2016
Bosnia and Herzegovina 2003 2012
Bulgaria 1994 2016
Croatia 1994 2016
Cyprus 1994 2016
Czech Republic 1990 2016
Denmark 1960 2016
Estonia 1960 2016
Finland 1960 2016
Former Yugoslav Republic of Macedonia 1994 2016
France 1994 2016
Georgia 2005 2015
Germany 1991 2016
Greece 1969 2016
Hungary 1994 2016
Iceland 1960 2016
Ireland 1969 2016
Italy 1960 2016
Kosovo under United Nations security 2005 2015
Latvia 1996 2016
Liechtenstein 1980 2016
Lithuania 1994 2016
Luxembourg 1960 2016
Malta 1994 2016
Moldova 2005 2016
Monaco 2005 2005
Montenegro 2005 2016
Netherland 1960 2016
Norway 1960 2016
Poland 1995 2016
Portugal 1969 2016
Romania 1995 2016

 12
Russia 2005 2013
 San Marino 2005 2012
 Serbia 2000 2016
 Slovakia 1996 2016
 Slovenia 1994 2016
 Spain 1960 2016
 Sweden 1960 2016
 Switzerland 1960 2016
 Turkey 2004 2016
 Ukraine 2005 2015
 United Kingdom 1973 2016
 Western Germany 1960 1990
Note: Countries entry to and exit from the database follows exogenous political agreements. Countries that
have split over this time period are usually countries from the former Soviet bloc and former Yugoslavia.
These countries enter the Eurostat database after they split. The database includes Western Germany from
1960 to 1990, while from 1991 it includes the unified Germany. Countries names in Table B.1 are those used
in the Eurostat database.

 13
You can also read


