Mortality during tuberculosis treatment in South Africa using an 8 year analysis of the national tuberculosis treatment register
←
→
Page content transcription
If your browser does not render page correctly, please read the page content below
www.nature.com/scientificreports
OPEN Mortality during tuberculosis
treatment in South Africa using
an 8‑year analysis of the national
tuberculosis treatment register
Muhammad Osman1*, Cari van Schalkwyk2, Pren Naidoo1, James A. Seddon1,3,
Rory Dunbar1, Sicelo S. Dlamini4, Alex Welte2, Anneke C. Hesseling1 &
Mareli M. Claassens1,5*
In 2011, the South African HIV treatment eligibility criteria were expanded to allow all tuberculosis
(TB) patients lifelong ART. The impact of this change on TB mortality in South Africa is not known.
We evaluated mortality in all adults (≥ 15 years old) treated for drug-susceptible TB in South Africa
between 2009 and 2016. Using a Cox regression model, we quantified risk factors for mortality during
TB treatment and present standardised mortality ratios (SMR) stratified by year, age, sex, and HIV
status. During the study period, 8.6% (219,618/2,551,058) of adults on TB treatment died. Older age,
male sex, previous TB treatment and HIV infection (with or without the use of ART) were associated
with increased hazard of mortality. There was a 19% reduction in hazard of mortality amongst all
TB patients between 2009 and 2016 (adjusted hazard ratio: 0.81 95%CI 0.80–0.83). The highest SMR
was in 15–24-year-old women, more than double that of men (42.3 in 2016). Between 2009 and 2016,
the SMR for HIV-positive TB patients increased, from 9.0 to 19.6 in women, and 7.0 to 10.6 in men.
In South Africa, case fatality during TB treatment is decreasing and further interventions to address
specific risk factors for TB mortality are required. Young women (15–24-year-olds) with TB experience a
disproportionate burden of mortality and interventions targeting this age-group are needed.
In 2018, an estimated 10 million people developed tuberculosis (TB) disease worldwide and, among adults
(≥ 15 years old), 64% of cases occurred in men1. Despite progress towards reducing TB mortality, it remained
the leading cause of death from an infectious disease globally, with an estimated 1.5 million (15%) d eaths1. A
systematic review found that case fatality during TB treatment ranged from 1.8 to 33.3%; male sex was identified
as a risk factor for d eath2. Understanding mortality in adults on TB treatment presents an opportunity to plan
interventions to reduce mortality amongst individuals already engaged with health services.
In sub-Saharan Africa, the dual HIV and TB epidemics have been well described. Prior to the rollout of
antiretroviral therapy (ART) the observed rise in TB case fatality ratio (CFR) was linked to increasing HIV
prevalence3. In South Africa, routine HIV testing was implemented in 2 0104 and in 2012 the ART policy
expanded so that all HIV-positive TB patients were eligible for lifelong ART5. ART uptake in South Africa has
been variable with adult women showing the greatest uptake of ART6.
The dramatic effect of ART on reducing mortality among HIV-positive TB patients has been documented
under both t rial7 and routine programmatic conditions8. In low- and middle-income countries, the effect of wide-
scale ART rollout on mortality has varied by sex, with greater reductions in mortality observed in women9–11. A
recent systematic review showed a mortality reduction of 44–71% among HIV-positive TB patients with the use
of ART8. In South Africa, modelling work has shown that while the ART rollout has contributed to a substantial
number of lives saved, almost 2.2 million people died between 2000 and 2014 due to delays in the rollout12.
1
Desmond Tutu TB Centre, Department of Paediatrics and Child Health, Faculty of Medicine and Health Sciences,
Stellenbosch University, Francie van Zijl Drive, Parow, Cape Town 7505, South Africa. 2DSI‑NRF South African
Centre of Excellence in Epidemiological Modelling and Analysis (SACEMA), Stellenbosch University, Stellenbosch,
South Africa. 3Department of Infectious Diseases, Imperial College London, London, UK. 4Research Information
Monitoring, Evaluation & Surveillance (RIMES), National TB Control & Management Cluster, National Department
of Health, Pretoria, South Africa. 5Department of Biochemistry and Microbiology, School of Medicine, University
of Namibia, Bach Street, Windhoek, Namibia. *email: mosman@sun.ac.za; mcla@sun.ac.za
Scientific Reports | (2021) 11:15894 | https://doi.org/10.1038/s41598-021-95331-w 1
Vol.:(0123456789)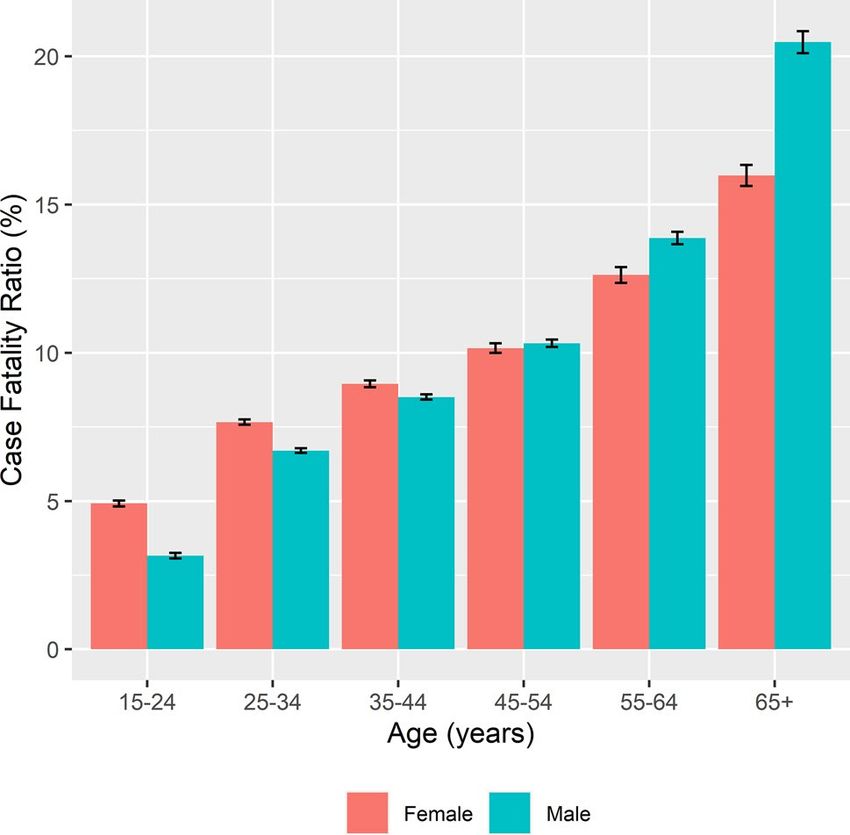
www.nature.com/scientificreports/
Understanding the changes in mortality during TB treatment by age and sex, in the context of the scale up of
ART, may provide insights into how health programs can deliver targeted services to further reduce TB mortality
in South Africa and globally.
The impact of the revised TB, HIV and ART policies on mortality during TB treatment in South Africa, and
how the impact has differed by sex, is not well known. Using an individual patient-based national electronic TB
treatment register of drug-susceptible TB treatment we documented the changes in TB mortality compared to
the general population mortality and identified risk factors for death during TB treatment.
Methods
Context. South Africa had an estimated population of 55.7 million in 2016, a 11.6% increase from 49.9
million in 200912. The country offers a district health service with 52 health districts delivering public health
services, across 9 provinces. In 2018, South Africa had an estimated TB incidence of 520/100,000 per year and
approximately 59% of TB patients were HIV-positive1. Laboratory diagnosis of TB in South Africa utilised smear
microscopy, culture and line probe assay until 2011, after which the GeneXpert MTB/RIF assay (Xpert; Cepheid,
Sunnyvale, CA) was progressively introduced for the testing of all patients with presumptive TB.
Electronic TB register (ETR.Net). In South Africa, all patients were presumed to have drug-susceptible
TB, unless drug susceptibility testing demonstrated resistance, and were routinely registered in a paper-based
register at a TB treatment facility when initiating treatment. This register was validated by facility managers and
sub-district co-ordinators before it was captured into an electronic TB register (ETR.Net), and aggregated at
district, provincial and national level13. We obtained national and provincial ETR.Net dispatch files and under-
took a process of merging, de-duplication, and data cleaning. ETR.Net includes a unique identifier and this was
used to identify duplicate records that were merged before deletion to provide complete data on HIV, treatment
dates and outcomes. HIV data in ETR.Net is variably completed and may include HIV status, CD4 count, and
the use of cotrimoxazole preventive therapy or ART. Within ETR.Net each patient was recorded for the first
time as a newly registered patient and could then move or be transferred between facilities in the country. A
cohort including all newly registered TB patients was used to report on TB case finding and a reporting cohort
accounting for patient movement during treatment was used for the reporting of TB treatment outcomes. For
this analysis, the South African reporting cohort was used.
The Thembisa model. Estimates of population denominators, HIV prevalence, and mortality were
extracted from the Thembisa project (https://www.thembisa.org/), a publicly available mathematical model of
HIV and general demographic statistics14. The model uses age and sex-specific mortality estimates based on an
analysis of South African cause-of-death statistics and the South African National Burden of Disease study, and
projects mortality from 2016 to 203012.
Design. This study is a retrospective cohort analysis of mortality among all adults (≥ 15 years) in South Africa
routinely started on drug-susceptible TB treatment between 1 January 2009 and 31 December 2016.
Definitions. Consistent with global reporting of TB we considered adults as those ≥ 15 years o ld1,15. Table 1
includes the definitions used for variables recorded within ETR.Net15. For outcome definitions the standard
WHO and national TB program definitions were u sed15,16. CFR was calculated as the proportion of deaths as
compared to the total number of people on TB treatment. The total number of people on TB treatment included
patients with unknown outcomes. Two additional outcome variables were constructed to evaluate unfavourable
outcomes (‘Outcome 2’) and mortality among patients with known final outcomes (‘Outcome 3’). Person-time
was calculated as the difference between the TB treatment start date and treatment outcome date, representing
the person-years on TB treatment. TB deaths refer to deaths due to any cause during the TB treatment episode
and underlying cause of death was not evaluated. This is consistent with the national TB program and WHO
definition15,16.
Statistical analysis. We conducted descriptive statistics for categorical variables and stratified these by
HIV status. Changes over time were evaluated by year and graphically illustrated. CFRs were calculated by age,
sex and HIV-status and provide a conservative estimate of mortality as the true mortality status of TB patients
who were transferred out, lost to follow up or not evaluated at the end of treatment is unknown. A Cox propor-
tional hazards model was used to determine the unadjusted and adjusted hazard ratios (HRs) with 95% confi-
dence intervals (CI) for predictors of death. Following univariate analyses, predictors were added incrementally
observing the change in significance of the likelihood ratio test of each model and collinearity between variables
was considered before developing the final adjusted model. The Thembisa model provided the expected mor-
tality rate per demographic category for each year for the general population of South A frica14. The expected
mortality is informed by all causes and includes TB. The product of the expected mortality and person-years in
the TB reporting cohort provided the number of expected deaths in the TB cohort. The standardised mortality
ratios (SMR) were calculated as the ratio between the observed TB deaths and the expected deaths within the
TB cohort. The data analysis for this paper was generated using SAS software, Version 9.4 of the SAS System for
Windows. Copyright 2002–2012 SAS Institute Inc. SAS and all other SAS Institute Inc. product or service names
are registered trademarks or trademarks of SAS Institute Inc., Cary, NC, USA.
Scientific Reports | (2021) 11:15894 | https://doi.org/10.1038/s41598-021-95331-w 2
Vol:.(1234567890)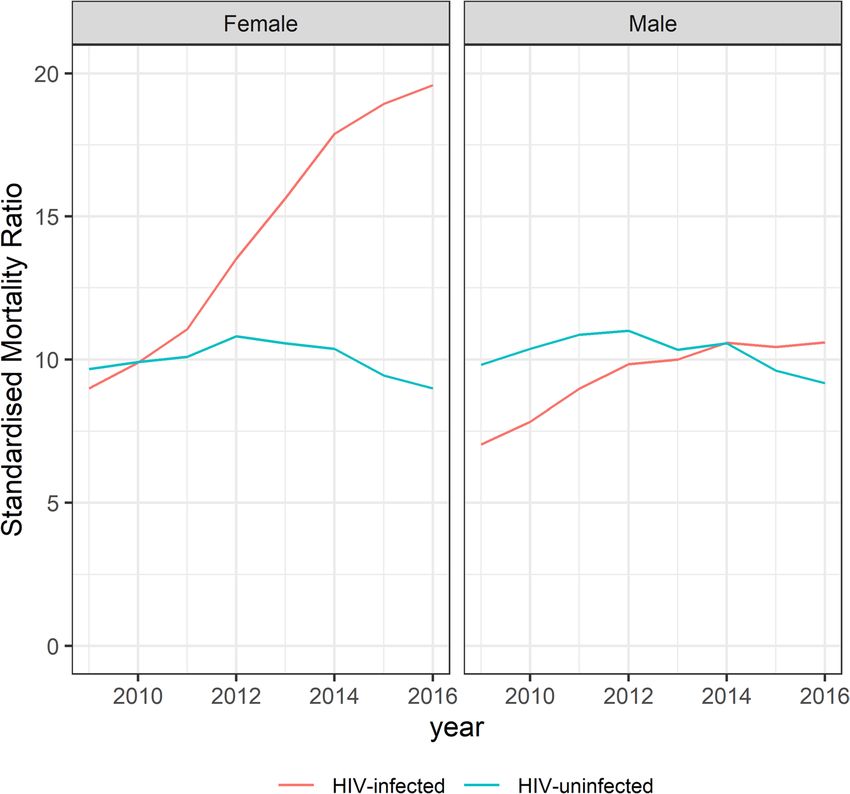
www.nature.com/scientificreports/
Variable Categories Definition
Newly treated Patients who had no reported previous TB treatment or had received less than 4 weeks of TB treatment at any stage
Previous TB treatment history Patients who received more than 4 weeks of anti-tuberculosis treatment previously, regardless of the time since the previous
Retreatment
episode
Pulmonary TB Site of disease included any pulmonary involvement
Site of disease
Extrapulmonary TB Site of disease exclusively affecting any organ other than the lung parenchyma
a
Disseminated ICD10 codes for TB meningitis or miliary TB were combined
Extent of disease
Not disseminated All other ICD10 codes
Determined using HIV test results, CD4 results, documentation of co-trimoxazole preventive therapy or use of ART. ART
HIV-positive use does not include date of starting ART and cannot differentiate ART before TB or those started on ART during TB treat-
ment
HIV statusb
HIV-negative Documented negative results in TB treatment register
HIV unknown HIV status unable to be determined from results or inference
Success Cured or treatment completed
Died Death due to any cause during the TB treatment episode
Patients who interrupted TB treatment for 2 consecutive months or patients where a treatment outcome is not allocated and
Lost-to-follow-up
an outcome of ‘not evaluated’ was recorded in ETR.Net
Outcome 1c
Patients who were microbiologically positive at the start of treatment and remain or become positive after at least 5 months
Failed
of TB treatment
Drug resistance Patient diagnosed with drug resistance after 12 weeks of TB treatment
Transferred out Patient who was referred to a facility in another district and the final TB treatment outcome is not known
Favourable Patients successfully treated for TB (cured or completed)
Outcome 2
Unfavourable A combined definition of all negative outcomes including died, lost-to-follow-up, failed, drug resistance, or transferred out
Dead Death due to any cause during the TB treatment episode
Outcome 3 Patients who were known not to have died at the end of TB treatment including success, failed or drug resistance. This
Alive
excludes patients who were lost-to-follow-up or transferred out where mortality is not known
Table 1. Definitions used in the study based on variables recorded within ETR.Net and classified according
to the WHO reporting framework. ART: antiretroviral therapy; ETR.Net: Electronic tuberculosis register;
ICD10: International classification of disease 10; TB: tuberculosis. a Extent of disease could only be ascertained
where an ICD10 code was documented. b HIV status is typically recorded at the start of TB treatment but may
be updated during TB treatment. c Outcomes are assigned by routine treating clinicians and ETR.Net includes
pre-programmed algorithms to verify outcomes consistent with WHO and National Department of Health
definitions.
Ethics. The National Department of Health, National TB program provided permission for this analysis and
approval was received from the Stellenbosch University Health Research Ethics Committee (N16/07/088). A
waiver of informed consent was granted from Stellenbosch University Health Research Ethics Committee. All
methods were carried out in accordance with relevant guidelines and regulations.
Results
The South African reporting cohort for drug-susceptible TB included 2,551,058 adults, 55.9% men, treated
between 2009 and 2016 (Table 2). HIV testing and recording increased from 54.8% of individuals with TB having
a known HIV status in 2009, to 96.7% in 2016 (Table 2 and Supplementary Figure 1).
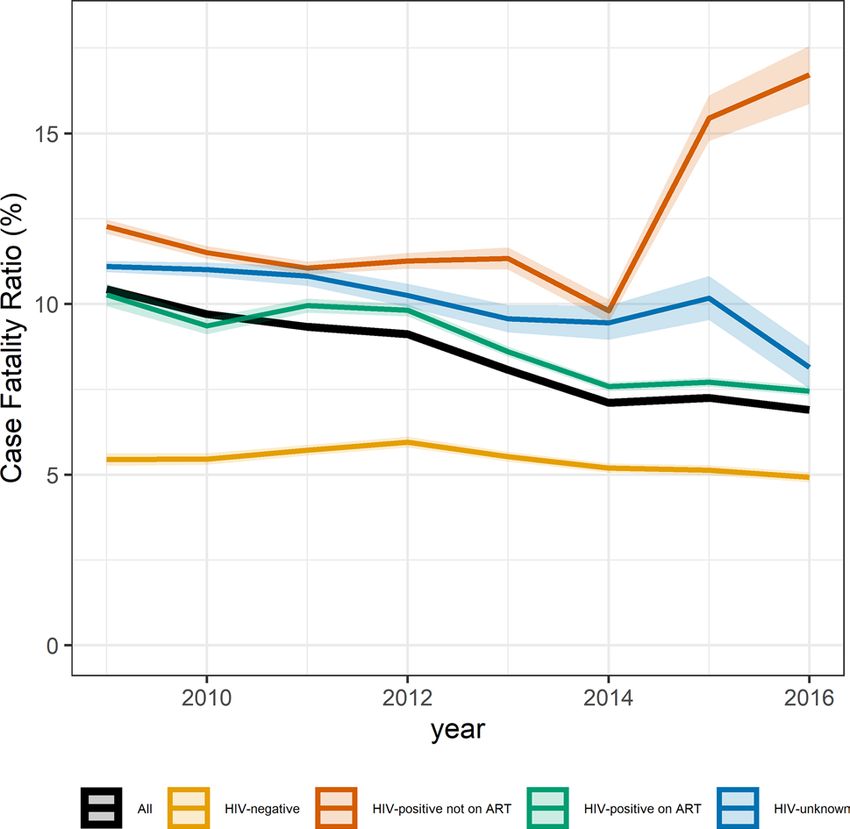
Case fatality ratios. Over the 8 years 219,618 deaths were documented. The TB CFR decreased from 10.4%
in 2009, to 6.9% in 2016 (Fig. 1). The CFR for HIV-negative individuals increased from 5.5% in 2009 to 6.0%
in 2012 and then decreased to 4.9% in 2016. The CFR for HIV-positive patients not on ART increased over the
study period to 16.1% in 2016. The CFR for HIV-positive individuals on ART decreased from 10.2% in 2009 to
7.4% in 2016 (Fig. 1). The CFR differed by age and sex: among 15–24-year-olds, 4.9% of women died compared
to 3.2% of men. Among 65+ year-olds, men had a CFR of 20.5% compared to 16.0% in women over the entire
period (Fig. 2). Treatment success increased from 70.2% in 2009 to 80.4% in 2016. Lost-to-follow-up decreased
from 12.4% in 2009 to 9.4% in 2016. Unfavourable outcomes decreased from 29.8% in 2009 to 19.7% in 2016.
Outcome 3, death among adults with known TB treatment outcomes, decreased from 12.8% in 2009 to 7.9% in
2016 (Supplementary Table 1).
Risk factors for death. Increasing age was associated with increased hazard of death with 65+ year-olds
having an adjusted hazard ratio (aHR) of 5.22 (95%CI 5.10–5.33) compared to 15–24-year-olds. Compared to
HIV-negative TB patients, HIV-positive patients not on ART had an aHR of 2.71 (95%CI 2.67–2.75); patients
with unknown HIV status had an aHR 2.19 (95%CI 2.15–2.22) and HIV-positive on ART had an aHR of 1.84
(95%CI 1.81–1.86). Previous TB treatment history and extrapulmonary TB had an increased hazard of death
with the risk declining over time (Table 3). We explored effect modification by sex and time in stratified models
and found differences in point estimates for age categories and HIV status (Supplementary Tables 2 and 3).
Scientific Reports | (2021) 11:15894 | https://doi.org/10.1038/s41598-021-95331-w 3
Vol.:(0123456789)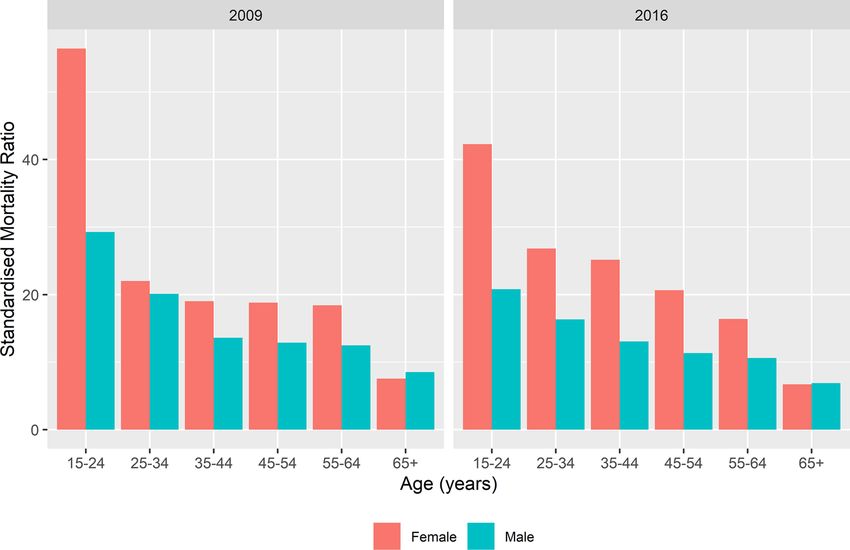
www.nature.com/scientificreports/
HIV unknown HIV-positive HIV-negative Total
n col % n col % n col % n col %
Total 395,486 100 1,443,557 100 712,015 100 2,551,058 100
15–24 years 59,020 14.9 126,747 8.8 157,973 22.2 343,740 13.5
25–34 years 116,147 29.4 517,793 35.9 157,445 22.1 791,385 31.0
35–44 years 99,473 25.2 480,515 33.3 120,213 16.9 700,201 27.4
Age category
45–54 years 64,703 16.4 229,060 15.9 121,999 17.1 415,762 16.3
55–64 years 33,439 8.5 73,147 5.1 87,547 12.3 194,133 7.6
65 + years 22,704 5.7 16,295 1.1 66,838 9.4 105,837 4.1
Female 162,900 41.2 703,339 48.7 257,618 36.2 1,123,857 44.1
Sex
Male 232,586 58.8 740,218 51.3 454,397 63.8 1,427,201 55.9
New 334,507 84.6 1,240,553 85.9 613,707 86.2 2,188,767 85.8
Previous TB disease
Retreatment 60,979 15.4 203,004 14.1 98,308 13.8 362,291 14.2
EPTB 50,802 12.8 211,941 14.7 60,916 8.6 323,659 12.7
Site of disease
PTB 344,684 87.2 1,231,616 85.3 651,099 91.4 2,227,399 87.3
Not disseminated 350,036 97.0 1,283,236 95.7 656,757 98.6 2,290,029 96.7
Disseminated TB a
Disseminated 10,645 3.0 57,059 4.3 9495 1.4 77,199 3.3
Cured/completed 266,336 67.3 1,065,118 73.8 566,009 79.5 1,897,463 74.4
Died 42,478 10.7 138,992 9.6 38,577 5.4 220,047 8.6
Drug resistance 2310 0.6 9297 0.6 3881 0.5 15,488 0.6
Outcome 1b
Failed 1426 0.4 4117 0.3 3403 0.5 8946 0.4
Loss to follow up 57,240 14.5 157,657 10.9 75,641 10.6 290,538 11.4
Transferred out 25,696 6.5 68,376 4.7 24,504 3.4 118,576 4.6
Favourable 266,336 67.3 1,065,118 73.8 566,009 79.5 1,897,463 74.4
Outcome 2c
Unfavourable 129,150 32.7 378,439 26.2 146,006 20.5 653,595 25.6
Alive 270,072 86.4 1,078,532 88.6 573,293 93.7 1,921 897 89.7
Outcome 3d
Dead 42,478 13.6 138,992 11.4 38,577 6.3 220,047 10.3
2009 161,905 40.9 140,465 9.7 59,007 8.3 361,377 14.2
2010 93,587 23.7 188,840 13.1 78,089 11 360,516 14.1
2011 51,202 12.9 209,485 14.5 93,095 13.1 353,782 13.9
2012 33,845 8.6 196,722 13.6 92,669 13 323,236 12.7
Year of TB treatment
2013 22,869 5.8 188,816 13.1 98,050 13.8 309,735 12.1
2014 14,563 3.7 192,718 13.4 103,816 14.6 311,097 12.2
2015 9413 2.4 173,058 12 98,118 13.8 280,589 11.0
2016 8102 2 153,453 10.6 89,171 12.5 250,726 9.8
Table 2. Demographic and clinical characteristics of all adults (≥ 15 years) routinely treated for drug-
susceptible TB in the South African reporting cohort, stratified by HIV status, aggregated for 2009–2016. ETR.
Net: electronic tuberculosis register; ICD10: International classification of disease 10; TB: tuberculosis; EPTB:
extrapulmonary TB. a Disseminated TB was defined using the ICD10 coding, with miliary TB and neurological
TB classified as disseminated TB and all other ICD10 codes as not disseminated. Missing ICD10 codes
n = 183,830. b Outcome 1, as classified in ETR.Net, combining cure and complete for success; and all patients
without outcomes as lost to follow up. c Outcome 2, a binary outcome with success as the only favourable
outcome and all other outcomes considered unfavourable. d Outcome 3, patients in whom a final vitality status
is unknown (lost to follow up, moved or not evaluated) n = 409,114 were excluded.
Standardised mortality ratios. SMRs for age, sex and HIV were calculated over time. Women,
15–24 years old with TB had a SMR of 56.4 in 2009 compared to 42.3 in 2016. The SMR for men of the same
age was 29.3 in 2009 and 20.8 in 2016. The SMR decreased by age and for 65+ year-olds the SMR for men was
6.9 and for women was 6.7 in 2016 (Fig. 3 and Supplementary Figure 2). Among HIV-positive TB patients the
SMRs increased over time, for women the SMR increased from 9.0 in 2009 to 19.6 in 2016 and for men from 7.0
in 2009 to 10.6 in 2016. For HIV-negative TB patients, there was limited change in the SMR over time (Fig. 4).
Discussion
TB CFR during treatment in South Africa is declining but remains high, with 6.9% of adult TB patients dying
in 2016. Older age, male sex, previous TB treatment history and HIV status (with or without the use of ART)
were associated with increased hazard of death during TB treatment. When compared to mortality in the general
population, younger patients with TB had a substantially greater SMR, the highest in young women (15–24-year-
olds). The SMR for HIV-positive TB patients increased over time, with a sharper increase among HIV-positive
women compared to men.
Scientific Reports | (2021) 11:15894 | https://doi.org/10.1038/s41598-021-95331-w 4
Vol:.(1234567890)www.nature.com/scientificreports/
Figure 1. Overall South African case fatality ratio and 95%CI for adults (≥ 15 years) routinely treated for drug-
susceptible tuberculosis, stratified by HIV status 2009–2016. ART: antiretroviral therapy; TB: tuberculosis. Case
fatality ratio is calculated as percentage of deaths among all those with TB, regardless of known or unknown
outcomes.
Figure 2. Case fatality ratio of adults (≥ 15 years) on drug-susceptible tuberculosis treatment by age category
and sex for the combined period 2009–2016, South Africa. Case fatality ratio is calculated as percentage of
deaths among all those with TB, regardless of known or unknown outcomes.
South Africa has seen an overall decrease in the TB CFR, but stratification by HIV status and ART is crucial
to understand underlying patterns. While an overall decline in the CFR to 6.9% in 2016 was documented, when
disaggregated by HIV status, the CFR clearly showed an increase in HIV-positive TB patients not on ART, very
little change for HIV-negative individuals, and the steepest decline in TB CFR in HIV-positive TB patients
on ART. By 2016, more than 94% of HIV-positive TB patients were on ART and the increasing CFR among
HIV-positive patients not on ART therefore reflected the small minority of HIV-positive patients. This group
likely reflects those most disengaged with the health system and are a priority group for intervention and ART
Scientific Reports | (2021) 11:15894 | https://doi.org/10.1038/s41598-021-95331-w 5
Vol.:(0123456789)www.nature.com/scientificreports/
Univariate Cox Multivariable Cox
Total Dead Outcome 3c regressiond regressiond
n n % HR (95%CI) aHR (95%CI)
15–24 years 279,452 13,922 5.0 Reference Reference
25–34 years 644,837 55,122 8.5 1.73 (1.7–1.76) 1.42 (1.4–1.45)
35–44 years 584,348 59,160 10.1 2.06 (2.02–2.09) 1.66 (1.63–1.69)
Age category
45–54 years 354,032 41,649 11.8 2.41 (2.37–2.46) 2.11 (2.07–2.15)
55–64 years 167,905 25,480 15.2 3.19 (3.13–3.26) 3.15 (3.09–3.22)
65+ years 91,845 19,053 20.7 4.54 (4.44–4.64) 5.22 (5.1–5.33)
Male 1,172,409 121,491 10.4 Reference Reference
Sex
Female 950,010 92,895 9.8 0.94 (0.93–0.95) 0.95 (0.94–0.95)
HIV-negative 607,943 37,971 6.2 Reference Reference
HIV unknown 308,414 40,629 13.2 2.14 (2.11–2.17) 2.17 (2.13–2.2)
HIV status HIV-positive not on
419,369 59,755 14.2 2.32 (2.3–2.35) 2.66 (2.62–2.69)
ART
HIV-positive on ART 786,693 76,031 9.7 1.55 (1.53–1.57) 1.86 (1.83–1.88)
New 1,839,987 176,943 9.6 Reference Reference
Previous TB treatment
Retreatment 282,432 37,443 13.3 1.3 (1.29–1.32) 1.27 (1.26–1.29)
PTB 1,861,447 177,375 9.5 Reference reference
Site of disease
EPTB 260,972 37,011 14.2 1.43 (1.42–1.45) 1.41 (1.39–1.42)
Not disseminated 1,913,826 183,896 9.6 Reference
Disseminated TBa,b
Disseminated 62,196 12,556 20.2 2.05 (2.02–2.09)
2009 291,600 36,594 12.5 Reference Reference
2010 285,348 33,838 11.9 0.94 (0.93–0.96) 0.97 (0.96–0.99)
2011 292,643 32,185 11.0 0.87 (0.86–0.88) 0.93 (0.92–0.95)
2012 271,845 28,754 10.6 0.84 (0.83–0.85) 0.96 (0.94–0.97)
Year of TB treatment
2013 262,554 24,402 9.3 0.75 (0.74–0.76) 0.92 (0.91–0.94)
2014 251,812 21,527 8.5 0.7 (0.69–0.71) 0.89 (0.88–0.91)
2015 246,557 20,018 8.1 0.66 (0.64–0.67) 0.85 (0.84–0.87)
2016 220,060 17,068 7.8 0.63 (0.61–0.64) 0.81 (0.8–0.83)
Table 3. Univariate and multivariable Cox regression model predicting hazard and adjusted hazard ratio of
death among adults (≥ 15 years) with drug-susceptible TB and known vitality status, South Africa, 2009–2016
(n = 2,122,419). ART: antiretroviral therapy; EPTB: extrapulmonary TB; ICD10: International classification
of disease 10; PTB: pulmonary TB; TB: tuberculosis. p-values not shown, all p-values in multi variable model
significant < 0.0001. a Disseminated TB not added to final model due to collinearity with site of TB disease.
b
Disseminated TB included 146,397 with unknown classification due to missing ICD10 codes. c Outcome 3:
calculated as percentage of deaths among those with known outcomes where person time on treatment was
documented. d Cox regression models restricted to individuals with known final vitality status. Unknown
outcomes (lost to follow up, moved or not evaluated) n = 409,114 excluded.
initiation. During this period, South Africa expanded its HIV testing program, scaled up ART for HIV-positive
patients17, and in 2011, introduced Xpert as routine testing for presumptive TB p atients18. Prior to these efforts
more people would have experienced diagnostic delays and death prior to TB diagnosis or treatment initiation
resulting in higher levels of under-reporting of total TB mortality. In addition, as drug susceptibility testing for
all presumptive TB patients was not previously available, CFRs in earlier years may have also been higher due to
those with undiagnosed drug-resistant TB. It is probable that the TB treatment category ‘retreatment’ included
more drug-resistant TB in the earlier years of the cohort. This is supported by the stratified analyses which
showed the aHR for retreatment decreased from aHR = 1.33 (95%CI 1.3–1.37) in 2009 to aHR = 1.09 (95%CI
1.04–1.15) in 2016 (Supplementary Table 3).
We documented an increased hazard of death with increasing age and among men and this has been described
with older age in previous s tudies2. The increased hazard of death among 65+ year-olds compared to 15–24-year-
olds may relate to comorbidity and additional reasons for death among older patients. While older patients were
at greater hazard of death compared to younger patients, the SMR declined substantially with age in both men
and women. The greater impact of TB on SMRs therefore occurs in the younger population who have few other
causes of death. The frequency of other causes of death increased with age among both adults with TB and the
general population, and this resulted in the SMR declining with age. Despite a decrease in SMR over time, young
women (15–24-year-olds) who had TB, died at a rate 40 times greater than women of the same age without TB in
2016. This SMR was more than double that of men of the same age and is due to differences in both observed and
expected mortality. Observed mortality (TB CFR) was 1.5 times greater in women in this age group compared to
men. Annually, 250,000 women die during pregnancy in Africa with the majority of deaths due to non-obstetric
causes19. TB and HIV are among the main infectious causes of maternal d eaths19,20 and HIV and pregnancy may
Scientific Reports | (2021) 11:15894 | https://doi.org/10.1038/s41598-021-95331-w 6
Vol:.(1234567890)www.nature.com/scientificreports/
Figure 3. Standardised mortality ratio of adults (≥ 15 years) on drug-susceptible tuberculosis treatment by age
category and sex for 2009 and 2016, South Africa.
Figure 4. Standardised mortality ratios by HIV and sex of adults (≥ 15 years) on drug-susceptible tuberculosis
treatment in South Africa, 2009–2016.
Scientific Reports | (2021) 11:15894 | https://doi.org/10.1038/s41598-021-95331-w 7
Vol.:(0123456789)www.nature.com/scientificreports/
account for this higher CFR seen in young women. Interpersonal violence among young men in South Africa
remains common and among 10–17-year-olds who died due to injury, homicide was the leading cause, mainly
affecting young men21. This may contribute to the greater than expected mortality among men. In a study from
India, the SMR for TB decreased sharply with age from 15.1 among 15–44 year-olds, 7.3 among 45–59-year-olds
to 2.2 among those older than 60 y ears22 but was not disaggregated by sex and did not consider H IV22. This is
consistent with previous work in which the impact of HIV on TB mortality was greatest in younger TB patients23.
Similarly, a study from Kenya demonstrated that the SMR among TB patients decreased with age but was higher
in men than women because of a lower expected mortality among younger men and a higher observed mortality
among younger w omen24. The Kenyan study, conducted between 2006 and 2008, reflected a period where women
were disproportionately affected by HIV and did not have the benefit of widespread access to ART24. In more
recent work from Kenya, the SMR among TB patients was again shown to decrease with age; the SMR among
older patients (65–74-year-olds) was 7.6 in women and 7.9 in m en25 comparable with what we observed. The
TB SMR in 15–24-year-old women was 25.1 and 14.3 in men of the same a ge25 and reflects a similar difference
to what we have shown in this study (Supplementary Table 4).
Regardless of ART use, HIV infection was associated with an increased hazard of TB death. The greater haz-
ard among HIV-positive patients not on ART compared to HIV-positive patients on ART clearly demonstrates
the protective effect of ART. Specific concerns regarding men accessing HIV testing, ART services, retention in
care, and mortality have previously been raised6,9. The higher rate of ART initiation in women compared to men
was described from as early as 2004 with the differential between sexes increasing over t ime6. Several systematic
reviews have shown that within ART programs (especially in high burden settings), HIV-positive men have a
greater hazard of death compared to HIV-positive w omen10,11,26. In South Africa the effect of ART rollout on a
rural community has shown more rapid declines in mortality among women than men9. The increasing SMR
observed in HIV-positive women in this study reflects this greater reduction in general mortality among the
population of HIV-positive women who do not have TB. In a South African study reviewing the effect of ART
on mortality, SMRs in women were higher than men and this was attributed to the higher background mortal-
ity among m en27. Similarly, we noted much higher SMRs in women, especially in the younger age bands. This
reflects the lower number of expected deaths in this patient category (Supplementary Table 5). As South Africa
continues to move towards universal access to ART, monitoring of observed and expected mortality should
continue across the TB and HIV programs, to track changes over time and identify populations in greatest need
of targeted interventions and support.
The importance of adequate history taking, and prioritisation of individuals previously treated for TB is
highlighted by the additional risk of death among previously treated TB patients. Extrapulmonary TB was also
associated with an increased hazard of death, consistent with earlier d ata28,29 and may be due to more severe and
disseminated forms of disease, including TB meningitis.
This study was strengthened by the size of the individual patient data set and the span of 8 years, which pro-
vided the opportunity to evaluate temporal changes. We were however careful to only make inferences where
biologically plausible, consistent with scientific hypotheses and the literature, and where an effect size was of
epidemiological or clinical relevance. We explored effect modification by sex and time in stratified models and
while we found differences in point estimates our conclusions were unchanged. Limitations included the use
of TB death to refer to death due to any cause during TB treatment, possibly overestimating the effect of TB.
However, this is in accordance with international standardised definitions. A large proportion of TB patients had
unknown final treatment outcomes, which may have included mortality. Previous work from Malawi has sug-
gested up to 30% of patients lost to follow up may have died30. However, by not assuming patients with unknown
outcomes had died we have provided conservative CFRs and future work matching individuals with unknown
TB treatment outcomes to the population register to ascertain mortality has been planned. A further limitation
included the ART information in the TB register. ART use did not differentiate TB patients on ART before TB;
those who started ART during TB treatment; or adherence to ART. There was also no information on degree of
immunosuppression. We were unable to control for baseline nutritional status, anaemia, underlying disease, or
alcohol and drug use as additional risk factors for mortality.
Case fatality during treatment for drug-susceptible TB in South Africa is declining but remains high with
6.9% of TB patients dying during TB treatment in 2016. HIV co-infection, regardless of ART use, increased the
hazard of death during TB treatment. We show a disproportionate burden of TB mortality in young women,
with a mortality rate among 15–24-year-old women on TB treatment in 2016 more than 40 times greater than
for women of the same age in the general population. While future work to prospectively evaluate TB treatment
outcomes and risk factors for mortality among young women especially during pregnancy is needed, health
services have a clear indication of the need to engage young women during their routine access of health services.
Increased education on TB screening, diagnosis, early treatment and treatment completion among young healthy
women is needed. Additional care should be offered to young women diagnosed with TB to reduce mortality.
Received: 28 December 2020; Accepted: 20 July 2021
References
1. World Health Organization. Global Tuberculosis Report 2019 (World Health Organization, 2019).
2. Waitt, C. J. & Squire, S. B. A systematic review of risk factors for death in adults during and after tuberculosis treatment. Int. J.
Tuberc. Lung Dis. 15, 871–885. https://doi.org/10.5588/ijtld.10.0352 (2011).
3. Mukadi, Y. D., Maher, D. & Harries, A. Tuberculosis case fatality rates in high HIV prevalence populations in sub-Saharan Africa.
AIDS 15, 143–152. https://doi.org/10.1097/00002030-200101260-00002 (2001).
Scientific Reports | (2021) 11:15894 | https://doi.org/10.1038/s41598-021-95331-w 8
Vol:.(1234567890)www.nature.com/scientificreports/
4. South African Government. Outline of the national HIV Counselling and Testing (HCT) campaign by Dr Aaron Motsoaledi, Minister
of Health, https://www.gov.za/outline-national-hiv-counselling-and-testing-hct-campaign-dr-aaron-motsoaledi-minister-health
(2010).
5. South African National AIDS Council. National Strategic Plan on HIV, STIs and TB 2012–2016 (South African National AIDS
Council, 2011).
6. Johnson, L. F. Access to antiretroviral treatment in South Africa, 2004–2011. S. Afr. J. HIV Med. https://d oi.o
rg/1 0.4 102/s ajhiv med.
v13i1.156 (2012).
7. Abdool Karim, S. S. et al. Timing of initiation of antiretroviral drugs during tuberculosis therapy. N. Engl. J. Med. 362, 697–706.
https://doi.org/10.1056/NEJMoa0905848 (2010).
8. Odone, A. et al. The impact of antiretroviral therapy on mortality in HIV positive people during tuberculosis treatment: A sys-
tematic review and meta-analysis. PLoS ONE 9, e112017. https://doi.org/10.1371/journal.pone.0112017 (2014).
9. Bor, J. et al. Mass HIV treatment and sex disparities in life expectancy: Demographic surveillance in rural South Africa. PLoS Med.
12, e1001905. https://doi.org/10.1371/journal.pmed.1001905 (2015) (discussion e1001905).
10. Beckham, S. W. et al. Marked sex differences in all-cause mortality on antiretroviral therapy in low- and middle-income countries:
A systematic review and meta-analysis. J. Int. AIDS Soc. 19, 21106. https://doi.org/10.7448/IAS.19.1.21106 (2016).
11. Abioye, A. I. et al. Are there differences in disease progression and mortality among male and female HIV patients on antiretroviral
therapy? A meta-analysis of observational cohorts. AIDS Care 27, 1468–1486. https://doi.org/10.1080/09540121.2015.1114994
(2015).
12. Johnson, L. F. et al. Estimating the impact of antiretroviral treatment on adult mortality trends in South Africa: A mathematical
modelling study. PLoS Med 14, e1002468. https://doi.org/10.1371/journal.pmed.1002468 (2017).
13. Nadol, P. et al. Electronic tuberculosis surveillance systems: A tool for managing today’s TB programs. Int. J. Tuberc. Lung Dis. 12,
S8–S16 (2008).
14. Johnson, L. F. & Dorrington, R. E. Thembisa Version 4.1: A Model for Evaluating the Impact of HIV/AIDS in South Africa (University
of Cape Town, 2018).
15. World Health Organization. Definitions and Reporting Framework for Tuberculosis—2013 Revision. Report No. 978 92 4 150534 5
(WHO Press, 2014).
16. National Department of Health. National Tuberculosis Management Guidelines 2014 (National Department of Health, 2014).
17. Simelela, N. P. & Venter, W. D. A brief history of South Africa’s response to AIDS. S. Afr. Med. J. 104, 249–251. https://doi.org/10.
7196/samj.7700 (2014).
18. Cox, H. S. et al. Impact of Xpert MTB/RIF for TB diagnosis in a primary care clinic with high TB and HIV prevalence in South
Africa: A pragmatic randomised trial. PLoS Med. 11, e1001760. https://doi.org/10.1371/journal.pmed.1001760 (2014).
19. Grange, J. et al. Tuberculosis in association with HIV/AIDS emerges as a major nonobstetric cause of maternal mortality in Sub-
Saharan Africa. Int. J. Gynaecol. Obstet. 108, 181–183. https://doi.org/10.1016/j.ijgo.2009.12.005 (2010).
20. Sugarman, J., Colvin, C., Moran, A. C. & Oxlade, O. Tuberculosis in pregnancy: An estimate of the global burden of disease. Lancet
Glob. Health 2, e710–e716. https://doi.org/10.1016/s2214-109x(14)70330-4 (2014).
21. Mathews, S. et al. The South African child death review pilot: A multiagency approach to strengthen healthcare and protection
for children. S. Afr. Med. J. 106, 895–899. https://doi.org/10.7196/SAMJ.2016.v106i9.11234 (2016).
22. Kolappan, C., Subramani, R., Karunakaran, K. & Narayanan, P. R. Mortality of tuberculosis patients in Chennai, India. Bull World
Health Organ. 84, 555–560. https://doi.org/10.2471/blt.05.022087 (2006).
23. Osman, M. et al. The complex relationship between human immunodeficiency virus infection and death in adults being treated
for tuberculosis in Cape Town, South Africa. BMC Public Health 15, 556. https://doi.org/10.1186/s12889-015-1914-z (2015).
24. van’t Hoog, A. H. et al. Risk factors for excess mortality and death in adults with tuberculosis in Western Kenya. Int. J. Tuberc.
Lung Dis. 16, 1649–1656. https://doi.org/10.5588/ijtld.12.0135 (2012).
25. Onyango, D. O. et al. Reduction of HIV-associated excess mortality by antiretroviral treatment among tuberculosis patients in
Kenya. PLoS ONE 12, e0188235. https://doi.org/10.1371/journal.pone.0188235 (2017).
26. Druyts, E. et al. Male sex and the risk of mortality among individuals enrolled in antiretroviral therapy programs in Africa: A
systematic review and meta-analysis. AIDS 27, 417–425. https://doi.org/10.1097/QAD.0b013e328359b89b (2013).
27. Cornell, M. et al. Twelve-year mortality in adults initiating antiretroviral therapy in South Africa. J. Int. AIDS Soc. 20, 21902.
https://doi.org/10.7448/IAS.20.1.21902 (2017).
28. Manosuthi, W., Chottanapand, S., Thongyen, S., Chaovavanich, A. & Sungkanuparph, S. Survival rate and risk factors of mortality
among HIV/tuberculosis-coinfected patients with and without antiretroviral therapy. J Acquir. Immune Defic. Syndr. 43, 42–46.
https://doi.org/10.1097/01.qai.0000230521.86964.86 (2006).
29. Whalen, C. et al. Site of disease and opportunistic infection predict survival in HIV-associated tuberculosis. AIDS 11, 455–460.
https://doi.org/10.1097/00002030-199704000-00008 (1997).
30. Kruyt, M. L. et al. True status of smear-positive pulmonary tuberculosis defaulters in Malawi. Bull World Health Organ. 77, 386–391
(1999).
Acknowledgements
We would like to acknowledge the South African Department of Health, National TB program and the Research,
Information, Monitoring, Evaluation and Surveillance (RIMES) unit for the support and extraction of the ETR.
Net dataset.
Author contributions
M.O., C.v.S., A.W., P.N., A.C.H., and M.M.C. conceptualised the study. S.S.D. was responsible for data extrac-
tion. R.D. was responsible for data management, including cleaning and preparation. M.O., C.v.S., A.W. and
M.M.C. developed the analytical methods. All authors contributed towards interpreting the study results. M.O.
and M.C. completed the first draft of the manuscript, and all authors provided critical input on the manuscript
drafts and approved the final version.
Funding
The work reported herein was made possible through funding by the South African Medical Research Council
(SA MRC) through its Division of Research Capacity Development under the Bongani Mayosi National Health
Scholars Program from funding received from the Public Health Enhancement Fund/South African National
Department of Health to MO. The contents of any Publications from any studies during this Degree are solely
the responsibility of the authors and do not necessarily represent the official views of the SA MRC or the funders.
ACH is financially supported by the South African National Research Foundation through a South African
Research Chairs Initiative (SARChI). AW and CvS are supported financially by a grant from the South African
Scientific Reports | (2021) 11:15894 | https://doi.org/10.1038/s41598-021-95331-w 9
Vol.:(0123456789)www.nature.com/scientificreports/
National Research Foundation through its funding of the Centre of Excellence in Epidemiological Modelling and
Analysis. The financial assistance of the NRF towards this research is hereby acknowledged. Opinions expressed,
and conclusions arrived at, are those of the authors and are not necessarily to be attributed to the NRF.
JAS is supported by a Clinician Scientist Fellowship jointly funded by the UK Medical Research Council (MRC)
and the UK Department for International Development (DFID) under the MRC/DFID Concordat agreement
(MR/R007942/1).
MC is supported through the African Research Leader scheme by the UK MRC and DFID (MR/T008814/1) and
the EDCTP through a Senior Fellowship (TMA2018SF-2462).
Initial data extraction and cleaning was funded by URC through the TB Care II Project (USAID Co-operative
Agreement No. AID-OAA-A-10-00021).
Competing interests
The authors declare no competing interests.
Additional information
Supplementary Information The online version contains supplementary material available at https://doi.org/
10.1038/s41598-021-95331-w.
Correspondence and requests for materials should be addressed to M.O. or M.M.C.
Reprints and permissions information is available at www.nature.com/reprints.
Publisher’s note Springer Nature remains neutral with regard to jurisdictional claims in published maps and
institutional affiliations.
Open Access This article is licensed under a Creative Commons Attribution 4.0 International
License, which permits use, sharing, adaptation, distribution and reproduction in any medium or
format, as long as you give appropriate credit to the original author(s) and the source, provide a link to the
Creative Commons licence, and indicate if changes were made. The images or other third party material in this
article are included in the article’s Creative Commons licence, unless indicated otherwise in a credit line to the
material. If material is not included in the article’s Creative Commons licence and your intended use is not
permitted by statutory regulation or exceeds the permitted use, you will need to obtain permission directly from
the copyright holder. To view a copy of this licence, visit http://creativecommons.org/licenses/by/4.0/.
© The Author(s) 2021
Scientific Reports | (2021) 11:15894 | https://doi.org/10.1038/s41598-021-95331-w 10
Vol:.(1234567890)You can also read