Moving towards accurate and early prediction of language delay with network science and machine learning approaches
←
→
Page content transcription
If your browser does not render page correctly, please read the page content below
www.nature.com/scientificreports
OPEN Moving towards accurate and early
prediction of language delay
with network science and machine
learning approaches
Arielle Borovsky1*, Donna Thal2 & Laurence B. Leonard1
Due to wide variability of typical language development, it has been historically difficult to distinguish
typical and delayed trajectories of early language growth. Improving our understanding of factors
that signal language disorder and delay has the potential to improve the lives of the millions
with developmental language disorder (DLD). We develop predictive models of low language (LL)
outcomes by analyzing parental report measures of early language skill using machine learning and
network science approaches. We harmonized two longitudinal datasets including demographic and
standardized measures of early language skills (the MacArthur-Bates Communicative Developmental
Inventories; MBCDI) as well as a later measure of LL. MBCDI data was used to calculate several
graph-theoretic measures of lexico-semantic structure in toddlers’ expressive vocabularies. We use
machine-learning techniques to construct predictive models with these datasets to identify toddlers
who will have later LL outcomes at preschool and school-age. This approach yielded robust and
reliable predictions of later LL outcome with classification accuracies in single datasets exceeding
90%. Generalization performance between different datasets was modest due to differences in
outcome ages and diagnostic measures. Grammatical and lexico-semantic measures ranked highly in
predictive classification, highlighting promising avenues for early screening and delineating the roots
of language disorders.
Developmental language disorder (DLD) is a common language learning impairment that affects approximately
7% of school-aged c hildren1. This disorder is characterized by deficits in aspects of language functioning, while
showing normal learning/cognitive capacity, and the absence of biomedical explanations for a learning delay, such
as brain injury or hearing i mpairment2. DLD is associated with elevated risk for a host of negative psycho-social
and health outcomes including: psychiatric d elinquency4; experiencing
isorders3; incarceration and juvenile d
5 6
sexual assault ; lowered educational attainment and occupational s tatus ; social and interpersonal d ifficulties7;
and elevated healthcare costs8.
DLD is rarely diagnosed before a child approaches school age. Nevertheless, the roots of this disorder are
present even from infancy: Parents of children with DLD often report in retrospect that their child experienced
delays in meeting early communication m ilestones9. For example, Rudolph and Leonard (2016) asked parents
of 150 school-aged children (76 with DLD) to recall when their child reached two early language milestones
(onset of talking and onset of multi-word utterances). About half (55%) of children with DLD were reported
(in retrospect) to exhibit early delays in onset of talking (i.e. saying no words by 15 months), and/or onset of
multi-word combinations (i.e. not producing multi-word utterances by 24 months), whereas only 14% of children
with typical development (TD) exhibited a delay in one of these early milestones. Numerous groups have sought
to evaluate whether standardized parental report measures of language can prospectively identify school-age
language disorders from infancy and toddlerhood10. While standardized measures have identified broad differ-
ences between groups who do and do not eventually experience DLD, no early measure to date has had sufficient
sensitivity or specificity to serve as a reliable clinical marker of later disorder.
Using powerful computational tools, we seek to improve early DLD risk assessment via parental report of
early communication skills. Specifically, we focus on theory-driven measures that use as their starting point data
derived from the MacArthur-Bates Communicative Development Inventory (MBCDI). The MBCDI has many
1
Department of Speech, Language, and Hearing Sciences, Purdue University, West Lafayette, IN 47906,
USA. 2School of Speech, Language, and Hearing Sciences, San Diego State University, San Diego, CA,
USA. *email: aborovsky@purdue.edu
Scientific Reports | (2021) 11:8136 | https://doi.org/10.1038/s41598-021-85982-0 1
Vol.:(0123456789)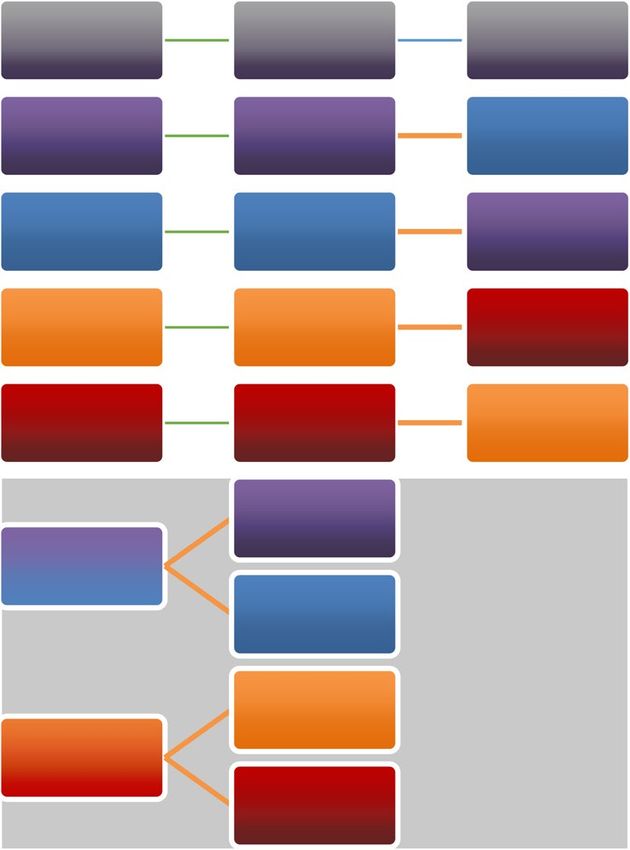
www.nature.com/scientificreports/
desirable properties that encourage prospects for wide distribution for screening in early clinical and educational
settings. It is a reliable, validated, and norm-referenced caregiver inventory of expressive vocabulary and other
early language skills that is easy to administer in a variety of settings; and it does not require a professional spe-
cialist for s coring11. The MBCDI Words and Sentences form assesses language skills in 16- to 30-month-olds,
and associates with numerous concurrent language processing abilities12,13. However, attempts to predict later
language diagnostic outcomes from this measure with standard linear modeling approaches have not been clini-
cally reliable14. We seek to build on prior attempts to predict later language outcome status from earlier MBCDI
vocabulary assessment by incorporating recent advances in machine learning and network science.
Graph‑theoretic measures of lexico‑semantic structure in expressive vocabulary. Network sci-
entists have built on mathematical advances in graph theory to gain insights into basic mechanisms in cognition
and learning—including factors that drive early word learning. For example, in cognitive neuroscience, network
science measures have characterized the complex dynamics of neural structure and function to illustrate how the
brain flexibly organizes information flow among neural areas according to the sensory, cognitive and learning
demands of a t ask15. Similarly, network science studies have illuminated patterns in growth of early vocabulary
acquisition that illustrate how early vocabularies are organized in multiple dimensions.
This network science approach to early vocabulary modeling involves the development of a network (or
graph), comprising a set of nodes (or vertices) that are connected via a set of links (or edges). Nodes connected
by links are neighbors, and neighborhoods are built from larger supersets of nodes and neighbors16. Graph-
theoretic (i.e. network) representations of early vocabulary include the words in a child’s expressive vocabulary
as the nodes, with semantic connections among words denoted by links in the network. We define links in each
child’s individual lexico-semantic network as from their MBCDI-reported vocabulary items that share overlap-
ork17,18. Importantly, using semantic features to describe relations among
ping semantic features, following prior w
words in early expressive vocabulary seems to explain variability in lexical processing in toddlers19–21, and also
explains unique variance in multiplex networks that model patterns in early word l earning22.
Network graph representations of lexico-semantic structure in vocabulary yield a number of measures. Here,
we include several network measures that vary among late-talking toddlers with early language d elays23. These
measures are: (1) Mean degree, which reflects the mean number of semantic connections between individual
words in the child’s vocabulary, (2) Global Clustering Coefficient, which provides an index of overall network
connectivity, and (3) Mean Path Length, which measures mean semantic distance between words. We addition-
ally include two other network measure suggested by an anonymous reviewer, (4) Betweenness centrality and
(5) Harmonic Centrality. We then use machine learning approaches to incorporate these network measures to
predict future language outcomes.
Predictive analytics using machine learning methods. Recent advances in computer science cou-
pled with the increasing availability of large datasets (i.e. “Big Data”) have stimulated rapid development of
sophisticated classifier algorithms that can identify diagnostic markers from complex datasets. These algorithms
can identify meaningful relations among multiple variables and outcomes that are not typically captured by
traditional linear models, including non-linear, radial, and discontinuous patterns. Among the most robust of
these algorithms, which we use in this project, is Random Forest modeling (RFs)25. RFs have demonstrated wide
utility in a variety of classification problems, outperforming over 100 other classifier algorithms in a variety of
datasets and testing conditions24. One benefit of RF algorithms is that they develop highly accurate classification
solutions while requiring only minimal assumptions about the structure of the data, and are robust against over-
fitting of selected training subsets. For instance, RF algorithms can develop accurate classifications of complex
datasets comprising multiple feature types (e.g. binary, categorical, numerical), and distributions (i.e. normality
is neither assumed nor required). Therefore, RF models require minimal pre-processing (e.g. no transformation
or rescaling) to provide accurate and generalizable solutions.
RF approaches also support insights into which variables contribute most toward classification accuracy25.
By comparing the accuracy of models with systematic inclusion or deletion of single variables (i.e. features), it
is possible to assess the relative “importance” or degree to which an individual feature contributes towards clas-
sification accuracy. We apply RF approaches to our datasets to assess overall classification accuracy for later low
language (LL) outcomes and to identify which variables support accurate classification.
Our approach: using novel methods with big data to improve early identification of
DLD. Though machine learning techniques are gaining popularity throughout clinical sciences for diagnostic
classification with large biomedical datasets26, this paper represents the first attempt to apply these methods to
predict future language outcomes. Similarly, though prior research suggests that graph-theoretic measures of
semantic structure correlate with concurrent language delay23, other research does not find this same relation27.
One potential unifying explanation could be that the importance of these factors changes across age and may
relate to potential for longer-term delays. No group has yet explored how these measures predict long-term out-
comes. Advances in this area have been hindered by the high cost of collecting large longitudinal datasets and
the intensive computational requirements of graph-theoretic and machine learning analyses.
We overcome these challenges and capitalize on advances in multiple disciplines by analyzing large datasets
collected by the first and second authors. Full description of these datasets—the Early Identification of Risk
for Language Impairment (EIRLI) and Language Acquisition and Semantic Relations (LASER) datasets—will
be detailed in the methods. By analyzing these individual and harmonized datasets, we address the following
questions:
Scientific Reports | (2021) 11:8136 | https://doi.org/10.1038/s41598-021-85982-0 2
Vol:.(1234567890)www.nature.com/scientificreports/
(1) Which variables support prediction of later language outcomes? Prior attempts have identified promis-
ing variables including: demographic measures, vocabulary size, early word combinations and morpho-
syntax14. We include these measures, while adding new measures of semantic structure in vocabulary. To
determine which variables best support subsequent identification of LL outcomes, we assessed feature
importance on models trained using all variables. Feature importance reflects each variable’s improvement
of classification accuracy in the model relative to a model without that variable. Based on prior studies
which highlighted differences in semantic structure in late-talking t oddlers23, we expected that semantic
structure measures should rank higher in importance than vocabulary size.
(2) Does feature importance change with age? Based on prior analyses by Thal and colleagues (2013)14, we
expected that demographic variables would better predict outcomes at younger ages, while MBCDI-derived
measures would have greater predictive validity for older toddlers.
(3) Is it possible to combine datasets to develop a general solution for diagnostic prediction ranging from pre-
school to school-age outcomes? We explored these data aggregation question in two ways: first, by assessing
the diagnostic performance of models trained on an aggregated dataset (in supplemental analyses); and by
testing whether models trained on one dataset generalize to the other.
Results
Initial evaluation of feature importance across datasets. The goal of these analyses is to identify
variables that most strongly predict language outcomes across four datasets: EIRLI-younger (303 TD, 11 LL);
EIRLI-older (374 TD, 16, LL); LASER-younger (73 TD, 12 LL); LASER-older (73 TD, 12 LL), using a selected
set of 14 features that include network measures of semantic structure in each child’s early productive lexicon,
overall vocabulary skill, grammatical ability, and demographic measures (see detailed description of all features
in Methods). On each dataset, using a nested cross validation approach, we trained 100 permutations of each
random forest model with all variables to identify the mean importance across permutations of each feature (i.e.
to identify the mean percentage change that each feature contributed to model classification accuracy). Within
each cross-validation fold, we initially carried out model training to select the top seven features ranked by
importance for further model training and evaluation in the outer cross-validation loops.
Feature importance in younger datasets. Figure 1a illustrates mean feature importance rankings across the
younger datasets modeled with all feature data. Although there is some variability in the ordering of features
across datasets, the MBCDI-derived features of semantic structure (including betweenness, degree, harmonic
centrality, path length and GCC) and vocabulary percentile appear consistently in the top seven ranked features
across both datasets.
Feature importance in older datasets. Figure 1b illustrates mean feature importance rankings across the older
datasets modeled with all feature data. High-ranking variables reflect morpho-syntactic complexity of speech
(combining words, grammatical complexity) and vocabulary size and structure (betweenness, percentile, degree,
path length).
Evaluation of model classification performance. Internal validation through repeated cross‑validation
in EIRLI and LASER datasets. Table 1 shows the binary classification performance of LL outcome from pruned
models including the top seven features identified in the previous section for each model. Data reported in each
column indicates model performance evaluation measures of: balanced accuracy (BalAcc); Sensitivity (Sens);
Specificity (Spec); positive predictive value (PPV); negative predictive values (NPV); positive likelihood ratio
(LR+); and negative likelihood ratio (LR−). All metrics illustrate moderate to strong classification performance
across the board, with the relatively “weakest” performing dataset being the younger EIRLI data, though even in
this case, the prediction classification performance is relatively strong.
External testing of EIRLI and LASER model generalization to each other. These analyses represent the most
challenging tests, as they explore whether models trained on either the EIRLI or LASER datasets can adequately
classify outcomes in the alternative dataset. This test is particularly difficult because outcome variables across
datasets were measured differently (EIRLI via self-report, LASER via direct testing) and at different ages (EIRLI
at school age, LASER at age 3). Table 2 illustrates theses analyses, which show more modest performance than
internal model tests. All models show relatively strong specificity and NPV, indicating that models tend to cor-
rectly identify children who do not have low language status compared to those who do.
Discussion
Efforts to improve early identification of language disorders have the potential to positively impact the biomedi-
cal, psychosocial, educational and economic well-being of millions of children. Accurate and stable identification
of language disorders from toddlerhood has been historically difficult, with prior efforts showing fair perfor-
mance and requiring data collated on the same children from multiple ages14. In this study, we embark on an
initial foray to ask whether we might improve identification accuracy from parental assessment of language skills
at a single age by leveraging advances in classification via machine learning coupled with our own theoretically-
informed network metrics of semantic structure in early vocabulary. The results are a promising initial step that
suggests such approaches hold potential to improve diagnostic accuracy of early language disorder and delay.
This project was guided by several primary questions. We interpret our study outcomes in light of these ques-
tions below.
Scientific Reports | (2021) 11:8136 | https://doi.org/10.1038/s41598-021-85982-0 3
Vol.:(0123456789)www.nature.com/scientificreports/
Figure 1. Feature importance rankings across younger and older datasets.
Train/Test BalAcc Sens Spec PPV NPV LR+ LR−
EIRLI-older .91*** .99 .82 .19 1 5.50 0.01
LASER-older .94*** 1 .88 .61 1 8.33 0.00
EIRLI-young .88*** 1 .76 .13 1 4.17 0.00
LASER-young .93*** 1 .87 .58 1 7.69 0.00
Aggregated-older .92*** .99 .85 .29 1 6.60 0.01
Aggregated-young .92*** 1 .84 .28 1 6.25 0.00
Table 1. Model performance on each dataset when trained and tested using repeated-cross validation.
***Balanced accuracy significantly exceeds baseline balanced accuracy of .50 where all cases are classified as
normal, all p values < .0001.
Our first question sought to address which variables provide the best predictive performance for later language
disorder and delay status. Here, we were primarily interested in whether measures of lexico-semantic structure
in the early expressive lexicon might contribute additional predictive performance. Prior predictive modeling
had only explored linear relations between simple vocabulary size and grammatical complexity in relation to
later language risk. The present findings indicate that the semantic structure measures boost model accuracy,
with these structure measures consistently falling within the top-ranked features that were retained in final
models. Betweenness, Degree and Path length were retained in all models, while GCC and HC were retained in
three out of four models. In fact, Betweenness and Degree were the top-two ranked features in three out of four
models, suggesting that these two variables contribute more to model classification accuracy than other vari-
ables. Additionally, in all four models, multiple semantic structure measures ranked more highly than simple
vocabulary size alone. We also included measures of morpho-syntactic (grammatical) complexity in datasets with
older toddlers, and the presence of word combinations in datasets with younger toddlers. Both measures tap
into grammatical complexity and ranked highly in several models, suggesting that these skills also contribute to
Scientific Reports | (2021) 11:8136 | https://doi.org/10.1038/s41598-021-85982-0 4
Vol:.(1234567890)www.nature.com/scientificreports/
Train Test BalAcc Sens Spec PPV NPV LR+ LR−
EIRLI-older LASER-older .54*** .37 .72 .19 .87 1.32 0.88
LASER-older EIRLI-older .55*** .23 .87 .085 .96 1.77 0.89
EIRLI-younger LASER-younger .46 .15 .76 .098 .84 0.63 1.12
LASER-younger EIRLI-younger .50 .41 .58 .10 .92 0.98 1.02
Table 2. Model performance for external validation, training and testing on separate datasets.
classification accuracy and prediction of outcomes. In general, demographic variables tended to show somewhat
lower variable importance ranking across models; although gender and race each contributed towards some of the
top-ranked features, though less consistently than the MBCDI-derived measures of language skills. Demographic
variables of family language risk, income, maternal and paternal education tended to contribute the least toward
classification accuracy. These insights contrast with a number of other studies which point to the importance of
socioeconomic factors in early language experience and g rowth28–30 as well as concentration of developmental
language disorders and delays among families31–33. This difference between the widely noted impact of SES on
language skills and our findings might be explained by a recent meta-analyses of numerous risk factors in DLD
which suggested that while socioeconomic measures and family history are statistically significant predictors of
language outcomes, they did not meet a bar for clinical significance as predictors of language d isorders34, which
we also seek to infer via markers of classification accuracy in the current project. We should note, however, that
both of the currently modeled datasets under-sample lower-SES populations, compared to the true demographic
distribution in the United States. Therefore, it is possible that this sparsity reduced the potential of these vari-
ables to contribute predictive power in these samples. Nevertheless, the fact that other demographic variables
do contribute towards classification accuracy is consistent with current recommendations for pediatric practice
which incorporate demographic indices of risk into developmental s urveillance35. At the same time, the strong
performance of other grammatical and lexico-semantic factors suggests current screening practices might be
improved with the inclusion of grammatical and semantic structure assessments of early language skills. From
a theoretical perspective, the robust rankings of MBCDI-derived measures suggest that the roots of language
disorder are likely to develop from differences in learning aspects of semantic and morpho-syntactic structure
in language.
Our final questions sought to evaluate model accuracy in early identification of low language outcomes. These
questions have primary importance to clinicians who wish to identify children who stand to benefit most from
early language intervention before preschool entry. Armed with several “rule-of-thumb” thresholds and prior
linear modeling outcomes as our guide, we can assess the models’ overall ability to identify language delays and
disorders in toddlerhood.
Model accuracy was highest when tested on untrained data drawn from a model’s own dataset distribution via
repeated cross-validation (Table 1). These models show overall excellent sensitivity and specificity (ranging from
0.82 to 1), and moderate to excellent positive and negative likelihood ratios. Balanced accuracy (ranging from
0.88 to 0.94) always significantly exceeded 0.50, which would result in cases where models simply categorized
all children as falling within the TD category (as may often happen when parents are advised to “wait and see”
to delay identification). Crucially, these models show classification improvement when compared to prior linear
modeling with the EIRLI dataset (where mean sensitivity, specificity, and balanced accuracy was 0.54, 0.84, and
0.70, respectively)14. While further work is needed to replicate and validate our findings, this improvement attests
to a promising potential to develop clinically useful models that build on large datasets to predict preschool and
school aged language outcomes from toddlerhood.
Models performed less well when predicting cases in the alternative dataset (Table 2). These cross-dataset
predictions represent the most difficult assessment in our study. Several aspects of our modeling approach were
geared towards reducing potential overfitting and promoting model generalizability, such as choice of algorithm
and feature pruning practices. Nevertheless, we found that models trained on either the EIRLI or LASER dataset
alone were relatively poorer at predicting cases from the alternative dataset.
There are several reasonable explanations for this decrement in cross-dataset performance. First, LL status
was defined differently between datasets. In the EIRLI dataset, LL status was assessed by whether a language or
reading disorder had been identified in school between ages 4–7—an assessment dependent on initial parental
report of positive identification in school (though later verified by the researchers). In contrast, the LASER project
screened all children at age 3 for presence of a language delay using a single standardized measure of CELF-P2.
These assessment approaches may have differentially tapped into endophenotype subgroups of DLD that show
relatively more pronounced difficulty in phonological short term memory (STM) vs. morpho-syntactic s kill36.
Specifically, the phonological STM endophenotype is often missed in younger children but emerges in reading
difficulties in word decoding at school age, while the morpho-syntactic endophenotype is more easily captured
at younger ages. Future work is needed to explore how endophenotype distributions affect early identification
by capturing more detailed outcome measures that distinguish between these groups.
Our groups were also assessed at different ages, and epidemiological studies suggest that prevalence of LL
is likely to be higher than typical identification in school settings. For example, in a sample of 216 children
with DLD who had been identified in an epidemiological study, only 29% of parents had been informed of
their child’s speech or language p roblem1. Because the EIRLI study relied on parental report of identification
in school, rather than fully screening the sample, the EIRLI dataset likely under-estimated the number of LL
Scientific Reports | (2021) 11:8136 | https://doi.org/10.1038/s41598-021-85982-0 5
Vol.:(0123456789)www.nature.com/scientificreports/
cases. A second difference is that each dataset measured outcomes at different ages (LASER at 36–37 months;
EIRLI at 4–7 years). In this case, the LASER dataset might over-identify delays in preschool that resolve before
elementary school. These two factors (screening method and age) are also likely to account for the differences in
LL prevalence among datasets (LASER: 14%, EIRLI: 4.3%). Dataset distribution comparisons (in Supplemental
Material) also illustrate differences in the distribution of demographic variables, potentially reflecting geographi-
cal differences (LASER was collected in a medium-sized city in northern Florida, whereas EIRLI is drawn from
a large metropolitan area in southern California). These sampling differences speak to a need for future work
with geographically- and demographically-diversified samples.
An additional limitation stems from the dataset sample size. Although the studied samples are relatively large
compared to many empirical studies exploring DLD, there was a relatively small number of positive cases overall.
While we incorporated synthetic data sampling approaches (SMOTE) to generate robust models, future work
is needed to capture larger numbers of positive cases. Fortunately, this goal is readily achievable. The MBCDI
is widely adapted and easily administered, with digital formats that allow for web and mobile-device enabled
versions that can be automatically scored. This instrument has already been deployed in large-scale projects with
more than 1000 children in several regions37,38. The rich set of words in the MBCDI supports comprehensive
network modeling of early vocabulary growth in toddlers, which in turn, supports rich insights into the nature
of early vocabulary growth and delay. However, the lengthy nature of these parental report vocabulary checklists
contrasts with other early screening measures, which prioritize brevity. For example, another common early
screening measure, the Ages and Stages Questionnaire, includes many fewer questions that tap into early lan-
guage skills. A promising next-step forward is to develop collaborative projects that merge rich early-screening
datasets from multiple measures with data on school-aged outcomes to optimize the ability to create effective
and efficient measures of early language risk.
With recent advances in clinical, behavioral, and computational fields, developmental scientists stand on
the precipice of a new era of early detection advancements that promise to improve the lives of millions. We
advance this cause in an initial attempt to apply machine-learning approaches to theoretically-derived measures
of language skills to demonstrate that these new tools have the potential to yield practical improvements in early
detection of language delay and disorder.
Methods
We use two large, longitudinal datasets that include MBCDI-derived measures of early vocabulary skills and
demographic variables along with outcome measures of later language/reading delays. Below, we describe each
dataset before outlining the pre-processing and analytic plans.
EIRLI dataset. The Early Identification of Risk for Language Impairment (EIRLI) dataset is part of a larger
project developed by the second author to explore how early gesture, vocabulary and language skills unfold
in early childhood (see Thal et al., 2013 for a detailed description of this project). In addition to collecting
demographic information and MBCDI data, researchers followed up with the families at school age (once a
year, between 4 and 7 years of age) and asked parents to report any diagnosis of a language or reading disorder.
Researchers verified these reports via documentation from school records or a clinician. Language/Reading
disorder outcome status was marked as “positive” if parents reported and verified any language or reading issue
at any of these ages. Our analyses focus on the subset of this sample for which item-coded MBCDI data exist
at 16 and/or 28 months (391 total), of which 17 (4.3%) later reported a school-age language/reading disorder.
LASER dataset. The Language Acquisition and Semantic Relations (LASER) archive stems from the first
author’s project designed to evaluate how MBCDI-derived semantic structure measures relate to early language
development. Children in this dataset were followed between 18 and 36 months. Parents completed the Words
and Sentences form of the MBCDI at quarterly intervals from 18 to 30 months, and children were evaluated
for language delay at 36 months using the Clinical Evaluation of Language Fundamentals—Preschool 2 (CELF-
P239). We selected demographic and vocabulary variables from the LASER dataset that would align with those
of the EIRLI dataset, including vocabulary data at 18 months, and 27 months, which were time points nearest
to available EIRLI dataset time points of 16 and 28 months. We also selected the same demographic variables as
available in the EIRLI dataset. The total dataset includes 85 children, of which 12 (14%) qualified for language
delay categorization based on sensitivity and specificity cutoff scores on the CELF-P2 (standard score < 85) at
36 months.
Additional information about the distribution of language skills and demographics in the EIRLI and LASER
samples are described in supplementary material sections (supplementary Table 1, and supplementary Figs. 1–5).
These analyses highlight patterns in data missingness across samples (supplementary Fig. 1), and some differences
in the distribution of variables, (supplementary Fig. 2). There are also patterns of correlations among variables
(supplementary Fig. 3). However, concerns about multi-collinearity are mitigated by the use of RF approaches
in modeling combined with feature selection and pruning which are robust against multi-collinearity40.
There are several notable differences between the datasets. First, there are geographic differences: EIRLI was
collected in a large metropolitan region in southern California, while LASER was collected in a medium-sized city
in northern Florida. The language outcome measures and ages in the EIRLI and LASER dataset are not identical.
While the 3-year-old language delay CELF-P2 measures in LASER indicates an elevated risk of persistent delay,
it is not a definitive language disorder, whereas the criteria in the EIRLI dataset represent a definitive language
disorder diagnosis. Therefore, we assign an umbrella term—Low Language (LL) Outcome—to refer children
in both groups who were either language delayed or disordered based on the criteria specified in each dataset.
Scientific Reports | (2021) 11:8136 | https://doi.org/10.1038/s41598-021-85982-0 6
Vol:.(1234567890)www.nature.com/scientificreports/
Ethical considerations. Parents in both datasets initially provided informed consent to participate in these
projects which both sought to explore how early language skills relate to later language outcomes. Both projects
received institutional review from the San Diego State University Institutional Review Board (EIRLI) and the
Florida State University Institutional Review Board (LASER) and all methods were carried out in accordance
with relevant guidelines and regulations. Our analyses involve secondary analysis of de-identified data subsets
from both projects.
MBCDI derived measures. We incorporate several measures from the MBCDI in these analyses including
measures of vocabulary size, structure, word combinations and grammatical complexity.
Vocabulary size. Due to the differences in age across datasets, we include percentile measures based on nor-
mative sampling for the MBCDI11, instead of raw scores. Percentile measures provide consistent comparisons
across datasets and age groups.
Vocabulary structure. We calculate several measures of semantic structure in MBCDI-reported vocabularies
using graph-theoretic modeling of individual toddlers’ noun-feature networks. First, networks are constructed
by assessing which of each child’s MBCDI-produced nouns share semantic features using a recently developed
dataset of semantic feature norms for all noun items within the M BCDI18,19. Nodes in each network are repre-
sented as nouns in the toddler’s expressive vocabulary, and links are represented by nouns that share at least two
semantic features in common. Based on these noun-feature networks, we calculated three connectivity measures
that have been previously identified as varying between early-talker and late-talker vocabularies23: (1) Mean
Path Length (MPL), (2) Global clustering coefficient (GCC), and (3) Mean Degree (MD), and two additional
measures suggested by a peer reviewer (4)Betweenness Centrality (BC), and (5) Harmonic Centrality (HC)41.
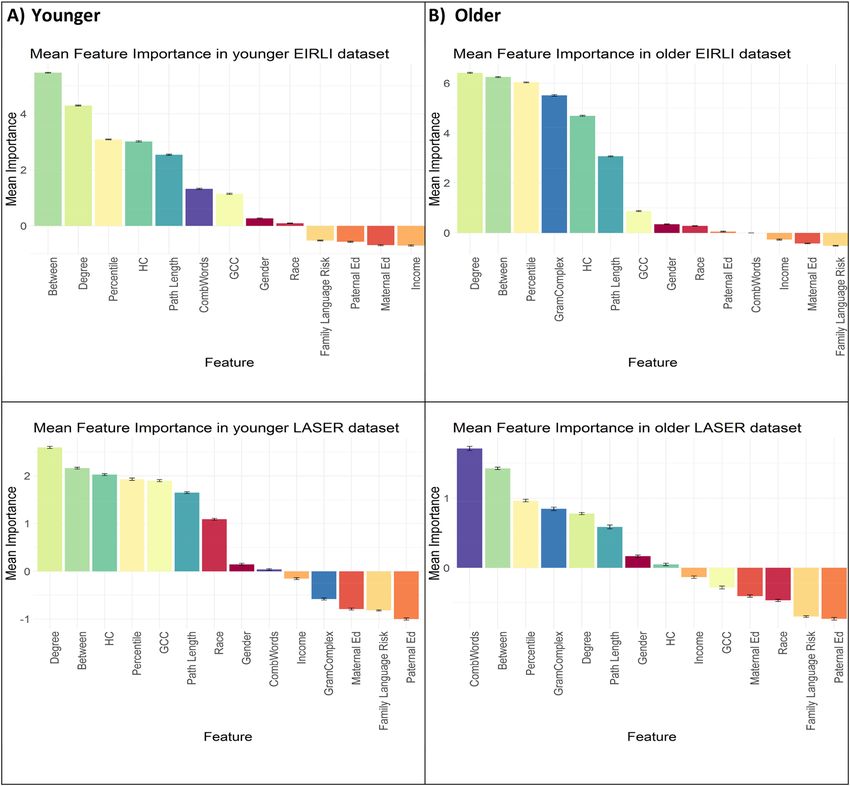
Description of network measures. We incorporate five network connectivity measures into our analyses: Mean
Path Length, Global Clustering Coefficient, Mean Degree, Betweenness Centrality, and Harmonic Centrality.
Figure 2 illustrates these measures in a small noun-feature network, and detailed description of each measure
follows.
(1) Mean Path Length (MPL). Path length (L) is defined as the shortest number of “hops” between any pair of
word nodes via semantically-overlapping feature links, with mean path length as the mean distance between
all connected node pairs in a network. For example the path length between apple and balloon in Fig. 2 is 2
(Lapple,balloon = 2), and the mean path length of all word pairs in the network is 1.17 (MPL = 1.17). Networks
with shorter mean path lengths have more efficient information transfer p roperties42. In the context of
lexical development, shorter mean path length is likely to support efficient activation and retrieval of word
meanings.
(2) Global clustering coefficient (GCC). Clustering coefficient (C) for any node is the total number of triangles
between the node’s neighbors divided by the total possible triangles. In Fig. 2, the clustering coefficient of
eye is 0.67 ( Ceye = 0.67). GCC measures the overall connectivity of the nouns in each toddler’s vocabulary.
GCC is calculated as the total number of words that are connected in closed triples divided by the total
number of connected t riples43. A connected triple is any set of three words (nodes) that shares semantic
links (e.g. in Fig. 2, apple/eye/balloon form a connected triple), and closed triples include cases where all
three nodes are interconnected (e.g. eye/ball/balloon form a closed triple in Fig. 2). The GCC of the noun-
feature network in Fig. 2 is 0.83. GCC values range from 0 to 1; a 0 value denotes that the child’s lexicon
has no connected triples, and 1 indicates that all triplets are closed. Toddlers with a higher GCC have
higher semantic connectivity of their vocabulary, with a higher proportion of vocabulary in semantic word
“neighborhoods” compared to children with a lower GCC.
(3) Mean Degree (MD). Degree (k) of each vocabulary item is measured by the number of other nodes for which
there is shared feature overlap (e.g. the keye = 3 in Fig. 2). Mean degree (MD) is calculated as the average
degree of all items in each toddler’s vocabulary network (MD in Fig. 2 = 2.5). Children with higher mean
degree vocabularies know more words with direct semantic neighbors compared to children with lower
mean degree vocabularies.
(4) Mean Betweenness Centrality (BC). Betweenness centrality of each vocabulary item is measured as the
number of times that word appears on the shortest path to all other node pairs in the network. This measure
represents the degree to which a word is central to the connections between other words in a network, by
appearing “between” other word pairs. Mean betweenness centrality is calculated as the mean betweenness
of each node across all words in the child’s network.
(5) Mean Harmonic Centrality (HC). Harmonic Centrality is a variant of closeness centrality, which are both
measures that capture how closely nodes in a network connect to other nodes. Harmonic centrality is
calculated as the inverse of the sum of all distances of a node between all other nodes, and then divided
by the number of words minus 1. Values range between 0 (indicating a word is not connected to any other
words) to 1 (a word is connected to every other word). This measure (unlike closeness centrality) can deal
with cases where there are unconnected nodes in a network, as is often the case in early vocabulary devel-
opment. Mean harmonic centrality is calculated as the average harmonic centrality of all words in each
child’s network.
Scientific Reports | (2021) 11:8136 | https://doi.org/10.1038/s41598-021-85982-0 7
Vol.:(0123456789)www.nature.com/scientificreports/
Network metrics:
Nodes = 4, Links = 5
MPL = 1.17, GCC = .84
MD = 2.5
BC = .25
HC = 2.75
Figure 2. An example noun-feature network with four nodes (words) and five links (indicating multiple
overlapping semantic features between words.)
Combining words. One item on the MBCDI that is often used as a milestone marker of language delay is
whether a child has begun to combine words into multi-word u tterances44. This question is posed as a single item
to parents, which states, “Has your child begun to combine words yet, such as “nother cracker” or “doggie bite?”.
There are three response options: ‘Not Yet’, ‘Sometimes’, and ‘Often’, with ‘Not Yet’ scored as a 0, and ‘Sometimes’
and ‘Often’ as 1.
Grammatical complexity. The MBCDI also asks parents to indicate whether their child is producing a number
of morpho-syntactic markers. Items ask caregivers to compare two example utterances that vary in morpho-
syntactic complexity and then identify which examples best correspond to their child’s language (e.g. the first
item asks parents to select between two shoe vs. two shoes). In a previous analysis of the EIRLI d
ataset14, this
grammatical complexity measure at 28 months predicted unique variance in later outcome status. Therefore, we
include this measure in our analyses.
Analytic approach. The data analysis pipeline comprises initial data selection and merging, modeling
using cross-validated datasets, selecting features within cross-validated folds, and evaluating model perfor-
mance. Additional exploration and description of data distributions is described in supplementary analyses.
Dataset merging, model training and evaluation steps follow below.
Dataset merging and variable inclusion. We initially selected identical variables for model training
across datasets to facilitate model comparison and evaluation. We included vocabulary size (as MBCDI percen-
tile), vocabulary structure (MPL, GCC, MD, BC, HC), and demographic variables (parental education, house-
hold income, race, gender, family history of speech or language disorder). To further support model building
and evaluation across both datasets, we aggregated the two datasets into a younger (EIRLI 16 month and LASER
18 month) dataset and older (EIRLI 28 month and LASER 27 month) dataset, with identical demographic and
vocabulary size and structure variables. Although LL status was determined using different measures and ages
between the two datasets, we nevertheless merged all positive and negative outcome results into a single column.
This procedure allowed us to determine whether it would be possible to develop general classifier models that
could identify risk for poor language outcomes across the preschool and early school-age period.
Initial model training and feature ranking. We sought to identify which variables predict later out-
comes across datasets using a random forest (RF) modeling approach. We were particularly interested in deter-
mining whether variable importance would change across aggregated older and younger datasets, and whether
there is agreement between EIRLI and LASER datasets at each age. We provide a general description of RF
modeling in Supplementary materials, and model parameters below.
Description of random forest modeling techniques. RF models are developed by building a collection of indi-
vidual “weak learner” decision trees (i.e. each individual tree is prone to over-fitting and over-generalization).
These decision trees are fit on random orderings and subsets of variables within the dataset, and generate “split
points” at each tree which reflect binary (Yes/No) predictor thresholds (e.g. Is gender Male? Is vocabulary per-
centile between 25 and 75?). Each random subset of predictors is termed a “node” and predictor thresholds are
selected to optimize model accuracy. This process is iteratively repeated to produce trees of varying “depths”
with multiple nodes, resulting in a single decision tree. This process is repeated multiple times (500 in the cur-
rent study), creating a “forest” of trees, which when combined results in a robust “stronger learner” model that
is less susceptible to overfitting25. Importantly, as these models generate solutions using decision trees, rather
than linear regression, they are able to accurately identify both linearly- and nonlinearly- separable solutions.
Randomly selected subsets of the data and subsets of variables are repeatedly selected and subjected to a decision
tree algorithm. This random variable selection process serves to combat issues with multi-collinearity in large
datasets by reducing correlation among decision trees.
Random forest modeling parameters and feature ranking. To build initial models we use a nested cross-valida-
tion approach using a random forest algorithm, with three-fold repeated cross validation and 10 repetitions in
the outer loop, five-fold repeated cross validation and 10 repetitions in the inner feature selection loop, using
45. The goal of this nested approach is to reduce possibility of data leakage by carrying out
the caret package in R
feature selection on cross-validated subsets of data that do not contribute to the final tuned model46. Random
forest models were set to a standard tree size (ntree = 500 trees), and tuned for optimal mtry (i.e. the number of
Scientific Reports | (2021) 11:8136 | https://doi.org/10.1038/s41598-021-85982-0 8
Vol:.(1234567890)www.nature.com/scientificreports/
features included at each split of each tree, ranging from 2 to the total number of features in each dataset). Due
to the relatively low incidence of children with LL in all datasets, we employed Synthetic Minority Oversampling
Technique (SMOTE) to balance modeling data47. This balancing method generates synthetic samples in train-
ing data using a k-nearest neighbors algorithm to generate new and synthetic samples of the minority (positive
diagnostic) class with similar properties to the existing dataset. Model training was repeated 100 times on each
dataset, and feature selection was carried out 100 times within each cross-validation fold and repeated 10 times.
Within the inner loop of the nested cross validation procedure, we evaluated which features best contribute to
model accuracy using a mean model importance metric across all 100 training instances. Importance for a single
model is calculated by comparing the difference in classification accuracy (i.e. the percentage of cases correctly
classified) of the full model compared to a model with that single feature removed.
Mean feature importance was then ranked, and the top seven features were selected for final model train-
ing in the outer cross-validation loop. The goal of pruning features to a subset is to reduce potential for model
overfitting, and thereby increase the potential of models to improve their potential for external generalizability.
Because 14 total features are used in initial full model training, seven features represents a selection of the top
half of variables.
Model performance evaluation. In all cases, we evaluate model performance on untrained examples in
the dataset. For internal validation, we ask how well models correctly predict cases drawn from their initially
trained datasets by evaluating performance on data that are held back through repeated cross-validation (i.e. by
testing on the “out-of-bag” samples). This internal validation approach assesses how well models predict lan-
guage diagnostic status on cases that are drawn from their original dataset distribution (e.g. How well do models
trained on the EIRLI dataset perform on other values in the EIRLI dataset?). During external validation, we
evaluate how models trained on one dataset generalize to another (e.g. if models trained on EIRLI predict out-
comes in LASER and vice versa). These kinds of external assessments represent the most difficult tests of model
performance, and allow us to address questions about whether and how models trained to predict LL status at
preschool age (LASER) vs. school-aged (EIRLI) transfer to each other.
Figure 3 outlines a visual schematic of our strategy for training and internal and external model performance
testing across datasets.
Classification measures. During the outer cross-validation model training loop, we assess the performance
of each model permutation trained via repeated cross-validation by assessing the accuracy of classification on
untrained cases. These results are collated into a confusion matrix, which is a 2 × 2 table that represents correct
vs. predicted classification of LL status48. We use confusion matrices of model performance to calculate several
metrics including: balanced accuracy; sensitivity; specificity; positive and negative predictive value; and positive
and negative likelihood ratios49.
We use confusion matrices of model performance to calculate several metrics including: balanced accuracy;
sensitivity; specificity; positive and negative predictive value; and positive and negative likelihood ratios. Sen-
sitivity is defined as the proportion of children who are classified by the models with positive LL status out of
all of the children with true LL, while specificity indicates the proportion of children that are classified as not
having LL out of those who truly do not. Balanced accuracy is calculated by taking the mean of sensitivity and
specificity values. This measure provides an overall index of model performance while balancing for differences
in positive and negative LL class size. Positive predictive values (PPV) indicate the proportion of times the model
correctly indicates the presence of LL out of all instances where LL is present, while negative predictive values
(NPV) indicate how often the model correctly indicates the absence of LL out of all instances where it indicates
LL is not present. All model evaluation metrics, except for likelihood ratios, vary between 0 and 1 with higher
values indicating better performance. Plante and Vance (1994) recommended that language identification assess-
ments with sensitivity and specificity ranging between 0.9 and 1 are considered “good,” while measures ranging
between 0.8 and 0.89 are considered “fair.”50 Though these thresholds are helpful in establishing a rule-of-thumb
metric for identification quality, we are additionally interested in assessing how current modeling approaches
improve on prior classification attempts using MBCDI derived measures. In prior work using linear modeling
approaches to classify outcomes with the EIRLI dataset14, mean model sensitivity was 0.54 (range = 0.41–0.69);
mean specificity was 0.85 (range = 0.69–0.95); mean balanced accuracy was 0.70 (range = 0.68–0.71); mean PPV
was 0.26 (range = 0.14–0.37); and, mean NPV was 0.96 (range = 0.95–0.97). Although there are important dif-
ferences between this prior work and the present project, we take these measures as a reasonable “baseline” by
which to compare performance in the current study. We additionally calculate positive and negative likelihood
ratios (LR+ and LR−, respectively) for model performance following recommendations for appraising clinical
evidence in communication disorders when clinical prevalence is relatively rare51. LR+ ranges from 1 to infin-
ity, and higher values reflect greater confidence that a positive test classification indicates a true positive result;
LR+ values above 3 are considered to be moderately positive, and 10 is very positive. LR− ranges from 1 to 0 and
smaller values reflect greater confidence that a negative classification indicates a negative result; values below
0.3 are considered moderately negative, and below 0.1 are strongly negative. LR+ is calculated as: sensitivity /
(1-specificity) and LR- is calculated as: (1 − sensitivity)/specificity. Although likelihood ratios are not reported in
Thal and colleagues (2013), we calculated each of these measures based on their reported sensitivity and specific-
ity. In that prior study, mean LR+ was 5.0 (range = 2.2–8.2) and mean LR− was 0.53 (range = 0.44–0.62), and we
consider these likelihood ratios as an additional baseline comparison for the current project. Finally, in other
pilot testing of the modeling approach using randomized “shuffled” labels, these models tended to converge on
classification solutions that categorized all cases in the “normal language” or negative diagnostic category, yielding
Scientific Reports | (2021) 11:8136 | https://doi.org/10.1038/s41598-021-85982-0 9
Vol.:(0123456789)www.nature.com/scientificreports/
Train Pruned
Test Internal Test External
models
EIRLI16 EIRLI 16 LASER18
LASER18 LASER18 EIRLI16
EIRLI28 EIRLI28 LASER27
LASER27 LASER27 EIRLI28
EIRLI16
EIRLI16
LASER 18
LASER18
EIRLI28
EIRLI28
LASER27
LASER27
Figure 3. Visual schematic of strategy for model training and testing on internal and external cases from each
dataset. Aggregated dataset models (depicted on gray background) reported in Supplemental Material.
balanced accuracy of 0.5. Therefore, we conduct t-test comparisons of the balanced accuracy measures of trained
models against 0.5 to determine whether our model performance exceeded this additional “baseline” threshold.
Data availability
Upon publication, we will publish the participant demographic and MBCDI-derived variables that contributed
to these analyses at http://www.osf.io/uf3vp/.
Received: 30 June 2020; Accepted: 28 February 2021
References
1. Tomblin, J. B. et al. Prevalence of Specific Language Impairment in kindergarten children. J. Speech Lang. Hear. Res. 40, 1245 (1997).
2. Leonard, L. B. Children with Specific Language Impairment (MIT Press, 2014).
3. Im-Bolter, N. & Cohen, N. J. Language impairment and psychiatric comorbidities. Pediatr. Clin. N. Am. 54, 525–542 (2007).
4. Bryan, K., Freer, J. & Furlong, C. Language and communication difficulties in juvenile offenders. Int. J. Lang. Commun. Disord.
42, 505–520 (2007).
5. Brownlie, E. B., Jabbar, A., Beitchman, J., Vida, R. & Atkinson, L. Language impairment and sexual assault of girls and women:
Findings from a community sample. J. Abnorm. Child Psychol. 35, 618–626 (2007).
6. Johnson, C. J., Beitchman, J. H. & Brownlie, E. B. Twenty-year follow-up of children with and without speech-language impair-
ments: Family, educational, occupational, and quality of life outcomes. Am. J. Speech-Language Pathol. 19, 51–65 (2010).
7. Botting, N. & Conti-Ramsden, G. The role of language, social cognition, and social skill in the functional social outcomes of young
adolescents with and without a history of SLI. Br. J. Dev. Psychol. 26, 281–300 (2008).
8. Le, H. N. D. et al. Health-related quality of life, service utilization and costs of low language: A systematic review. Int. J. Lang.
Commun. Disord. 55, 3–25 (2020).
9. Rudolph, J. M. & Leonard, L. B. Early language milestones and specific language impairment. J. Early Interv. 38, 41–58 (2016).
10. Rescorla, L. A. & Dale, P. S. Late Talkers: Language development, interventions, and outcomes (Paul H. Brookes, 2013).
11. Fenson, L. et al. MacArthur-Bates Communicative Development Inventories: User’s Guide and Technical Manual 2nd edn. (Brookes
Publishing, 2007).
12. Fernald, A., Perfors, A. & Marchman, V. A. Picking up speed in understanding: Speech processing efficiency and vocabulary growth
across the 2nd year. Dev. Psychol. 42, 98–116 (2006).
13. Rämä, P., Sirri, L. & Serres, J. Development of lexical–semantic language system: N400 priming effect for spoken words in 18- and
24-month old children. Brain Lang. 125, 1–10 (2013).
14. Thal, D. J., Marchman, V. A. & Tomblin, J. B. Late-talking toddlers: Characterization and prediction of continued delay. In Late
Talkers: Language Development, Interventions, and Outcomes (eds Rescorla, L. A. & Dale, P. S.) 169–202 (Paul H. Brookes, 2013).
15. Medaglia, J. D., Lynall, M. E. & Bassett, D. S. Cognitive network neuroscience. J. Cogn. Neurosci. 27, 1471–1491 (2015).
16. Steyvers, M. & Tenenbaum, J. B. The large-scale structure of semantic networks: Statistical analyses and a model of semantic growth.
Cogn. Sci. 29, 41–78 (2005).
17. Hills, T. T., Maouene, M., Maouene, J., Sheya, A. & Smith, L. Categorical structure among shared features in networks of early-
learned nouns. Cognition 112, 381–396 (2009).
Scientific Reports | (2021) 11:8136 | https://doi.org/10.1038/s41598-021-85982-0 10
Vol:.(1234567890)www.nature.com/scientificreports/
18. Peters, R. & Borovsky, A. Modeling early lexico-semantic network development: Perceptual features matter most. J. Exp. Psychol.
Gen. 148, 763–782 (2019).
19. Borovsky, A. & Peters, R. E. Vocabulary size and structure affects real-time lexical recognition in 18-month-olds. PLoS ONE 14,
e0219290 (2019).
20. Borovsky, A. When slowing down processing helps learning: Lexico-semantic structure supports retention, but interferes with
disambiguation of novel object-label mappings. Dev. Sci. https://doi.org/10.1111/desc.12963 (2020).
21. Peters, R. E., Kueser, J. B. & Borovsky, A. Perceptual connectivity influences Toddlers’ attention to known objects and subsequent
label processing. Brain Sci. 11, 163 (2021).
22. Stella, M., Beckage, N. M. & Brede, M. Multiplex lexical networks reveal patterns in early word acquisition in children. Sci. Rep.
7, 46730 (2017).
23. Beckage, N., Smith, L. & Hills, T. Small worlds and semantic network growth in typical and late talkers. PLoS ONE 6, e19348 (2011).
24. Fernández-Delgado, M., Cernadas, E., Barro, S., Amorim, D. & Fernández-Delgado, A. Do we need hundreds of classifiers to solve
real world classification problems?. J. Mach. Learn. Res. 15, 3133–3181 (2014).
25. Breiman, L. Random forests. Mach. Learn. 45, 5–32 (2001).
26. Gao, C. et al. Model-based and model-free machine learning techniques for diagnostic prediction and classification of clinical
outcomes in Parkinson’s disease. Sci. Rep. https://doi.org/10.1038/s41598-018-24783-4 (2018).
27. Jimenez, E. & Hills, T. T. Network analysis of a large sample of typical and late talkers. in Proceedings of the 39th Annual Meeting
of the Cognitive Science Society (eds. Gunzelmann, G., Howes, A., Tenbrink, T. & Davelaar, E. J.) 2302–2307 (Cognitive Science
Society, 2017).
28. Fernald, A., Marchman, V. A. & Weisleder, A. SES differences in language processing skill and vocabulary are evident at 18 months.
Dev. Sci. 16, 234–248 (2013).
29. Hart, B. & Risley, T. Meaningful Differences in Everyday Parenting and Intellectual Development in Young American Children
(Brookes, 1995).
30. Hoff, E. Interpreting the early language trajectories of children from low-SES and language minority homes: Implications for
closing achievement gaps. Dev. Psychol. 49, 4–14 (2013).
31. Benasich, A. A., Spitz, R. V., Tallal, P. & Flax, J. Look who’s talking: A prospective study of familial transmission of language impair-
ments. J. Speech Lang. Hear. Res. 40, 990–1001 (1997).
32. Lahey, M. & Edwards, J. Specific language impairment: Preliminary investigation of factors associated with family history and with
patterns of language performance. J. Speech Hear. Res. 38, 643–657 (1995).
33. Tomblin, J. B. Familial concentration of developmental language impairment. J. Speech Hear. Disord. 54, 287–295 (1989).
34. Rudolph, J. M. Case history risk factors for specific language impairment: A systematic review and meta-analysis. Am. J. Speech
Lang. Pathol. 26, 991–1010 (2017).
35. Lipkin, P. H. & Macias, M. M. Promoting optimal development: Identifying infants and young children with developmental
disorders through developmental surveillance and screening. Pediatrics 145, e20193449 (2020).
36. Bishop, D. V. M., Adams, C. V. & Norbury, C. F. Distinct genetic influences on grammar and phonological short-term memory
deficits: Evidence from 6-year-old twins. Genes Brain Behav. 5, 158–169 (2006).
37. Collisson, B. A. et al. Risk and protective factors for late talking: An epidemiologic investigation. J. Pediatr. 172, 168-174.e1 (2016).
38. Kristoffersen, K. E. et al. The use of the internet in collecting CDI data—An example from Norway. J. Child Lang. 40, 567–585
(2013).
39. Semel, E. M., Wiig, E. H. & Secord, W. Clinical Evaluation of Language Fundamentals-Preschool 2nd edn. (Pearson, 2004).
40. Matsuki, K., Kuperman, V. & Van Dyke, J. A. The Random Forests statistical technique: An examination of its value for the study
of reading. Sci. Stud. Read. 20, 20–33 (2016).
41. Yin, C. et al. Network science characteristics of brain-derived neuronal cultures deciphered from quantitative phase imaging data.
Sci. Rep. https://doi.org/10.1038/s41598-020-72013-7 (2020).
42. Albert, R. & Barabási, A. L. Statistical mechanics of complex networks. Rev. Mod. Phys. 74, 47–97 (2002).
43. Newman, M. E. J., Moore, C. & Watts, D. J. Mean-field solution of the small-world network model. Phys. Rev. Lett. 84, 3201–3204
(2000).
44. Bright Futures, 3rd Edition. Guidelines for Health Supervision of Infants, Children, and Adolescents (American Academy of Pediatrics,
2007).
45. Kuhn, M. Building predictive models in R using the caret package. J. Stat. Softw. 28, 1–26 (2008).
46. Ambroise, C. & McLachlan, G. J. Selection bias in gene extraction on the basis of microarray gene-expression data. Proc. Natl.
Acad. Sci. USA 99, 6562–6566 (2002).
47. SMOTE: Synthetic Minority Over-sampling Technique. Available at: https://www.cs.cmu.edu/afs/cs/project/jair/pub/volume16/
chawla02a-html/chawla2002.html. (Accessed: 9th January 2020).
48. Ting, K. M. Confusion matrix. In Encyclopedia of Machine Learning (eds Sammut, C. & Webb, G. I.) (Springer US, 2011). https://
doi.org/10.1007/978-0-387-30164-8_157.
49. Kohl, M. Performance measures in binary classification. Int. J. Stat. Med. Res. 1, 79–81 (2012).
50. Plante, E. & Vance, R. Selection of preschool language tests. Lang. Speech. Hear. Serv. Sch. 25, 15–24 (1994).
51. Dollaghan, C. A. Appraising diagnostic evidence. in The Handbook for Evidence-Based Practice in Communication Disorders 81–104
(Brookes Publishing, 2007).
Acknowledgements
We are grateful to the many families who generously contributed their time to these projects over the years. We
wish to dedicate this work to Elizabeth Bates and Jeffrey Elman, whose fundamental insights into measurement
and computation of early language skills made this work possible. This paper has also been improved by Keith
Kluender, who provided comments on an earlier draft of this paper. This research was financially supported by
grants from the National Institutes of Health: DC013638, HD052120, DC000482, and DC018593.
Author contributions
A.B. and D.T. collected the data. L.B.L. contributed to the clinical and theoretical framework of the design. A.B.
designed the computational framework and analyzed the data. All authors discussed the results and commented
on the writing of the manuscript.
Competing interests
The authors declare no competing interests.
Scientific Reports | (2021) 11:8136 | https://doi.org/10.1038/s41598-021-85982-0 11
Vol.:(0123456789)You can also read